HDFCLifeHDFCLife has a very long consolidation and going up and down in the range.
Previous wave has a downfall and not it is started with uptrend. So some uptrend it has small correction and ready to move up side.
So, above 770 we can see upside movement till the 800-820.
So, as per technical it's good

Black Friday
The greatest deal of the year is here.Get it before the point of no return.

Consolidation face ends? Anuras has been in some decent consolidation for last 6 months and has seen strong volumes in last 2-3 session. Post results season buying is intriguing since not much happened post call. Watch out for some action. Please note RSI is 76 so take position according to your appetite.

H&S pattern Bearish in SBICARDHead & Shoulders pattern finished in SBICARD.
On breakdown of trendline, will target the downside target equal to the range of head (from top of head to neckline)
Targets are mentioned, including key levels in between. Stop is above halfway of the right shoulder

INFOSYS MY TECHNICAL VIEWS 19-11-25After retest of support, multiple times, price ready to go up.
Nifty It and Infosys charts are almost identical..
Nifty is already in trend. VIX Normal. dollar index below 100. Good delivery. Everything look perfect. Anything missing?
Your views and suggestion are invited.

Bitcoin Turn Bearish In Monthly Time frameWhat’s going on
Bitcoin slipped significantly this week, dropping into the US$90,000–96,000 range, marking roughly a 10% decline for the week.
The decline has pushed BTC to trade around 20-25% below its all-time high of US$126,200.
On-chain data shows that long-term holders (those who typically h

BNB/USDT – Bullish Reversal Idea | Demand Zone Reaction📌 Overview
BNB is currently trading at a major higher-timeframe demand zone, showing early signs of accumulation after a sharp sell-off. Price has tapped the demand area multiple times and is holding without breaking structure to the downside.
This setup is based on a potential short-term reversal

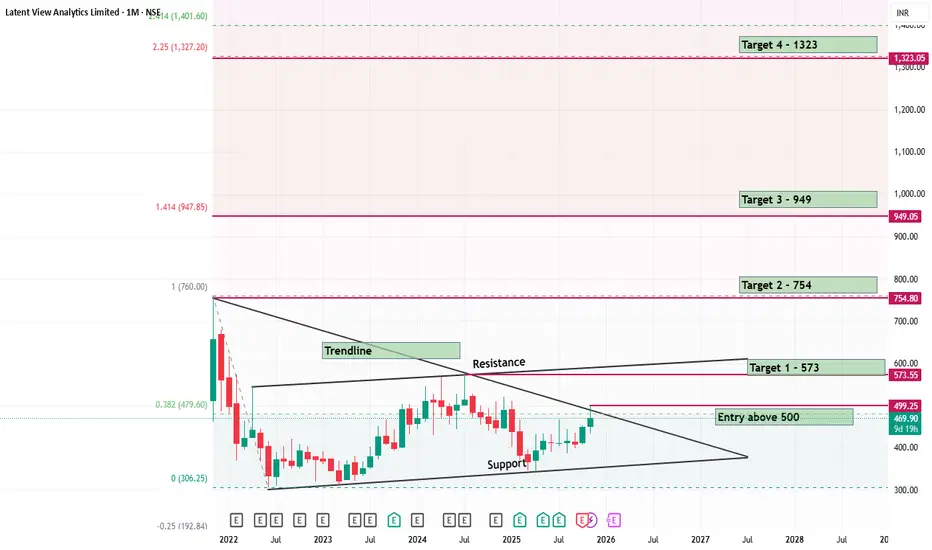
Latent View a Hidden Gem BUY with 2 Years Horizon
BUY LATENT VIEW
BUY ABOVE RS500 AND HOLD FOR 2 YEARS FOR A TARGET OF 1323.
Stock needs to break the upside resistance of Rs 573 with an entry on monthly close above 500.
It will rocket above 754 with is the the all time high.
Plotted the trendline for your understnading.
Below is the companies
BUY TODAY SELL TOMORROW for 5%DON’T HAVE TIME TO MANAGE YOUR TRADES?
- Take BTST trades at 3:25 pm every day
- Try to exit by taking 4-7% profit of each trade
- SL can also be maintained as closing below the low of the breakout candle
Now, why do I prefer BTST over swing trades? The primary reason is that I have observed that

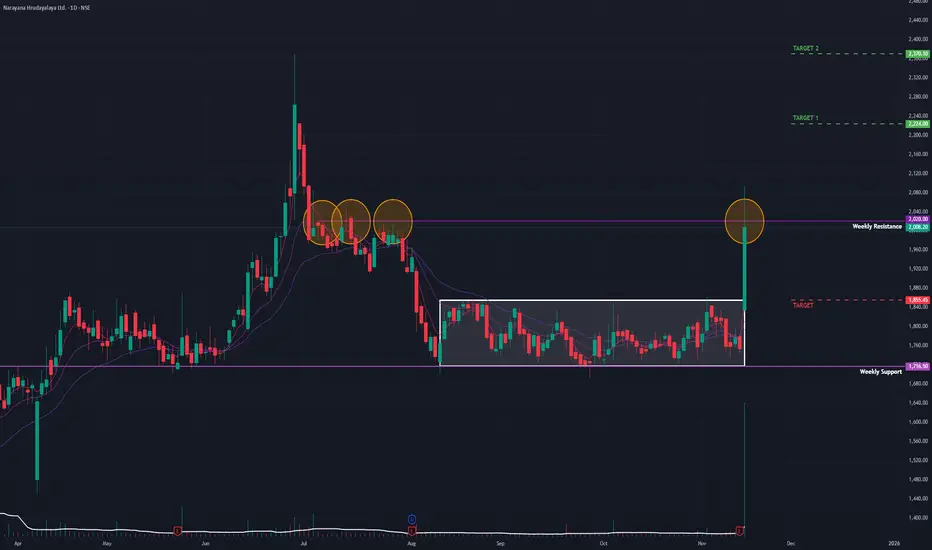
Narayana Hrudayalaya (D): Earnings-Driven BreakoutThe stock has decisively broken out of a 3-month consolidation phase. This technical breakout is powered by a strong fundamental catalyst (Q2 earnings), validating the surge and the high volume.
🚀 1. The Fundamental Catalyst (The "Why")
The breakout is a direct reaction to the company's Q2 FY26
Technical View: Engineers India Ltd (EIL)Pattern Formation
The stock is moving inside a sideways accumulation range between ₹188–₹200.
Multiple swing highs formed in the ₹212–₹220 region created a liquidity pool.
Price repeatedly wicked above these highs, indicating Buy-Side Liquidity Hunt.
Breakout Behaviour
A strong bullish

See all editors' picks ideas
Holographic Market Microstructure | AlphaNattHolographic Market Microstructure | AlphaNatt
A multidimensional, holographically-rendered framework designed to expose the invisible forces shaping every candle — liquidity voids, smart money footprints, order flow imbalances, and structural evolution — in real time.
---
📘 Overview
The Hol

PriceFormatLibrary for automatically converting price values to formatted strings
matching the same format that TradingView uses to display open/high/low/close prices on the chart.
█ OVERVIEW
This library is intended for Pine Coders who are authors of scripts that display numbers onto a user's charts. T

LogNormalLibrary "LogNormal"
A collection of functions used to model skewed distributions as log-normal.
Prices are commonly modeled using log-normal distributions (ie. Black-Scholes) because they exhibit multiplicative changes with long tails; skewed exponential growth and high variance. This approach i

Range Oscillator (Zeiierman)█ Overview
Range Oscillator (Zeiierman) is a dynamic market oscillator designed to visualize how far the price is trading relative to its equilibrium range. Instead of relying on traditional overbought/oversold thresholds, it uses adaptive range detection and heatmap coloring to reveal where pri

Volume Surprise [LuxAlgo]The Volume Surprise tool displays the trading volume alongside the expected volume at that time, allowing users to spot unexpected trading activity on the chart easily.
The tool includes an extrapolation of the estimated volume for future periods, allowing forecasting future trading activity.
🔶 U

Smooth Theil-SenI wanted to build a Theil-Sen estimator that could run on more than one bar and produce smoother output than the standard implementation. Theil-Sen regression is a non-parametric method that calculates the median slope between all pairs of points in your dataset, which makes it extremely robust to o

Fair Value Gaps by DGTFair Value Gaps
A refined, multi-timeframe Fair Value Gap (FVG) detection tool that brings institutional imbalance zones to life directly on your chart.
Designed for precision, it visualizes how price delivers into inefficiencies across chart, higher, and lower (intrabar) timeframes — offering a fl

TASC 2025.11 The Points and Line Chart█ OVERVIEW
This script implements the Points and Line Chart described by Mohamed Ashraf Mahfouz and Mohamed Meregy in the November 2025 edition of the TASC Traders' Tips , "Efficient Display of Irregular Time Series”. This novel chart type interprets regular time series chart data to create an ir

Simplified Percentile ClusteringSimplified Percentile Clustering (SPC) is a clustering system for trend regime analysis.
Instead of relying on heavy iterative algorithms such as k-means, SPC takes a deterministic approach: it uses percentiles and running averages to form cluster centers directly from the data, producing smoo

Adaptive Volume Delta Map---
📊 Adaptive Volume Delta Map (AVDM)
What is Adaptive Volume Delta Map (AVDM)?
The Adaptive Volume Delta Map (AVDM) is a smart, multi-timeframe indicator that visualizes buy and sell volume imbalances directly on the chart.
It adapts automatically to the best available data resolution

See all indicators and strategies
Community trends
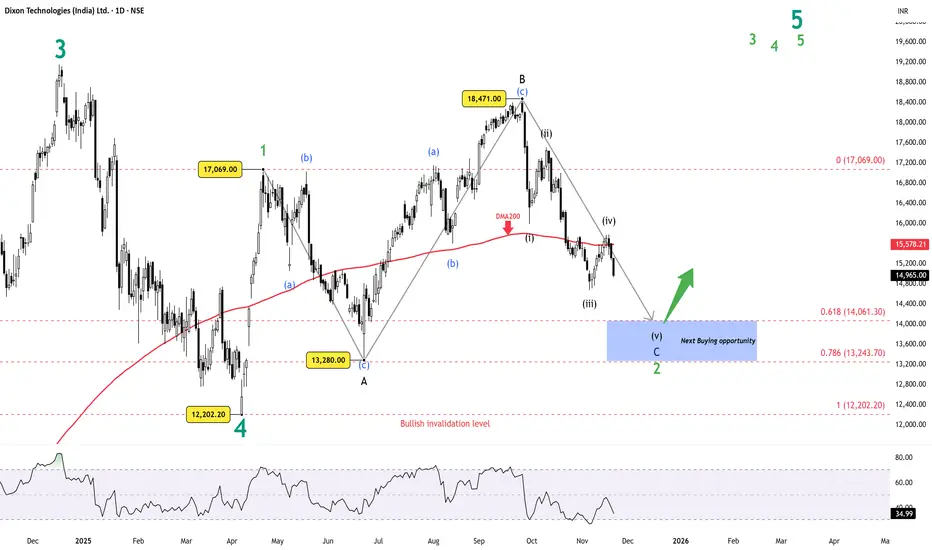
Dixon Technologies: Watching a Key Reversal Zone AheadDisclaimer:
This analysis is for educational purposes only and does not constitute investment advice. Please do your own research (DYOR) before making any trading decisions.
Dixon’s decline is developing as a running flat within Wave 2. Wave A and B are already in place, with Wave B stretching ab
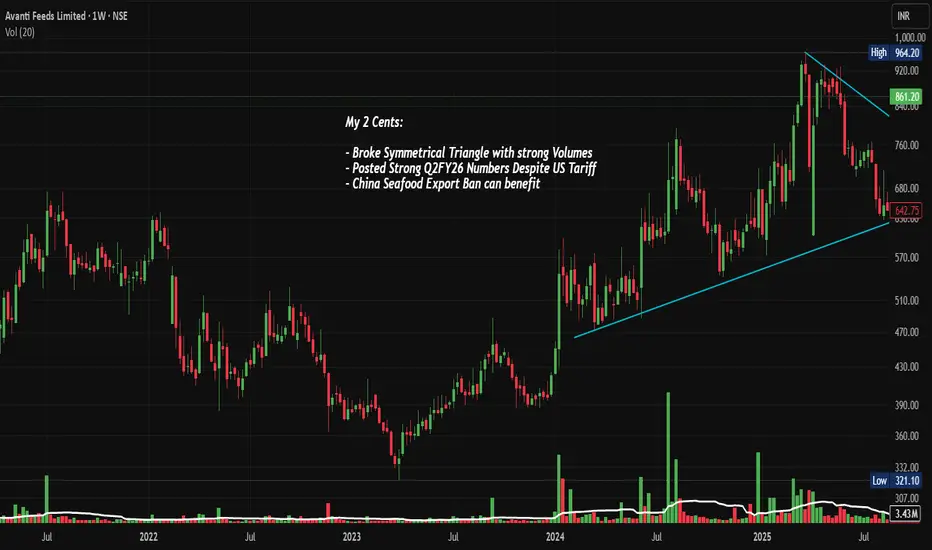
AVANTIFEED: Breaking out of Sym. Triangle, Chart of the WeekNSE:AVANTIFEED Breaking the Triangle: How Avanti Feeds is Positioned to Ride the Shrimp Export Wave Despite US Tariff Headwinds after Posting Strong Q2 FY26 Numbers. Lets Analyse in Chart of the Week.
As per the Latest SEBI Mandate, this isn't a Trading/Investment RECOMMENDATION nor for Education
HDFCLifeHDFCLife has a very long consolidation and going up and down in the range.
Previous wave has a downfall and not it is started with uptrend. So some uptrend it has small correction and ready to move up side.
So, above 770 we can see upside movement till the 800-820.
So, as per technical it's good
Consolidation face ends? Anuras has been in some decent consolidation for last 6 months and has seen strong volumes in last 2-3 session. Post results season buying is intriguing since not much happened post call. Watch out for some action. Please note RSI is 76 so take position according to your appetite.
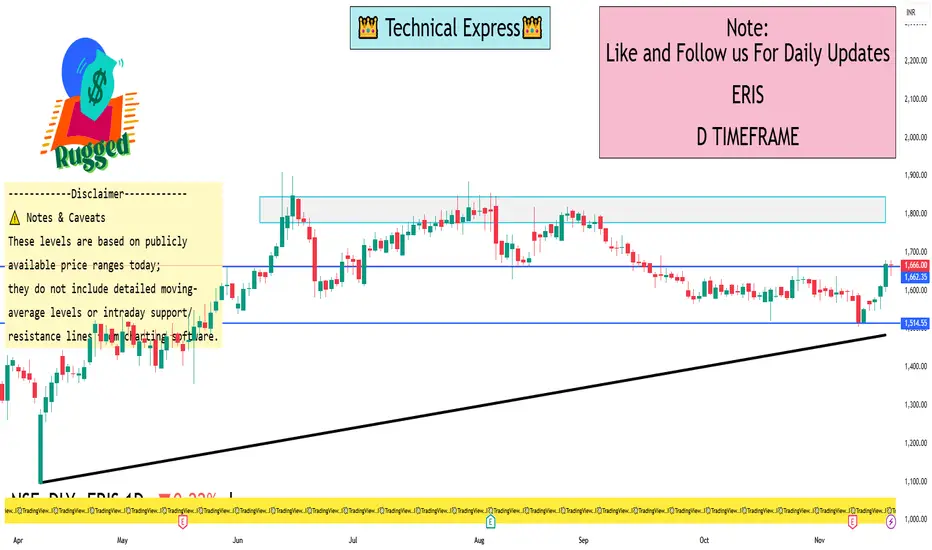
ERIS 1 Day View 📊 Current Price & Range
Last traded around ₹1,669 – ₹1,672
Today’s observed intraday range so far: Low ~ ₹1,651.6 and High ~ ₹1,679.2.
Previous close was ~ ₹1,669.60.
🔍 Key Technical Levels (1-Day)
Support levels to monitor:
1. ~ ₹1,650 mark – near today’s intraday low (~1,651).
2. A stronger b
M&M Fin (W): Bullish, Breakout with Short-Term Rejection(Timeframe: Weekly | Scale: Logarithmic)
The stock has confirmed a major multi-year breakout, moving into "Blue Sky" territory. However, the daily price action suggests a temporary pullback (re-test) is imminent before the uptrend resumes.
📈 1. The Breakout Structure (The "Big Picture")
- The

BUY TODAY SELL TOMORROW for 5%DON’T HAVE TIME TO MANAGE YOUR TRADES?
- Take BTST trades at 3:25 pm every day
- Try to exit by taking 4-7% profit of each trade
- SL can also be maintained as closing below the low of the breakout candle
Now, why do I prefer BTST over swing trades? The primary reason is that I have observed that

HAL – Trendline Rejection & Short SetupPrice has approached a major descending trendline and shown clear rejection near the supply zone. The structure is still respecting lower highs, indicating sellers are active at the top of the range.
I’ve taken a short position based on:
Retest of the descending trendline
Rejection from the previ

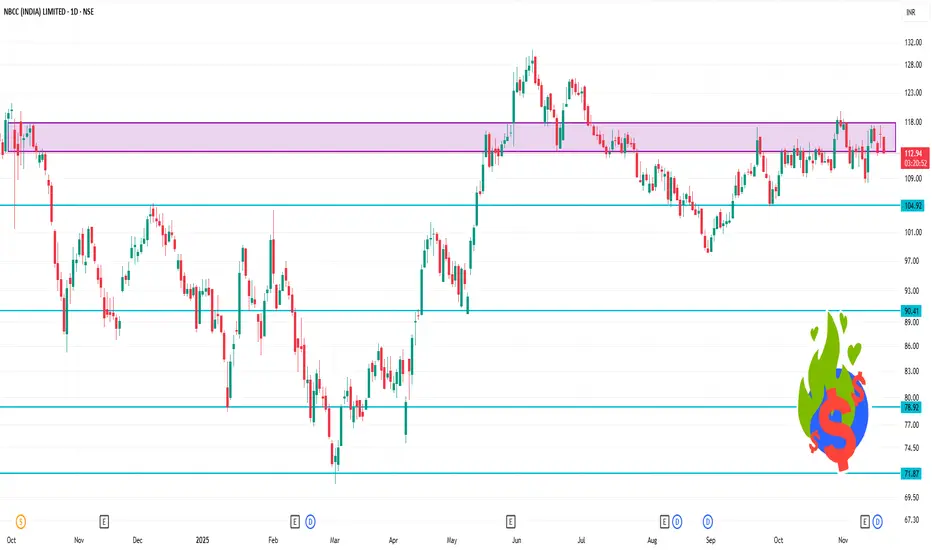
NBCC 1 Day Time Frame 📊 Key numbers
Current trading range (today): ~ ₹112.87 (low) to ₹115.50 (high) on the NSE.
Previous close: ~ ₹115.99.
52-week range: ~ ₹70.80 (low) to ~ ₹130.70 (high).
Valuation / fundamentals: P/E ~50.9x, P/B ~11.72x.
⚠️ Important disclaimers
These levels are based on publicly available intr
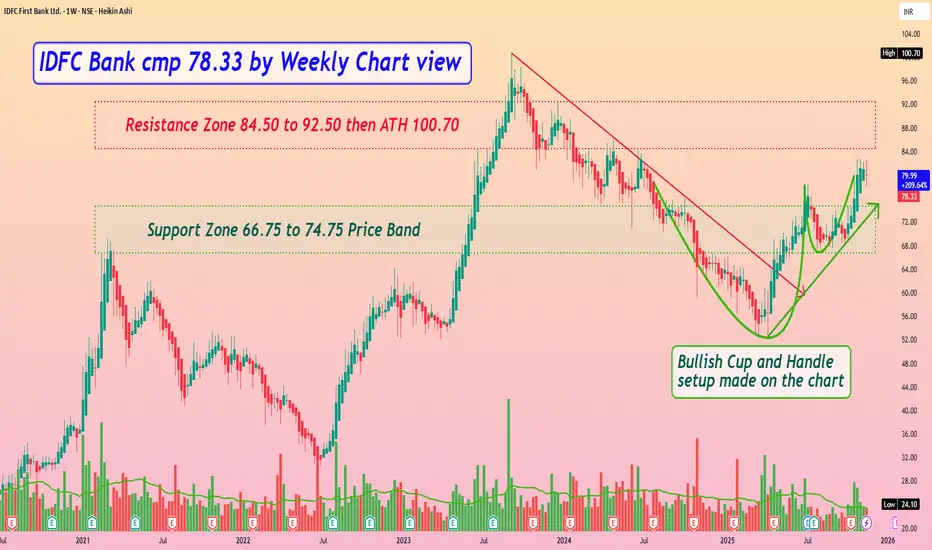
IDFC Bank cmp 78.33 by Weekly Chart viewIDFC Bank cmp 78.33 by Weekly Chart view
- Support Zone 66.75 to 74.75 Price Band
- Resistance Zone 84.50 to 92.50 then ATH 100.70
- Bullish Cup and Handle setup made on the stock chart
- Volumes are in good sync with the average traded quantity
- Rising Support Trendline well sustained and trendi
See all stocks ideas
Nov 24
AGSTRAAGS Transact Technologies Ltd.
Actual
—
Estimate
—
Nov 24
SPICEJETSpiceJet Limited
Actual
—
Estimate
−4.50
INR
Dec 3
FLFLFuture Lifestyle Fashions Ltd.
Actual
—
Estimate
—
Dec 3
ENRINSiemens Energy India Limited
Actual
—
Estimate
8.43
INR
Dec 3
KRNKrn Heat Exchanger and Refrigeration Limited
Actual
—
Estimate
2.90
INR
See more events
Community trends
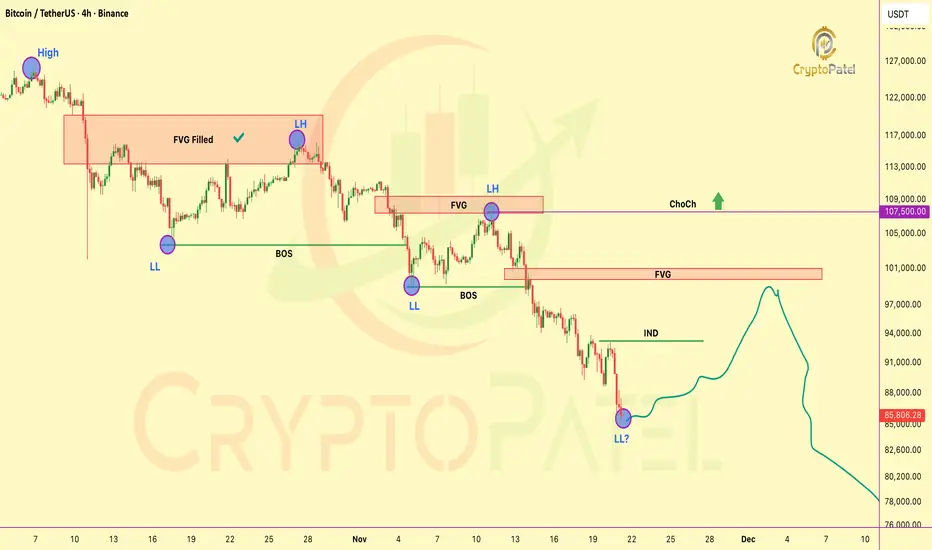
$BTC Just Printed Another LL: Next Draw Is Locked InCRYPTOCAP:BTC Just Printed Another LL: Next Draw Is Locked In
Market is maintaining a clear bearish orderflow with continuous LH → LL sequence.
Structural Notes
🔹 Previous major FVG (distribution zone) has been fully filled and delivered downside.
🔹 Multiple BOS events confirm continuation of t
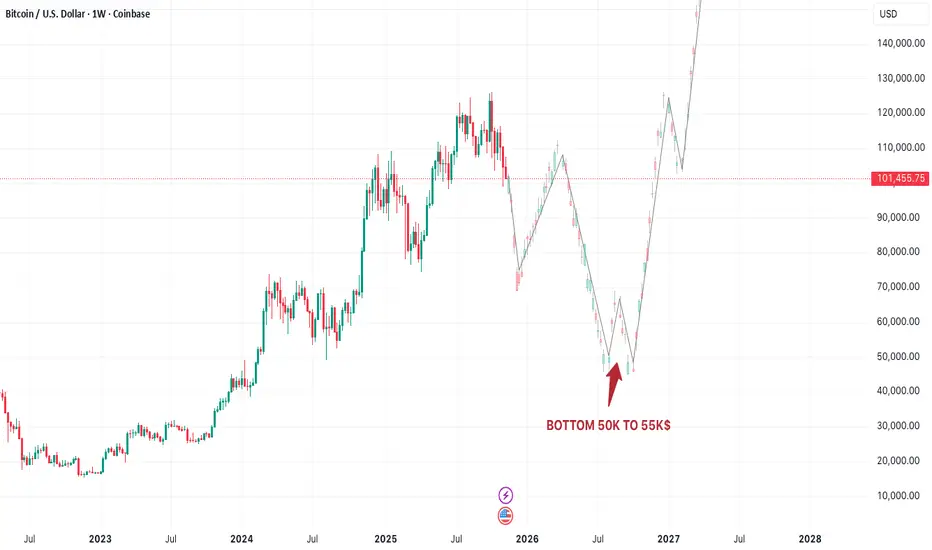
Bitcoin’Smart Money Setup: $80K Drop Before $108K Rebound!Bitcoin is currently trading near $102,000 after showing multiple signs of exhaustion at the top.
I expect BTC to drop toward the $80,000 zone — this will likely act as a liquidity grab or a correction phase.
From there, a short-term bounce toward $108,000 could trap late buyers before the major mac
BTCUSD – Updated Technical AnalysisPrice broke $81,795 (0.236 Fib) with strong bearish candles.
This confirms continuation of the downtrend, not a temporary dip.
RSI continuously making lower highs
RSI is now near oversold zone but not yet reversed
Strong Support 1: $78,000 – $76,500
Strong Support 2: $72,000 – $70,000
Harmonic /

Bitcoin is in a clean daily downtrend right nowBitcoin is in a clean daily downtrend right now – every bounce is just providing fuel for the next leg until the structure says otherwise.
Good evening traders, Brian here with a higher-timeframe look at BTCUSD.
Fundamental analysis
Bitcoin has been under sustained pressure even as some funds con

BTC strong down trend and high RnR sell scenario..BTC is in strong down trend and broke ~ 90K level and targeting further downside levels of 82K and 75K. Price is continuously forming lower highs and BoS. Price has formed a BOS on hourly chart and approaching 1h FVG. We may expect a rejection pattern in LTF inside FVG and further downfall.
1. Pri


BNB/USDT – Bullish Reversal Idea | Demand Zone Reaction📌 Overview
BNB is currently trading at a major higher-timeframe demand zone, showing early signs of accumulation after a sharp sell-off. Price has tapped the demand area multiple times and is holding without breaking structure to the downside.
This setup is based on a potential short-term reversal
Be alert ? BTC behave different scenerioAfter halving BTC has approached maximum of 518 days last 2 bull run out of 3. This time scenarios showing different theory. so don's belief bilndly. BTC future are above $1M as predicted but if we are going to Bear Market then atleat 1.5 year should be long days.
So be alert

SOL DUMP TO THE $40YES, YOU SEEN RIGHT
CRYPTO:SOLUSD
SOL ready with multiple negative patterns.
1. all time resistance
2. triple top
3. cup and handle failure
First pattern is already activated and triple top near to active.
Reverse scenario
take support from major strong support. cup and handle breakout
🧠 Alwa


See all crypto ideas
Gold XAUUSD – Fresh Resistance Tested Twice, Bears Eye 4057 PullGold gave us a clean reaction today, rejecting the 4107–4110 supply zone not once, but twice. That double tap reinforced a fresh resistance band at 4087–4095, where sellers stepped back in with intention.
As long as 4012 holds on the upside, this resistance zone remains my short-term line in the sa


LiamTrading – XAUUSD H1 | Gold breaks bullish structure...LiamTrading – XAUUSD H1 | Gold breaks bullish structure, short-term downside takes control
Gold has dropped sharply by more than $20 in a short time, losing over 1% on the day and moving close to the lower 4,030 area. The previous bullish structure has officially been broken, 4040 failed to hold, a

#XAUUSDPlease stick to your strategies
Any resistance will lead to big losses
Never take revenge on the market if a loss is triggered
Close the trade if the channel ceiling is broken

Elliott Wave Analysis XAUUSD – 21/11/2025
1. Momentum
D1:
The D1 momentum is contracting, signaling a potential reversal. If today’s candle confirms this, it will further support the continuation of wave Y.
H4:
H4 momentum has turned downward, so the expectation for today remains bearish movement.
H1:
H1 momentum is preparing to turn upwar

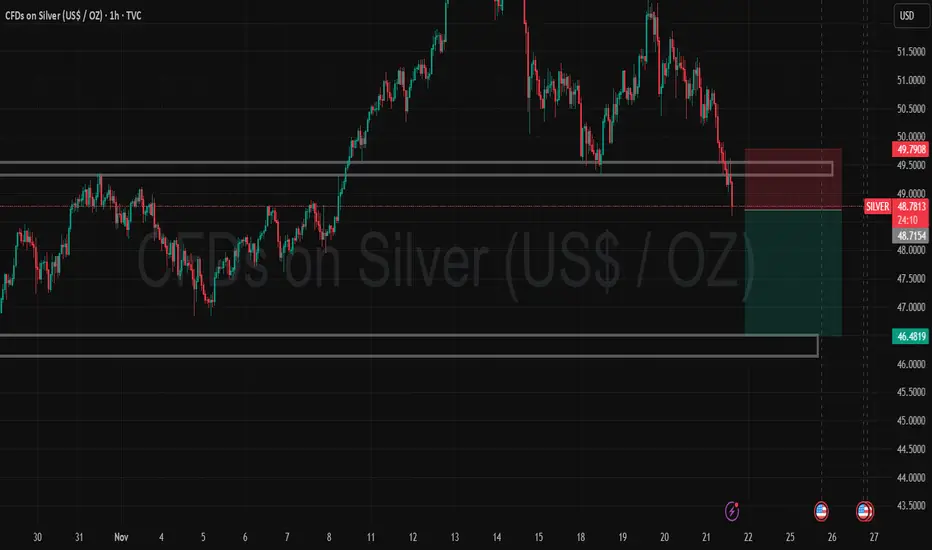
Silver Look Good for short with 1:2 target Trend: Bearish. The market has shifted from an uptrend to a downtrend.
Pattern: Break and Retest. Price broke below the 49.50 support level, retested it as resistance, and is now rejecting it.
The Trade: A Short (Sell) setup is active.
Target (TP): 46.48 (Lower support zone).
Stop Loss (SL): 49.
Gold mcx AI Tool report showing upmove, holding buy @121600 Parameters Data
Asset Name : Price 🟩 Gold MCX (Feb '26) : 1,24,101
Price Movement 🟩 Upmove will continue to 1,24,500, 1,25,500 if break 1,25,500 then breakout Until 1,22,000 not break if break then 1,21,800, 1,19,250 possible.
Reason 🟩 Technical Reversal & Analyst View: Strong buying interest ne

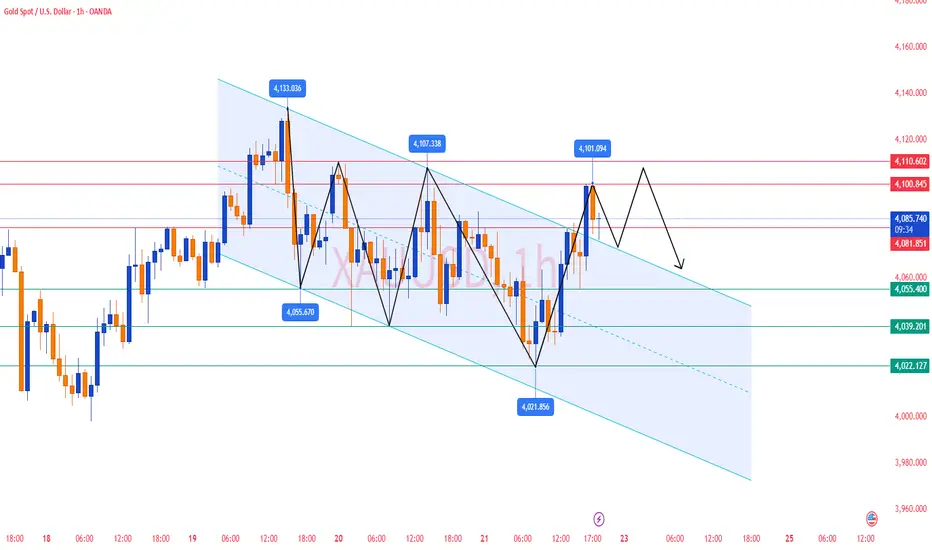
Gold Analysis and Trading Strategy | November 21-22✅From the 4-hour timeframe, gold rebounded strongly to 4101 (previous high + Bollinger upper band + MA20 resistance) and then quickly fell back to the 4080 area, indicating that selling pressure at higher levels remains very strong.
1️⃣ Moving averages remain bearish
MA5 and MA10 have turned upward
XAU/USD Near Breakdown – Bears Eying Liquidity SweepGold remains under pressure after a stronger-than-expected NFP print reduced near-term Fed rate-cut expectations.
The USD stays moderately supported, while weak risk sentiment keeps gold in a cautious, defensive phase.
📊 Technical Snapshot (H1–M30)
Price continues to reject the descending trendlin

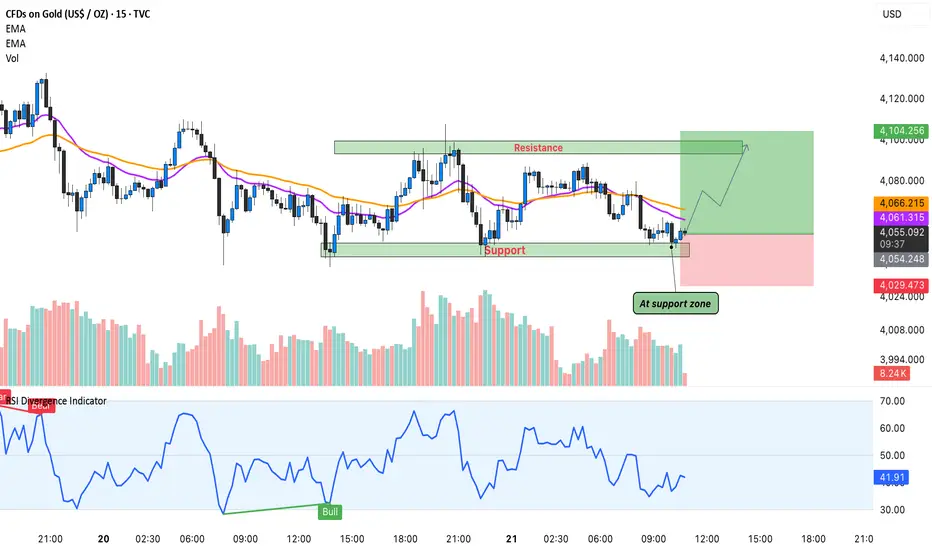
Gold’s Intraday Reversal – Buyers Stepping In!Hello Guy's Let's analyse Gold and it is once again respected the intraday support zone highlighted on the chart. This level has acted as a strong demand area multiple times, and today price reacted from the same zone with clear bullish intent.
Price is also sitting above EMA 20 & EMA 50, and the R
See all futures ideas
USD JPY will hit 172$LETS SEE WHAT HAPPENS THERE IS ALREADY TECHNICAL pattern breakout and target achievement is a bit tricky

Flag Found in NZDUSDI was eyeing on NZDUSD for Bullish entry above its major support @ 0.5613.
Then I caught a flag pattern which indicates continuation towards 0.5515. This is also confirmed by its near major support at 0.5514.
The price retraced two times from 0.5514 on 9th April 2025 and 3rd Februrary 2025. It ena

In about an hour, UK Retail Sales data will be releasedIn about an hour, UK Retail Sales data will be released.
We’ve analyzed every report since 2022 to build this insight-packed dashboard showing how GBPUSD typically reacts within 4 hours after the print:
📊 Historical Breakdown (32 events total):
🔹 Bullish trend: 46.9% → 15 events
🔸 Bearish trend: 5


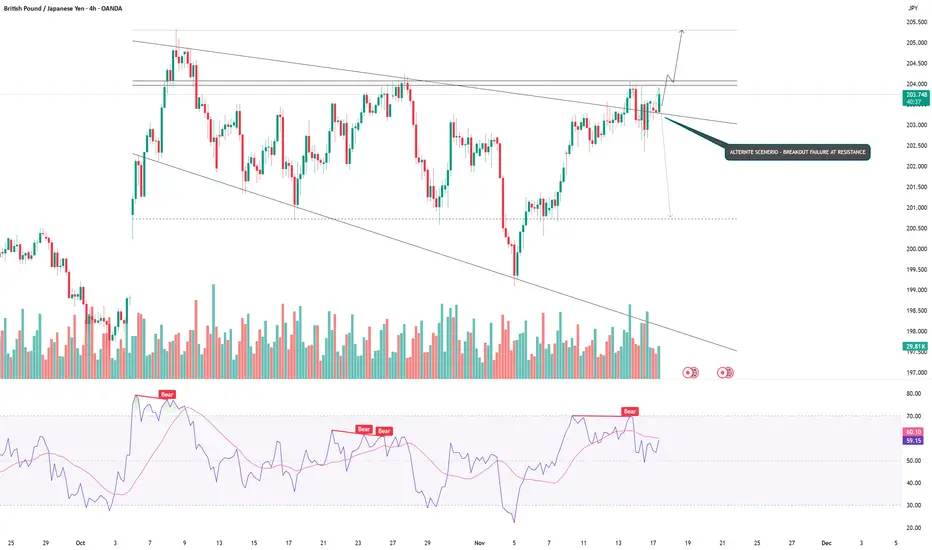
GBPJPY - BULLISH CONTINUATION OR REVERSAL?Symbol - GBPJPY
GBPJPY has broken the structure of the local downtrend amid persistent weakness in the Japanese yen. This shift opens the possibility for a continuation of the broader bullish trend.
The yen continues to depreciate, while the British pound maintains its upward trajectory. A breakou
LONG EURUSDas i am looking for short covering, i am expecting to bounce from this levels
ENTRY - 1.14945
SL- 1.14845
TP- 1.15400

EURUSDEURUSD, I expect to come down further. This provides a strong risk–reward ratio since the downtrend is intact on 15 min, and market momentum supports continuation toward lower support levels.

EURUSD Trade idea 20/11/2025Namaste everyone 🙏
Eurusd is in a trappy orderflow rightnow, we are in a bullish poi currently that is a daily FVG, and we have a bearish H4 fvg.
This is my plan -
1.Dxy has clear buy side liquidity to take out, so if dxy taps into its FVG on H4 time frame before taking out the buy side liquidity

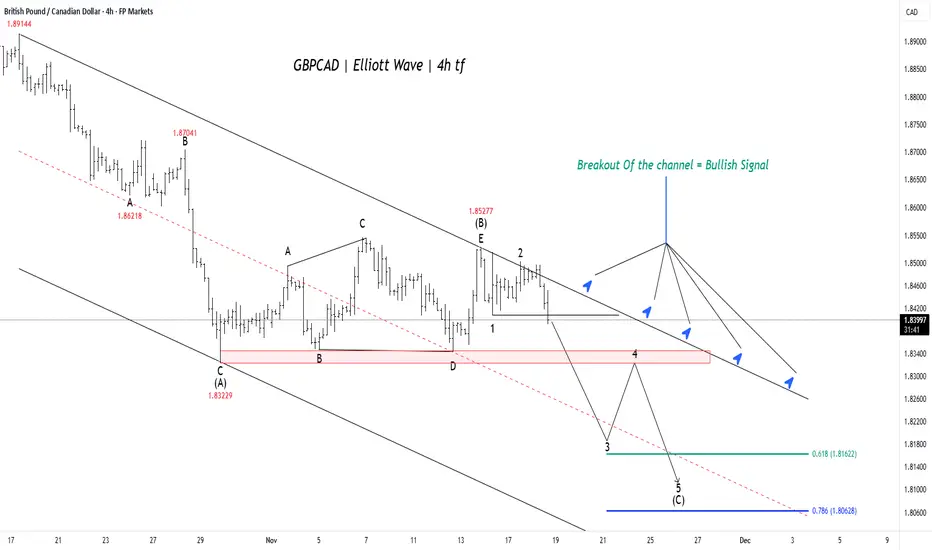
GBPCAD: Final Drop to Key Support Before Major ReversalThe wave Principle strongly suggests the currency pair is currently in the final stages of a large decline, which is expected to precede a major, sustained upward move.
Completion of Correction: The pair has recently completed a complex, sideways corrective pattern (such as a triangle or flat),
See all forex ideas
| - | - | - | - | - | - | - | - | ||
| - | - | - | - | - | - | - | - | ||
| - | - | - | - | - | - | - | - | ||
| - | - | - | - | - | - | - | - | ||
| - | - | - | - | - | - | - | - | ||
| - | - | - | - | - | - | - | - | ||
| - | - | - | - | - | - | - | - | ||
| - | - | - | - | - | - | - | - | ||
| - | - | - | - | - | - | - | - |
Trade directly on the supercharts through our supported, fully-verified and user-reviewed brokers.


