BUY TODAY SELL TOMORROW for 5%DON’T HAVE TIME TO MANAGE YOUR TRADES?
- Take BTST trades at 3:25 pm every day
- Try to exit by taking 4-7% profit of each trade
- SL can also be maintained as closing below the low of the breakout candle
Now, why do I prefer BTST over swing trades? The primary reason is that I have observed that

The best trades require research, then commitment.
Get started for free$0 forever, no credit card needed

Scott "Kidd" PoteetThe unlikely astronaut

Where the world does markets
Join 100 million traders and investors taking the future into their own hands.

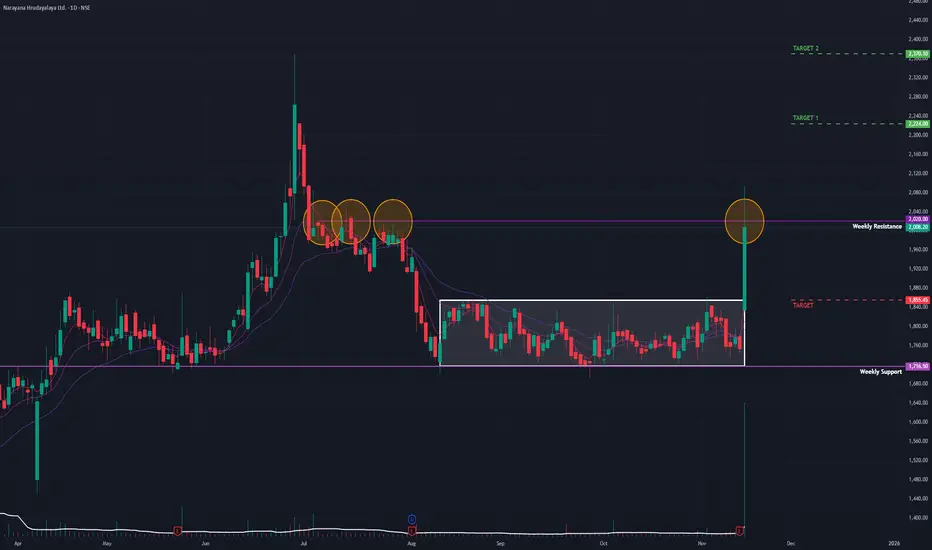
Narayana Hrudayalaya (D): Earnings-Driven BreakoutThe stock has decisively broken out of a 3-month consolidation phase. This technical breakout is powered by a strong fundamental catalyst (Q2 earnings), validating the surge and the high volume.
🚀 1. The Fundamental Catalyst (The "Why")
The breakout is a direct reaction to the company's Q2 FY26
Money moves the market - Bank NiftyTraders say price moves the market. Bulls or bears move the market etc... But the fact is, money moves the market. You cannot ignore Bank Nifty when analyzing Nifty. When bank sector is supporting, Nifty gives a trending move.
Public sector bank stocks are on the move, while private sector bank stoc

L&T Multiyear BreakoutLarsen & Toubro Limited - Multi-Timeframe Breakout Analysis
Current Price:4,004.40
CRITICAL SETUP ALERT
L&T is at a pivotal moment with breakouts confirmed on weekly and monthly timeframes. The stock is now in a crucial period that will determine the validity of this range breakout.
KEY TECHNICAL

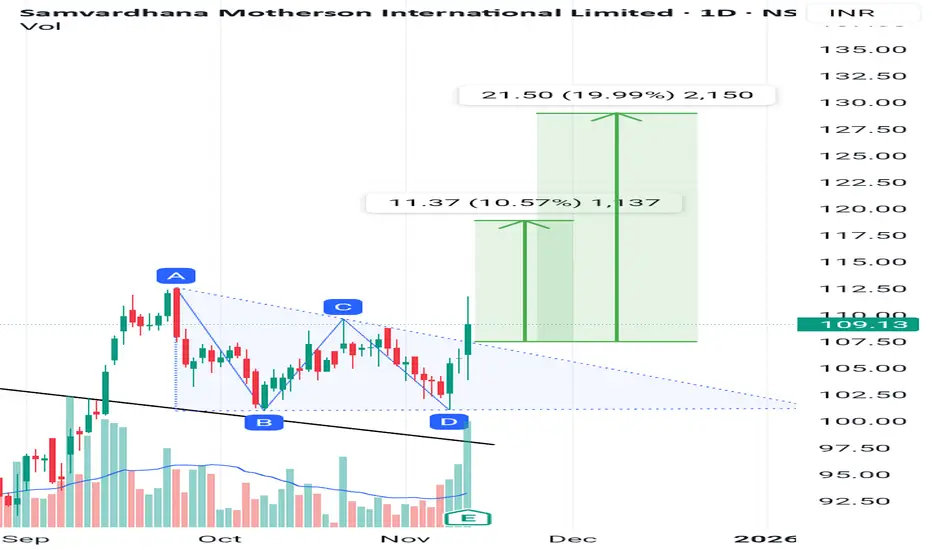
Samvardhana Motherson just made a triangle breakout.will it sustJust broke out of triangle pattern with good volume spike. Volumes are 3 times the average.
It brokeout of treandline on 12 September and gave a move of 10% before entring into consolidation of triangle pattern.
It just broke out of the pattern giving bullish signal.
Indicators
RSI is >60 which is
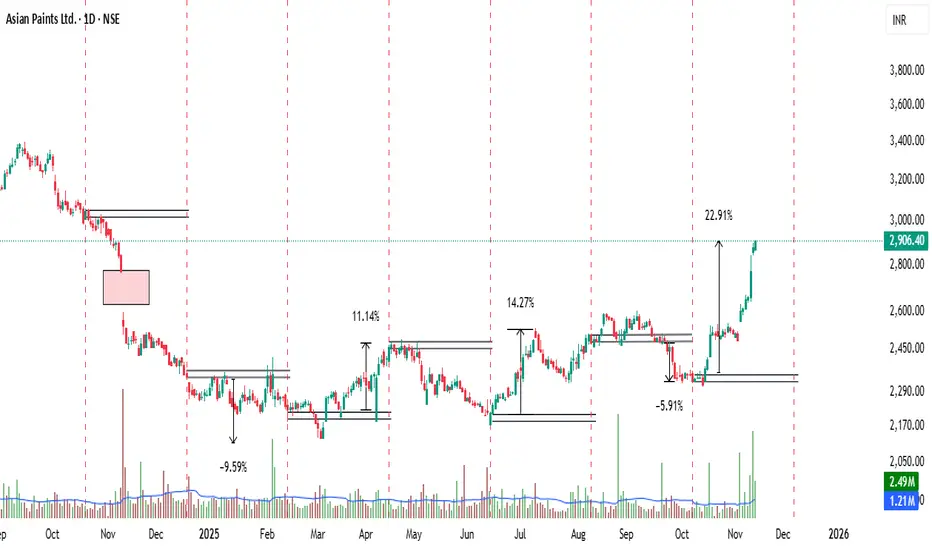
Asian Paints Turns Colorful Again!Hello Mates! Here’s a chart that really caught my attention this week Asian Paints showing strength after a long phase of quiet sideways movement. The structure is clean, the breakout is sharp, and the message from price action is clear momentum is shifting again.
After spending almost two years in

BANK NIFTY - Technical Analysis Bank Nifty is showing an interesting setup on the weekly chart.
After breaking out above its previous all-time high, the index has started contracting in a tight range, indicating healthy consolidation.
On the daily timeframe, it continues to take support near the 9 EMA, and during minor dips, it

DALMIA BHARATHello & welcome to this analysis
Technical Outlook:
In the monthly time frame its completing the formation of a Cup & Handle breakout suggesting upside levels for medium term 2800 - 3500, for long term 3800 - 5000
Accumulation can be done in the range of 1900 (on downside) 2300 (on the upside).
T

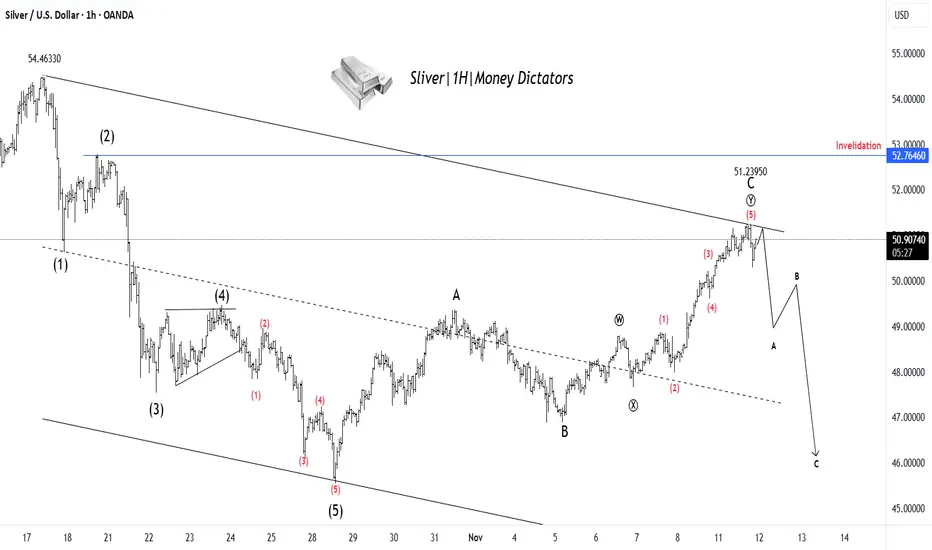
XAG/USD Set for Decline After Finishing Wave YSilver has completed a clear 5-wave upward move, ending near the 51.23 zone, which likely marks the completion of Wave C of the corrective structure. Price action shows rejection from the upper trendline, signaling that buying momentum is fading. This suggests the start of a new A–B–C corrective dec
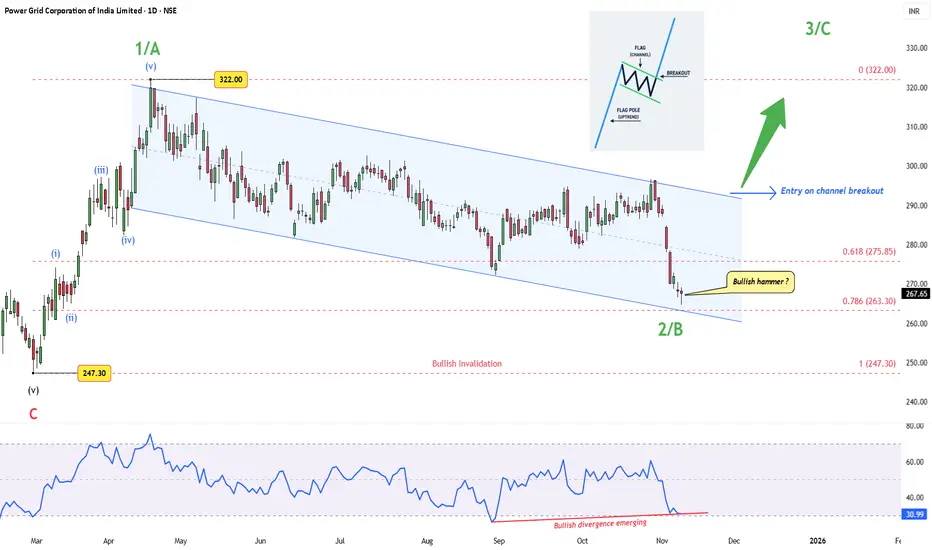
Power Grid – A Flag Within a WaveAfter completing a clean five-wave rally from ₹247.30 to ₹322, Power Grid has spent months in a controlled drift lower — a textbook corrective channel, likely forming Wave 2/B of the next major leg.
Price now sits near the 0.786 retracement (₹263 zone), showing early signs of exhaustion. A “ Bullis
See all editors' picks ideas
PriceFormatLibrary for automatically converting price values to formatted strings
matching the same format that TradingView uses to display open/high/low/close prices on the chart.
█ OVERVIEW
This library is intended for Pine Coders who are authors of scripts that display numbers onto a user's charts. T

LogNormalLibrary "LogNormal"
A collection of functions used to model skewed distributions as log-normal.
Prices are commonly modeled using log-normal distributions (ie. Black-Scholes) because they exhibit multiplicative changes with long tails; skewed exponential growth and high variance. This approach i

Range Oscillator (Zeiierman)█ Overview
Range Oscillator (Zeiierman) is a dynamic market oscillator designed to visualize how far the price is trading relative to its equilibrium range. Instead of relying on traditional overbought/oversold thresholds, it uses adaptive range detection and heatmap coloring to reveal where pri

Volume Surprise [LuxAlgo]The Volume Surprise tool displays the trading volume alongside the expected volume at that time, allowing users to spot unexpected trading activity on the chart easily.
The tool includes an extrapolation of the estimated volume for future periods, allowing forecasting future trading activity.
🔶 U

Smooth Theil-SenI wanted to build a Theil-Sen estimator that could run on more than one bar and produce smoother output than the standard implementation. Theil-Sen regression is a non-parametric method that calculates the median slope between all pairs of points in your dataset, which makes it extremely robust to o

Fair Value Gaps by DGTFair Value Gaps
A refined, multi-timeframe Fair Value Gap (FVG) detection tool that brings institutional imbalance zones to life directly on your chart.
Designed for precision, it visualizes how price delivers into inefficiencies across chart, higher, and lower (intrabar) timeframes — offering a fl

TASC 2025.11 The Points and Line Chart█ OVERVIEW
This script implements the Points and Line Chart described by Mohamed Ashraf Mahfouz and Mohamed Meregy in the November 2025 edition of the TASC Traders' Tips , "Efficient Display of Irregular Time Series”. This novel chart type interprets regular time series chart data to create an ir

Simplified Percentile ClusteringSimplified Percentile Clustering (SPC) is a clustering system for trend regime analysis.
Instead of relying on heavy iterative algorithms such as k-means, SPC takes a deterministic approach: it uses percentiles and running averages to form cluster centers directly from the data, producing smoo

Adaptive Volume Delta Map---
📊 Adaptive Volume Delta Map (AVDM)
What is Adaptive Volume Delta Map (AVDM)?
The Adaptive Volume Delta Map (AVDM) is a smart, multi-timeframe indicator that visualizes buy and sell volume imbalances directly on the chart.
It adapts automatically to the best available data resolution

Dynamic Equity Allocation Model"Cash is Trash"? Not Always. Here's Why Science Beats Guesswork.
Every retail trader knows the frustration: you draw support and resistance lines, you spot patterns, you follow market gurus on social media—and still, when the next bear market hits, your portfolio bleeds red. Meanwhile, institution

See all indicators and strategies
Community trends
Asian Paints Ltd.(ASIANPAINTTime Cycle is a routine that allows you to map the movement of a stock by measuring the high and low levels of the stock on a day or period. However, it does not prove whether a reversal will occur in the next time cycle; it is only a probability. But it makes you profitable 80% of the time.
Regard
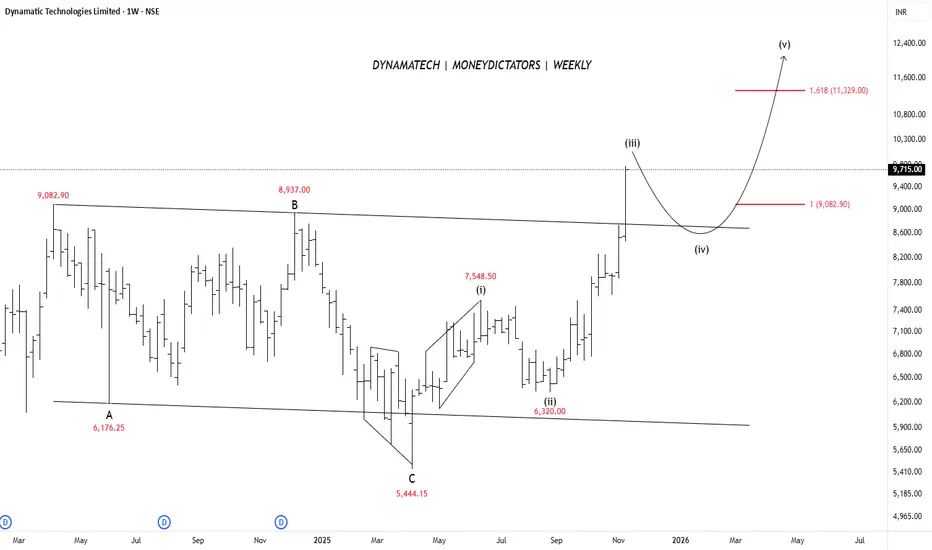
Dynamatech Has Given a Clean Wave Map to the ₹11,300 ZoneDynamatic Technologies has already completed its big A-B-C correction, meaning the downtrend is over. After this, the stock started a fresh upward Elliott Wave cycle, and waves (i), (ii), and (iii) are already complete. This confirms that the stock has entered a new bullish phase.
Right now, the pr
L&T Multiyear BreakoutLarsen & Toubro Limited - Multi-Timeframe Breakout Analysis
Current Price:4,004.40
CRITICAL SETUP ALERT
L&T is at a pivotal moment with breakouts confirmed on weekly and monthly timeframes. The stock is now in a crucial period that will determine the validity of this range breakout.
KEY TECHNICAL
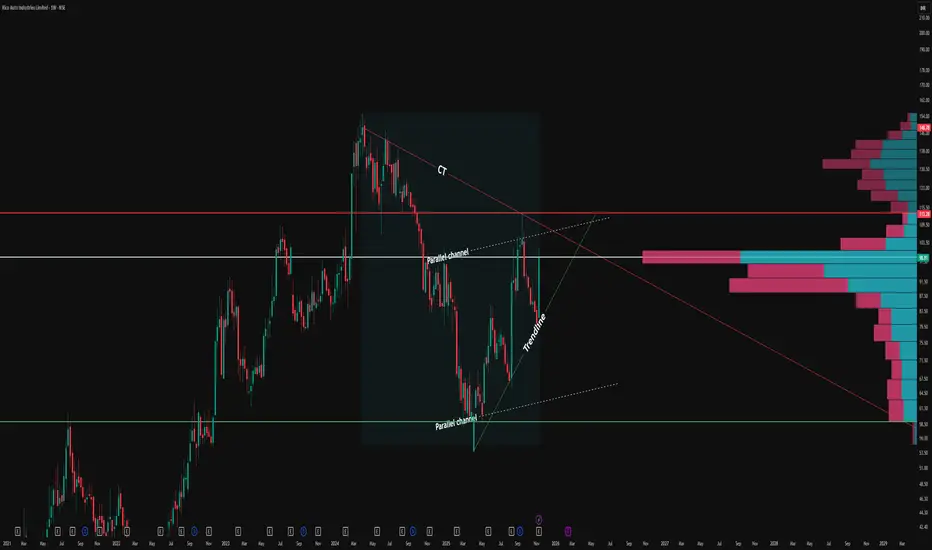
How Counter Trendlines and Parallel Channels Reveal Price StructThe CT (Counter Trendline) as the prime technical feature. The red CT line distinctly marks recurring lower high rejections, shaping significant supply pockets and creating low-liquidity price zones at every inflection point.
Each touch validates the CT’s relevance, highlighting how price is repea
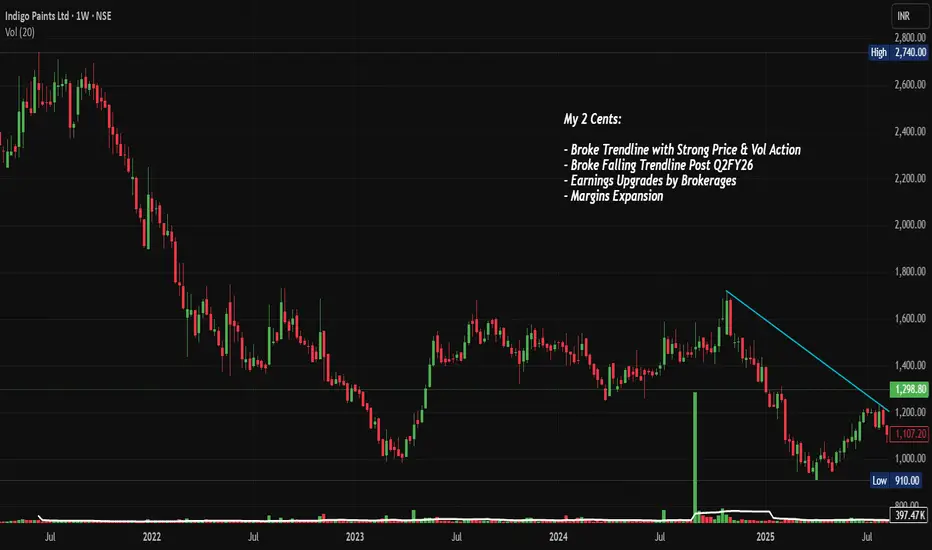
INDIGOPNTS: Trendline Breakout Post Q2FY26, Chart of the WeekWhy NSE:INDIGOPNTS Could Be Your Next Multi-Bagger: Breaking Out After a Brutal 60% Correction Post Good Q2 FY26 Numbers: Let's Analyze in Chart of The Week
As per the Latest SEBI Mandate, this isn't a Trading/Investment RECOMMENDATION nor for Educational Purposes; it is just for Informational p
KOTAKBANK -Long - 2 Hour chartKotak Bank Analysis (2H Chart)
Trend: Price is still in an overall uptrend and has taken support exactly on the rising trendline. The recent fall looks like a normal pullback inside a falling wedge.
Volumes: Volumes were low during the fall, which shows sellers were weak. The latest green candle h

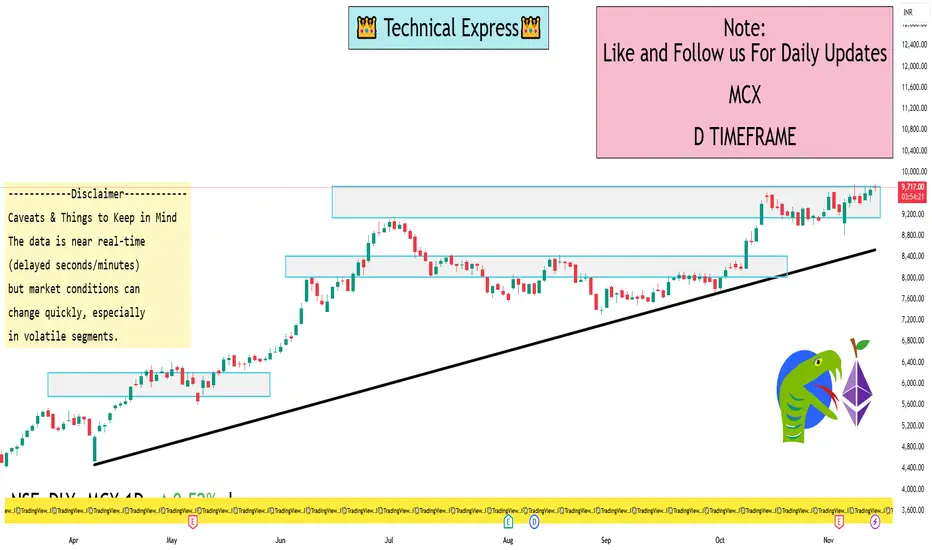
MCX 1 Day View Last traded price: ₹9,738.50 on 17 Nov 2025 (approx)
Previous day close: ~ ₹9,666.50
Day high so far: ~ ₹9,786.00
Day low so far: ~ ₹9,640.00
52-week high: ~ ₹9,786.00, 52-week low: ~ ₹4,408.15
One-Day Time-Frame Level Observations
The price is very near its recent all-time/52-week high (
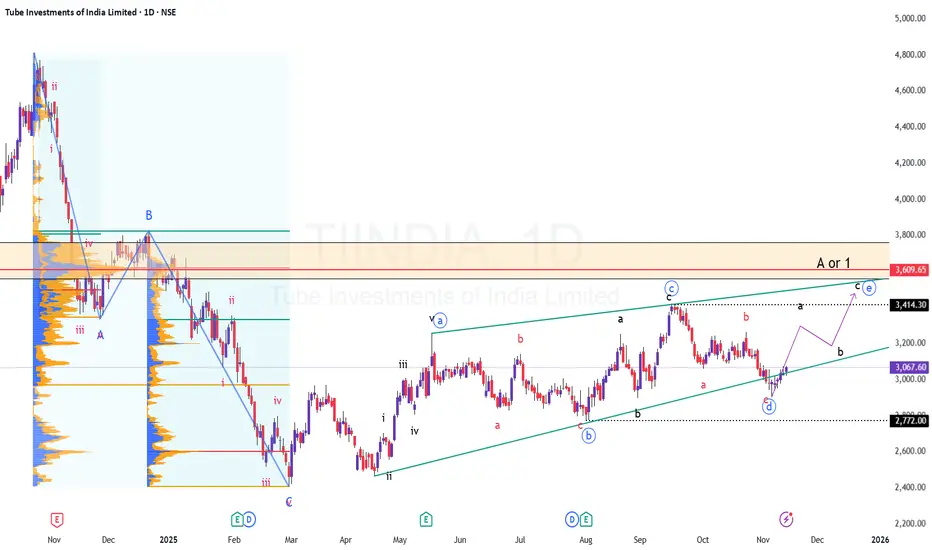
Leading Diagonal Formation in TIINDIACMP: 3067
TF: Daily
The current structure exhibits a leading diagonal from the lows and it could be Wave 1 of a new impulse or wave A of a corrective rise.
In either case, we are looking at one more high past the recent swing high at 3414.
Although we are looking at a 10% move on the upside, this
MARICO : Near Darvas Box BreakoutMarico is near life time high and consolidation is going on weekly timeframe. chart is showing a good and healthy consolidation.. Nifty is also near ATH and about to Break so as MARICO . Lets see how it perform.
All data is available in public domain..
CMP : 740
TSL : Below 9 Daily EMA
SL

TRENT : Right Time to Catch Wave?
### 🧠 Chart Context & Wave Overview
The chart of TRENT LTD (Daily Timeframe) displays a strong Elliott Wave corrective setup , where price action seems to have completed an extended retracement (113%–127%) of the previous swing low .
This zone often marks the final leg of a correction and

See all stocks ideas
Community trends
Warning: $ETH Is About to Hit Its Most Critical Zone of 2025!Warning: CRYPTOCAP:ETH Is About to Hit Its Most Critical Zone of 2025!
Macro Structure
ETH remains macro bullish, currently in a healthy correction after rejecting the premium zone near $4,960.
The strong displacement from $1,577 (0.618 Fib) confirmed bullish structure, but price is now retracing

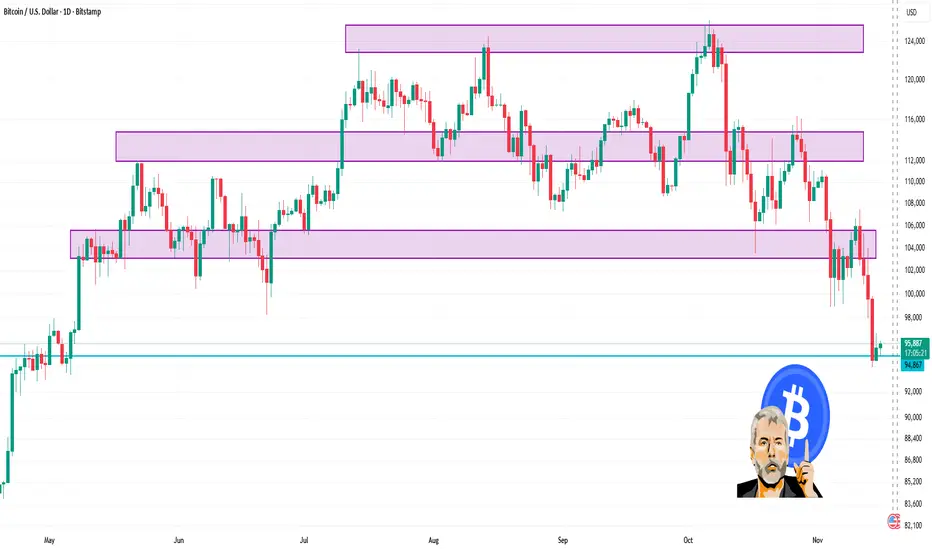
BTC 1 Day Time Frame 🔍 Price snapshot:
1. It’s trading in the vicinity of ~US$95,900 (as per latest data) per coin.
2. Daily range (roughly) sits between ~US$94,800 and ~US$96,400 (depending on source).
3. Technical summary on the daily timeframe is leaning toward a “Strong Sell / Sell” bias per one analytics page.
BTC at strong support levelBTC seems to have completed wave E of an expanding triangle.
-- EXPANDING TRIANGLE--
Wave E is generally equal to (101-161.8)% of Wave C.
In rare cases it could also be equal to 261.8% of Wave A or Wave C
---------------------------------
Wave E is already equal to twice of wave C and if it sust


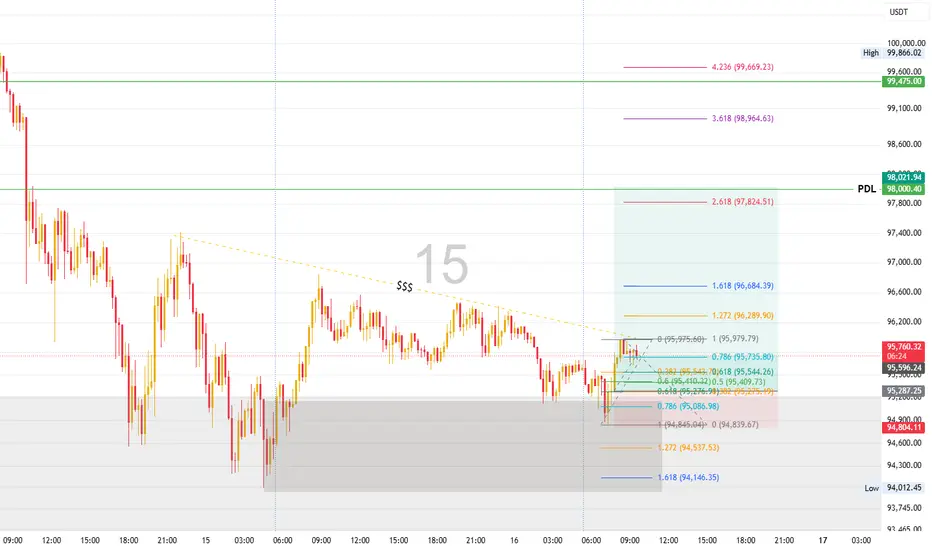
BTCUSD Retest Play: Buying the Dip Toward PDLYesterday BTC failed to tap the Previous Day’s Low (PDL), leaving an untouched liquidity pool below.
Today, price has already formed a liquidity buy zone at 95,665.95, which sits in a premium area.
I’m expecting BTC to potentially test the PDL, so I’m planning to buy on the dip.
📌 Entry: 95,279.63

Technical Analysis of BTCUSD – Is a Correction Approaching?BINANCE:BTCUSD is currently moving within a clearly defined falling wedge pattern, with price now pressing against the lower boundary of the structure. This level may act as dynamic support, and if price shows a strong rejection, a corrective move toward the resistance zone near 102,000 could occu


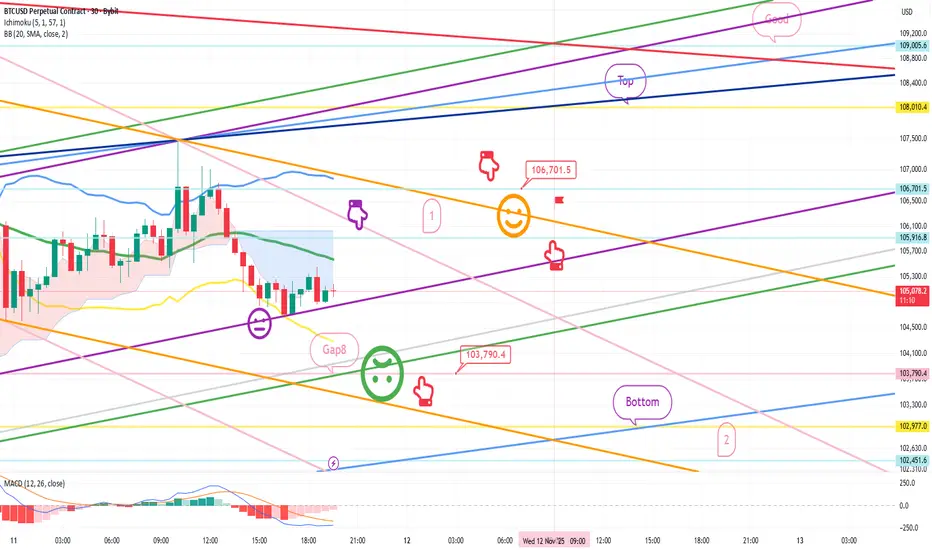
Bitcoin Bybit chart analysis November 11Hello
It's a Bitcoin Guide.
If you "follow"
You can receive real-time movement paths and comment notifications on major sections.
If my analysis was helpful,
Please click the booster button at the bottom.
This is a Bitcoin 30-minute chart.
There are no separate Nasdaq indicators.
I developed a
See all crypto ideas
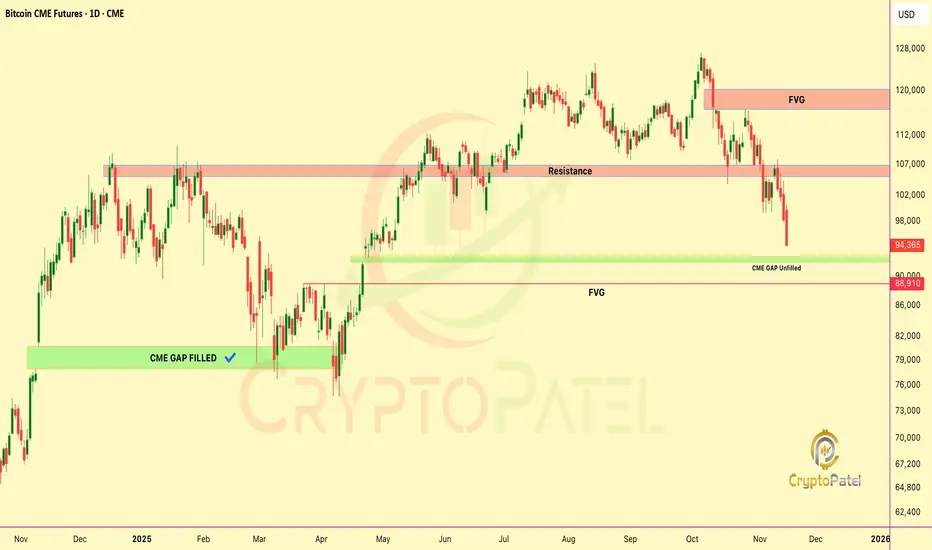
Bitcoin Next move $70k or $120k?CRYPTOCAP:BTC Is About to Bounce From the Level Everyone Is Ignoring
CME Gap 👉 $91,170
FVG below 👉 $89,020
Both zones = liquidity magnets.
No upside CME gaps left… only 1 upside FVG at $120,370
My view:
Fill → Sweep → Strong bounce expected from $89K–$91K range.
Next major draw = $120K FVG.
NF
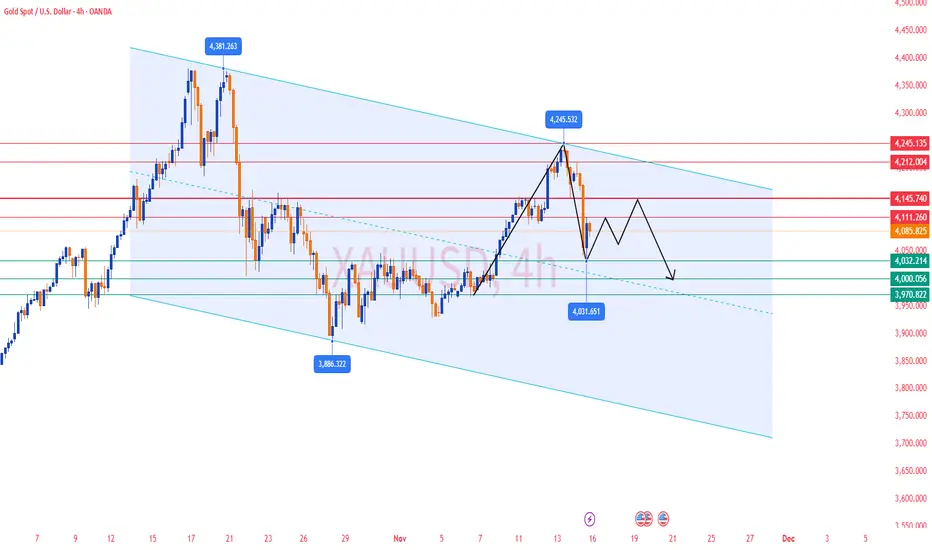
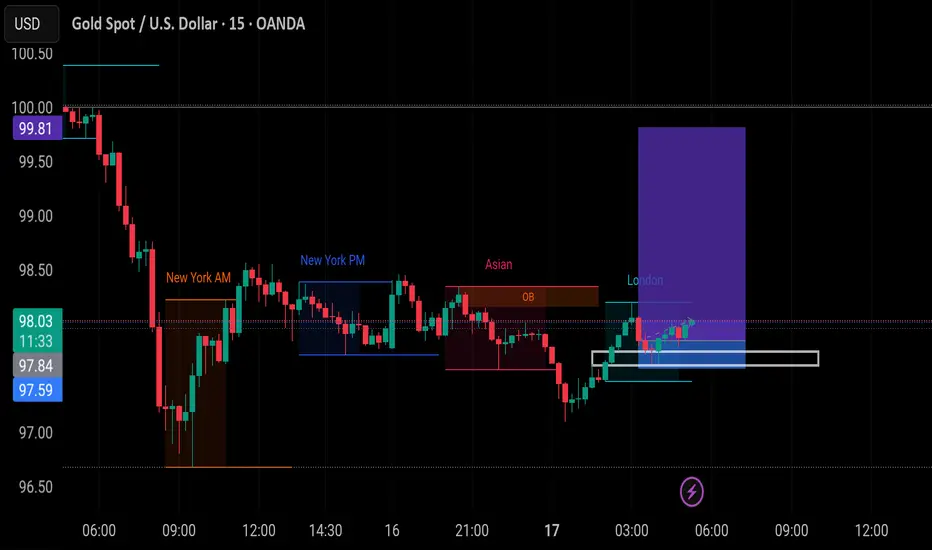
Gold/XAUSSD weekly analysis and possible sell/buy scenarios....Currently gold is showing pressure and generating sell signals. There are multiple sell opportunities developed in Gold in different time frames. And we can anticipate couple of opportunities out of these will trigger. Gold has already created CISD on HTF and tested daily FVG and changed delivery an

Gold Trading Strategy for Next Week✅ From the daily chart, gold closed with a large bearish candle, showing a clear decline. Short-term rebound pressure is heavy and market sentiment has turned bearish. The 4000 psychological level is the key support: if it holds, gold may continue to fluctuate within the upper range; if it breaks, t
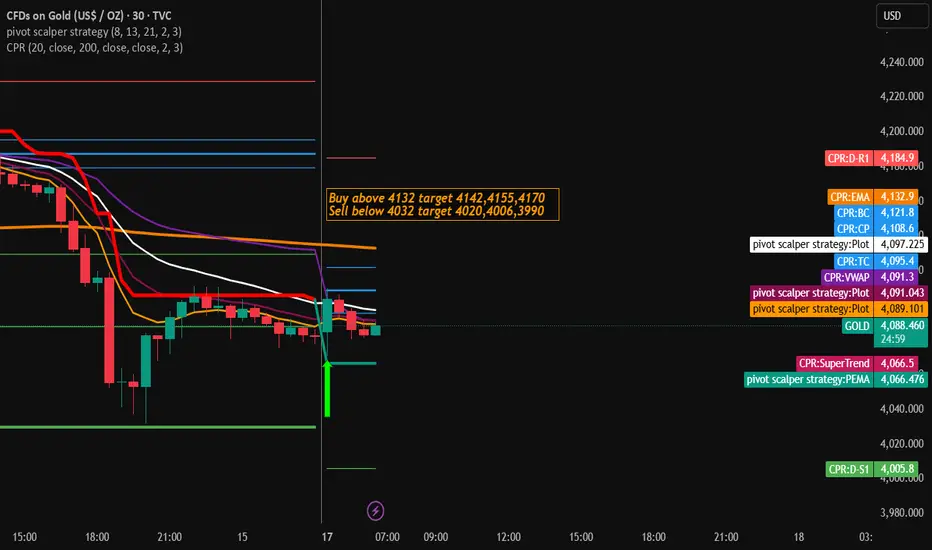
Gold Trading Strategy for 17th November 2025Gold Trading Plan
💰 Buy Setup (Long Trade)
Buy only if gold price closes above the high of the 30-minute candle at:
$4132
Targets:
$4142 (Target 1)
$4155 (Target 2)
$4170 (Target 3)
Idea:
If the price closes above $4132, it shows buyers are strong. Enter after the breakout and aim for the targets
Gold (Neowave Trading Idea)Hello everyone
# Gold is started walking again in daily charts and its going or atleast try for the time being to break its all time again.
## Stoploss will be 3964 if breaks dont sell just exit.
Thanks

XAUUSD MULTI TIMEFRAME ANALYSIS Hello traders , here is the full multi time frame analysis for this pair, let me know in the comment section below if you have any questions , the entry will be taken only if all rules of the strategies will be satisfied. wait for more price action to develop before taking any position. I suggest yo

Bullish sentiments on goldWe're in an uptrend so today we're trading from an h1 fvg targeting the opposite external liquidity....since London session we expect to see a continuation to the target.
Gold Technical Rebound to FVG, Prioritise WATCHING FOR SELL at 4📊 Market Structure
Gold has completed a strong decline from the peak of 4.21x, leaving consecutive Break of Structure (BoS), confirming a short-term bearish structure.
The drop through the Breakout zone of 4.10x indicates a dominant selling force.
Currently, the price is bouncing from the Premium

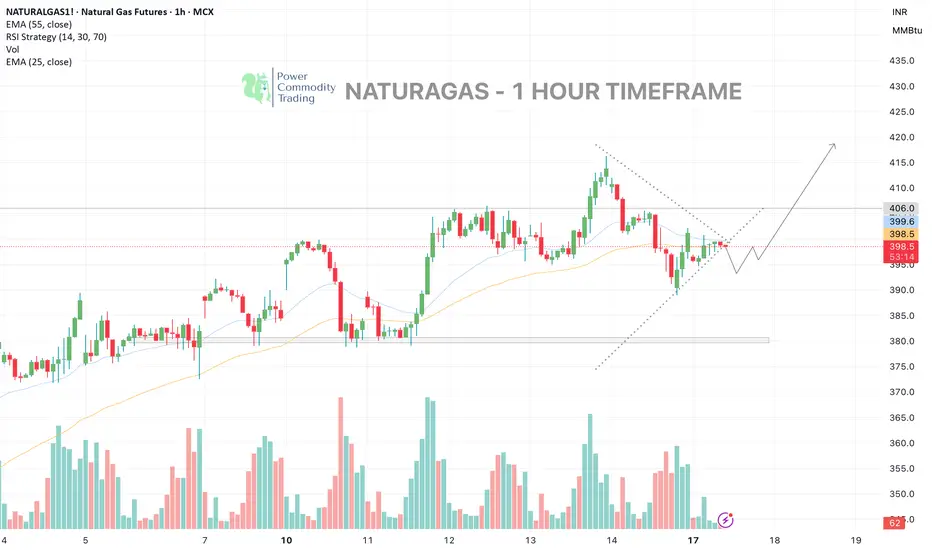
NATURALGAS | Structure tightening - Breakout pending?
NG on the 1H timeframe is forming a rising structure while testing the descending trendline.
Strategic Lens:
Expect a whipsaw zone between 398 – 404. The real directional clarity activates only above 406.
A breakout above 404/406 can open a clear upside path toward 412–420.
Failure to hold 394 sh
LiamTrading – XAUUSD H1 | Continue to watch for SELL at the ...LiamTrading – XAUUSD H1 | Continue to watch for SELL at the start of the week – wait for price to retrace to the trendline & resistance for a perfect entry
Gold is experiencing a sharp decline amidst global market liquidity pressures. The simultaneous drop in gold, stocks, and Bitcoin indicates tha

See all futures ideas
USDJPY MULTI TIMEFRAME ANALYSIS Hello traders , here is the full multi time frame analysis for this pair, let me know in the comment section below if you have any questions , the entry will be taken only if all rules of the strategies will be satisfied. wait for more price action to develop before taking any position. I suggest yo

EUR/JPY target has been achieved. as analyzed in the morning. price followed the trend and went to grab the liquidity of seller's
at top.

GBPNZD_Short Idea Elliot WaveI anticipate GBPNZD to decline below 2.3090, with a strict stop-loss set at 2.3450. Please conduct your own research before considering this trade.

GU Intraday setup on GU
Going with the structure and bullish orderflow.
First target 4H high and will look to take some partials on 15min most recent high.
USD/JPY – Weekly SMC Plan1. Weekly Bias
USD/JPY is showing signs of losing bullish momentum as multiple BMS (Break of Market Structure) events appear near the highs. The market keeps generating liquidity grabs, indicating potential distribution.
➡️ Weekly expectation: Bearish bias – priority is Sell from Premium zones.
2

GBPJPY - BULLISH CONTINUATION OR REVERSAL?Symbol - GBPJPY
GBPJPY has broken the structure of the local downtrend amid persistent weakness in the Japanese yen. This shift opens the possibility for a continuation of the broader bullish trend.
The yen continues to depreciate, while the British pound maintains its upward trajectory. A breakou

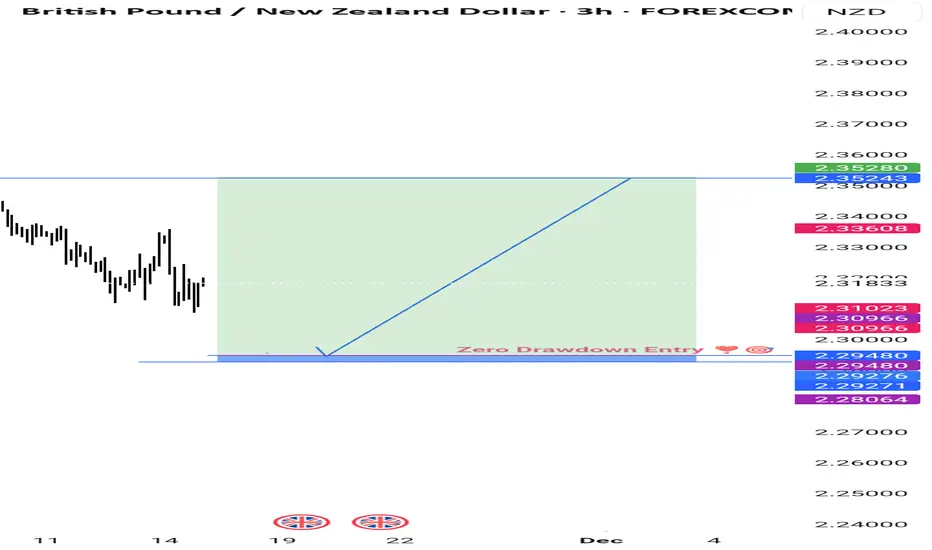
Zero DD Entry - Geometrical Analysis Self-similarity is a property where an object is partly or entirely similar to itself when viewed at different scales. This means that if you zoom in on a part of the object, it looks like the whole object, and this pattern can repeat infinitely for mathematical fractals. Many natural phenomena, suc
EUR/USD – Growth Opportunity After Positive DataThe EUR/USD pair is currently trading around 1.1612, up by 0.2% ahead of the September industrial production data from the Eurozone. This data is expected to show a 0.7% recovery for the month, following a sharp 1.2% decline the previous month. This is a positive signal for the Euro and could

EURUSD – Bullish Setup Toward 1.16EURUSD – Bullish Setup Toward 1.17
EURUSD is showing strong signs of a bullish reversal after an extended period of downside movement. The 3H chart highlights several Market Structure Shifts (MSS) and Breaks of Structure (BOS) suggesting that bearish momentum is fading and buyers are regaining cont

See all forex ideas
| - | - | - | - | - | - | - | - | ||
| - | - | - | - | - | - | - | - | ||
| - | - | - | - | - | - | - | - | ||
| - | - | - | - | - | - | - | - | ||
| - | - | - | - | - | - | - | - | ||
| - | - | - | - | - | - | - | - | ||
| - | - | - | - | - | - | - | - | ||
| - | - | - | - | - | - | - | - | ||
| - | - | - | - | - | - | - | - |
Trade directly on the supercharts through our supported, fully-verified and user-reviewed brokers.


