SAIL - Weekly - LongThis is a weekly chart of the SAIL, so it is useful for positional or swing trading.
First, let’s understand the trend based on the markings.
Earlier on the left side, the stock was making lower highs and lower lows, which clearly shows a downtrend. This phase is marked with “lower low” arrows. Aft

The best trades require research, then commitment.
Get started for free$0 forever, no credit card needed

Scott "Kidd" PoteetThe unlikely astronaut

Where the world does markets
Join 100 million traders and investors taking the future into their own hands.

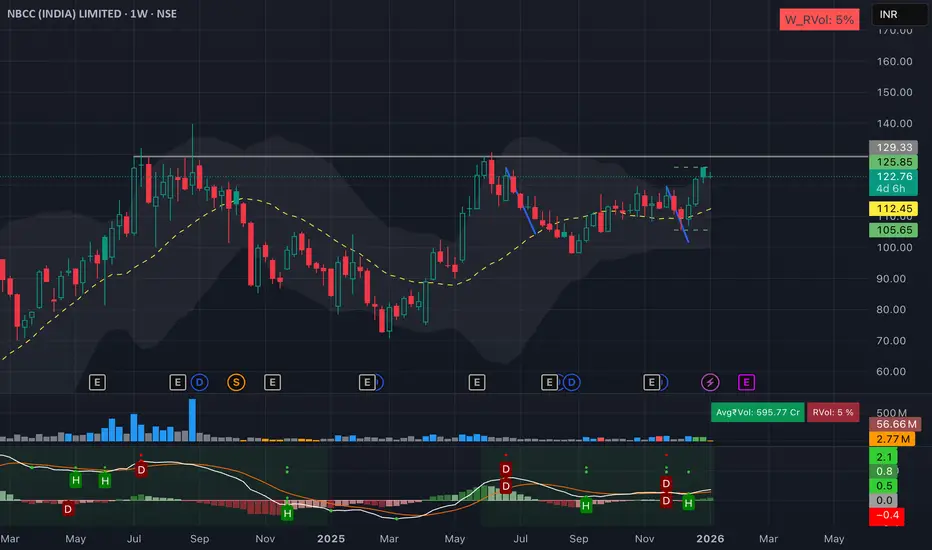
NBCC (India) Ltd | Weekly Consolidation Breakout SetupNBCC is showing a constructive weekly structure after a healthy pullback.
Price is holding above key moving averages
Higher lows indicate trend continuation
Tight consolidation near resistance suggests accumulation
Setup favors a range breakout on strength
Trade View:
Buy on strength above ₹125
Su
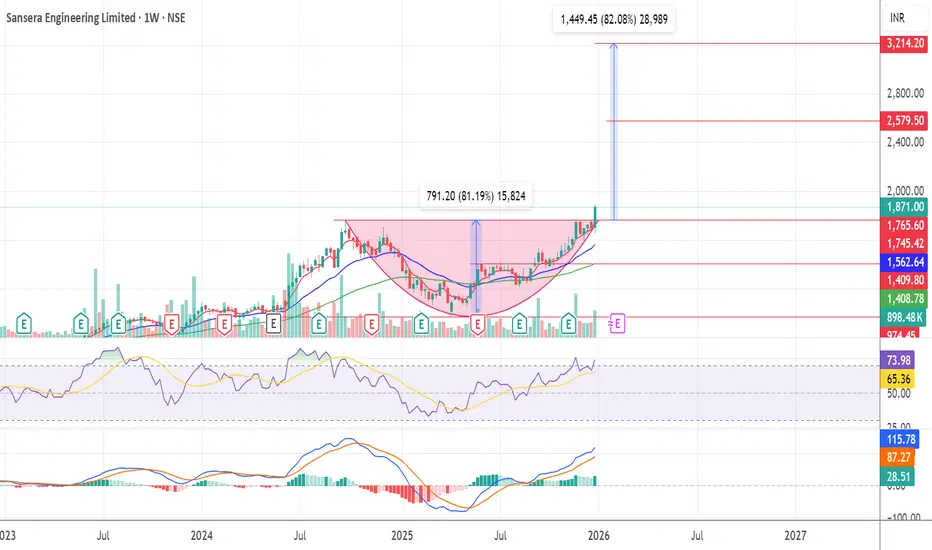
SANSERA ENGG@1871Not a SEBI registered, just sharing idea. On weekly time frame SANSERA @1871 gave breakout from rounding bottom @1767 with volume. Entry can be made 1871 and @1767, SL-1700 Target 1-2600 in 2-3 month, 2-3300 in 5-6 month. It is in Bull trend RSI on DAILY, WEEKLY >70 and MONTHLY>=70.
Crompton Greaves Falling?Technical (upgrade)
Crompton Greaves Consumer Electricals has been sliding inside a falling wedge, but price is trying to base around ₹248-252 (teal support on your chart). A daily close above ~₹260–262 (wedge top/near-term trendline) would confirm a breakout and set up a move toward ₹275 first an

BHEL – Weekly Trendline Still in ControlBHEL continues to trade in a strong uptrend on the weekly timeframe, with price respecting the rising trendline and closing near the recent highs around ₹299.50. The series of higher highs and higher lows remains intact, and the latest bullish weekly candle reinforces the strength of buyers along th

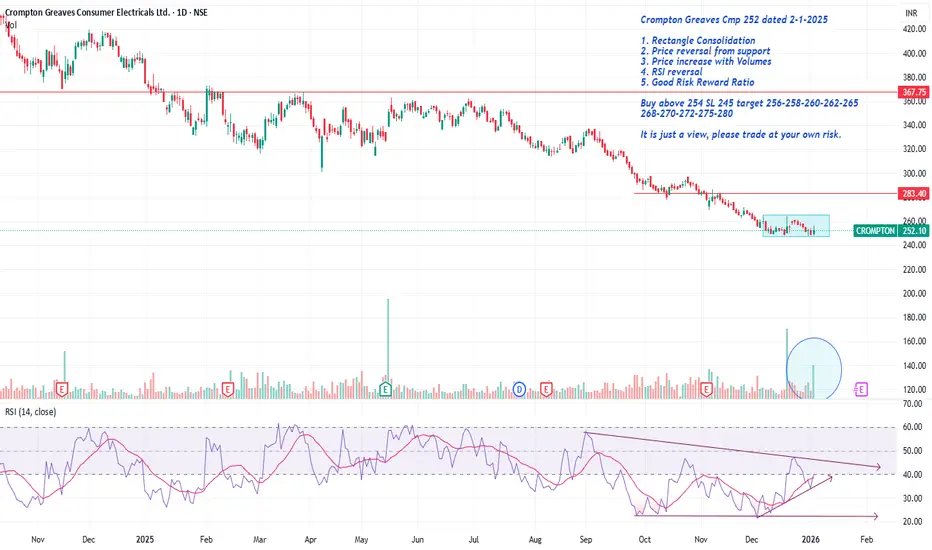
Crompton Greaves Cmp 252 Reversed from supportCrompton Greaves Cmp 252 dated 2-1-2025
1. Rectangle Consolidation
2. Price reversal from support
3. Price increase with Volumes
4. RSI reversal
5. Good Risk Reward Ratio
Buy above 254 SL 245 target 256-258-260-262-265
268-270-272-275-280
It is just a view, please trade at your own risk.
Nifty50 and Overall Market analysisIn this video, we discuss Nifty50 and Overall Market analysis
Current market scenario
Long term vs Short term chart analysis
Major sector index analysis and my views on them
Long term vs Short term Investment approach

Trading view, Mountains, Back testing strategy & New yearHappy new year to the Trading view Family, Wishing everyone a strong Year Ahead and in green .
Keep back testing and learning .

BPCL : Trading the Confluence of Price Action & Macro TailwindsThe stock has been consolidating within a defined range over the past few weeks and has recently started forming a solid base. While the breakout volume isn’t a classic “God-candle,” price action continues to hold firmly above key moving averages, which is a constructive sign. That said, the price i

GIFTNIFTY IntraSwing Levels For 02nd JAN 2026🚀Follow & Calculate Premium with NIFTY Post for NF Trading
💥Level Interpretation / description:
L#1: If the candle crossed & stays above the “Buy Gen”, it is treated / considered as Bullish bias.
L#2: Possibility / Probability of REVERSAL near RLB#1 & UBTgt
L#3: If the candle stays above “Sell

See all editors' picks ideas
Arbitrage Detector [LuxAlgo]The Arbitrage Detector unveils hidden spreads in the crypto and forex markets. It compares the same asset on the main crypto exchanges and forex brokers and displays both prices and volumes on a dashboard, as well as the maximum spread detected on a histogram divided by four user-selected percenti

Multi-Distribution Volume Profile (Zeiierman)█ Overview
Multi-Distribution Volume Profile (Zeiierman) is a flexible, structure-first volume profile tool that lets you reshape how volume is distributed across price, from classic uniform profiles to advanced statistical curves like Gaussian, Lognormal, Student-t, and more.
Instead of forcin

Multi-Ticker Anchored CandlesMulti-Ticker Anchored Candles (MTAC) is a simple tool for overlaying up to 3 tickers onto the same chart. This is achieved by interpreting each symbol's OHLC data as percentages, then plotting their candle points relative to the main chart's open. This allows for a simple comparison of tickers to tr

Vdubus Divergence Wave Pattern Generator V1The Vdubus Divergence Wave Theory
10 years in the making & now finally thanks to AI I have attempted to put my Trading strategy & logic into a visual representation of how I analyse and project market using Core price action & MacD. Enjoy :)
A Proprietary Structural & Momentum Confluence System

Per Bak Self-Organized CriticalityTL;DR: This indicator measures market fragility. It measures the system's vulnerability to cascade failures and phase transitions. I've added four independent stress vectors: tail risk, volatility regime, credit stress, and positioning extremes. This allows us to quantify how susceptible markets are

Volatility Risk PremiumTHE INSURANCE PREMIUM OF THE STOCK MARKET
Every day, millions of investors face a fundamental question that has puzzled economists for decades: how much should protection against market crashes cost? The answer lies in a phenomenon called the Volatility Risk Premium, and understanding it may fundam

Volume Gaps & Imbalances (Zeiierman)█ Overview
Volume Gaps & Imbalances (Zeiierman) is an advanced market-structure and order-flow visualizer that maps where the market traded, where it did not, and how buyer-vs-seller pressure accumulated across the entire price range.
The core of the indicator is a price-by-price volume prof

Match Finder [theUltimator5]Match Finder is the dating app of indicators. It takes your current ticker and finds the most compatible match over a recent time period. The match may not be Mr. right, but it is Mr. right now. It doesn't forecast future connection, but it tells you current compatibility for today.
Jokes aside,

Trend Line Methods (TLM)Trend Line Methods (TLM)
Overview
Trend Line Methods (TLM) is a visual study designed to help traders explore trend structure using two complementary, auto-drawn trend channels. The script focuses on how price interacts with rising or falling boundaries over time. It does not generate trade sign

Breakouts & Pullbacks [Trendoscope®]🎲 Breakouts & Pullbacks - All-Time High Breakout Analyzer
Probability-Based Post-Breakout Behavior Statistics | Real-Time Pullback & Runup Tracker
A professional-grade Pine Script v6 indicator designed specifically for analyzing the historical and real-time behavior of price after strong All-Ti

See all indicators and strategies
Community trends
An Optimal Way to Enter a Trade- Breakout or PullbackThis chart highlights what could to be ideal trade opportunities when viewed in hindsight.
At first glance, many traders would assume the best entry was at the breakout, with a stop-loss placed below the breakout candle. However, that assumption ignores an important reality: at the moment of the br

SAIL - Weekly - LongThis is a weekly chart of the SAIL, so it is useful for positional or swing trading.
First, let’s understand the trend based on the markings.
Earlier on the left side, the stock was making lower highs and lower lows, which clearly shows a downtrend. This phase is marked with “lower low” arrows. Aft
WELSPUNLIV | Weekly chart study | OpportunityWelspun Living in very well pinned as a short-term technical highlights, backed by a strong breakout structure on higher timeframes.
🔹 Key Points
📈 Buy Zone: ₹142 – ₹145
🎯 Targets: ₹162 – ₹170
🚨 Stop-Loss: ₹134
⏳ Expected Duration: 3–4 weeks
📈 Why This Setup Looks Bullish
✔️ Trendline Breakout:
Th

MMFL: Stage 1 to Stage 2 Breakout SetupThe Core Thesis: Change of Character (Weinstein Stage 1 Breakout)
After a prolonged period of underperformance and sideways consolidation (the "Stage 1 Base"), MMFL has shown a clear Change of Character. The stock is emerging from its long-term accumulation zone, supported by a significant "volume

Auropharma at crucial levelAs per the daily chart, the price is forming an inverted head and shoulder pattern. The price should sustain the zone 1250 - 1260 to move up. Today's movement shows, the bulls have the strength to give a movement.
If the price opens above 1230 and shows bullish strength, buy above 1236 with the stop

INDUSINDBK 1 Day Time Frame 📍 Latest Price Context
The stock recently closed around ≈ ₹902.45 on the NSE (close of 2 Jan 2026) with intraday range ~₹890‑₹910.
📊 Daily Technical Levels (Support & Resistance)
🔸 Pivot & Major Levels
Level Price (INR)
Pivot Point (Daily) ~₹900.8
Resistance 1 (R1) ~₹911.4
Resistance 2 (R2) ~₹92

NBCC (India) Ltd | Weekly Consolidation Breakout SetupNBCC is showing a constructive weekly structure after a healthy pullback.
Price is holding above key moving averages
Higher lows indicate trend continuation
Tight consolidation near resistance suggests accumulation
Setup favors a range breakout on strength
Trade View:
Buy on strength above ₹125
Su
Difference btw Beginner, Pro and Full time Traders ( Mtfa view )In this Big 20 minutes video, I will try to explain the most beautfull conept of Multi time frame analysis from the perspective of 4 different types of trader .
Charts used are older than 3 months

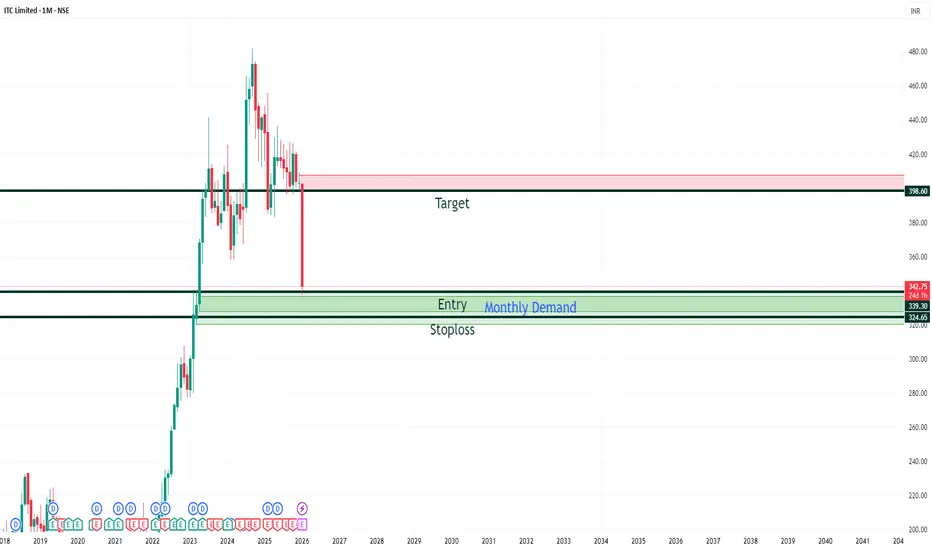
ITC Monthly Chart Analysis - Monthly&Quaterly Demand SetypITC Limited has recently shown a strong correction from its highs near ₹400+, retracing towards a key Monthly Demand Zone, indicating a potential accumulation area for long-term buyers.
🧩 Chart Structure & Key Levels:
Entry Zone (Monthly Demand): ₹339 – ₹336
Stoploss Zone: Below ₹324
Target Zone
Capitulation Zone Hit, Strong Base Building with RSI DivergenceCapitulation Zone Hit, Strong Base Building with RSI Divergence
Price has corrected sharply from the top and is now trading near a major longterm demand zone around the previous accumulation base. This zone earlier acted as a strong launchpad for a big rally making it structurally important again.

See all stocks ideas
Tomorrow
EIMCOELECOEimco Elecon (India) Ltd.
Actual
—
Estimate
—
Tomorrow
ELECONElecon Engineering Co. Ltd.
Actual
—
Estimate
—
Jan 9
GLOBUSSPRGlobus Spirits Limited
Actual
—
Estimate
—
Jan 9
TEJASNETTejas Networks Ltd.
Actual
—
Estimate
—
Jan 9
JUSTDIALJust Dial Ltd.
Actual
—
Estimate
13.95
INR
Jan 10
DMARTAvenue Supermarts Ltd.
Actual
—
Estimate
11.29
INR
Jan 12
TCSTata Consultancy Services Limited
Actual
—
Estimate
35.97
INR
Jan 12
HCLTECHHCL Technologies Limited
Actual
—
Estimate
17.46
INR
See more events
Community trends
#BITCOIN is compressing inside a falling wedge on the lower time#BITCOIN is compressing inside a falling wedge on the lower timeframe after a strong impulsive move. This structure usually signals pause before expansion, not weakness. Price is respecting both trendlines cleanly, showing balance between buyers and sellers.
What matters now is how price exits this

ETHUSD | Premium Zone Reaction After Impulsive Rally (SMC Short Market Context
Ethereum has delivered a strong impulsive move to the upside, breaking previous structure and expanding aggressively from the discount region. Price is now trading inside a higher-timeframe premium zone, where distribution is likely to occur.
This area aligns with smart money profit

Bitcoin buy recommended on Friday 94000 target hit 98000 next Parameter Data
Asset Name/LTP Bitcoin (BTC/USDT) LTP: $94,046.91
Time Frame of Analysis Short-Term/Swing (Daily & 4H Chart)
💰 Current Trade BUY ON DIPS Active. T1: $95,500, T2: $98,000, SL: $91,200.
📈 Price Movement 🟩 +2.74% (+$2,505). Day High: $94,232. Low: $91,541.
🌊 SMC Structure 🟩 Bullish: Tr

BITCOIN BACK TO 109K..... Bell is ringing....Through my analysis, weekly shows firm bullish.
Geo political uncertainty all over the world because venezuela president capture.
Join this with weekly bias leads to lot of upward momentum.
Bos happened in daily timeframe with good price momentum.
So the next resistance is 97k and then to 109k.
Mar

BTCUSD Price Structure & Key LevelsBTCUSD is showing a clear recovery after an earlier corrective decline. Price found strong buying interest around the 86,000–86,500 zone, where selling pressure weakened and the market began forming higher lows. This behaviour signalled a shift in control from sellers to buyers.
The bullish shift w

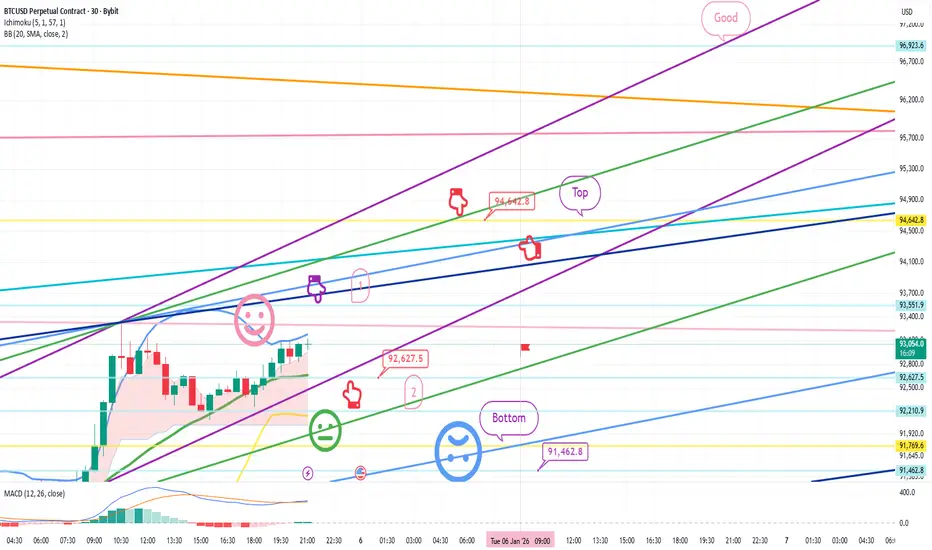
Bitcoin Bybit chart analysis JENUARY 5Hello
It's a Bitcoin Guide.
If you "follow"
You can receive real-time movement paths and comment notifications on major sections.
If my analysis was helpful,
Please click the booster button at the bottom.
This is a Bitcoin 30-minute chart.
There will be a Nasdaq indicator release at 12:00 PM s
#BTC.P Up for next super cycle?
BTC is in a corrective downtrend within a defined channel and is currently reacting from a higher-timeframe demand zone. The setup anticipates a potential trend reversal contingent on a confirmed breakout and acceptance above the descending trendline and mid-range resistance. Upside expansion is

$ONDO PRICE FORECAST | IS $7.65+ POSSIBLE? | CRYPTOPATEL TALSE:ONDO Is Trading At A High-Timeframe Fibonacci Demand Zone, Holding The 0.618 Retracement (~$0.45) After A Deep Corrective Move — A Textbook Accumulation Structure.
Technical Structure
Accumulation Zone: $0.40–$0.45
Bullish Order Block / Deeper Demand: $0.25–$0.30 (0.786 Fib)
HTF Structure Rema

Why Bitcoin Broke Out After Weeks of Boring Price Action?Hello guy's let's analyse Bitcoin because for weeks, Bitcoin stayed inside a tight compression range while most traders lost interest. Price looked slow, directionless, and boring, exactly the phase where liquidity gets built quietly.
This breakout matters because it didn’t come after a spike.
It c

BTC Cup and handle inside big BearFlag Risng wageUpdate
BTC reached a major rise around
1. Shows cup and handle where the handle is completed, short-term pullback might breakout today or tomorrow
2. Next Leg up around 97k - Porbablity 60%
3. Major Pull Back around 100k

See all crypto ideas
XAUUSD (H1) – Inverse Head & Shoulders confirmed, caution POC.Market overview
Spot gold has pushed above $4,470/oz, extending its strong performance after setting multiple record highs throughout 2025. The broader bullish backdrop remains intact, supported by trade-war concerns, ongoing geopolitical instability, and accommodative monetary policy across major

XAUUSD Smart Money Levels: Demand 4312, Supply 4436XAUUSD – Intraday Smart Money Plan | by Ryan_TitanTrader (05/01)
Market Context
Gold remains structurally bullish on higher timeframes, yet short-term price action shows pullback pressure after premium liquidity was elected near 4440. As markets brace for ongoing USD direction from macro catalyst

Gold Trading Strategy for 06th January 2026🟡 GOLD (XAU) INTRADAY TRADING SETUP 🟡
📈 BUY SETUP (BULLISH SCENARIO)
🟢 Buy Trigger:
➡️ Buy above the HIGH of the 1-Hour candle
➡️ Candle must CLOSE above 4456
🟢 Entry Confirmation:
✔️ Strong 1H candle close above resistance
✔️ Buyers showing strength above 4456
🎯 Buy Targets:
🥇 Target 1: 4468
🥈

Silver comex buy recommended near 72$ ,79$ to 80$ will come soonParameter Data
Asset Name/LTP Silver Comex (SI, Mar 2026 FUT) LTP: $76.620
Time Frame of Analysis Short-Term/Swing (Daily & 4H Chart)
💰 Current Trade BUY ON DIPS Active. T1: $78.00, T2: $80.00, SL: $72.50.
📈 Price Movement 🟩 +7.89% (+$5.605). Day High: $77.76. Low: $72.51.
🌊 SMC Structure 🟩 Bullis

XAUUSD liquidity changes amid 2026 Black Swan risksXAUUSD H1 – Liquidity Rotation Under Black Swan Risks in 2026
Gold is once again being driven by liquidity and macro uncertainty. While short-term price action is rotating around key Volume Profile levels, the broader backdrop for 2026 is increasingly shaped by underestimated systemic risks, often

US OIlafter highs of 78 in June 2025 we had steep fall in prices towards April 2025 lows 55 lots of consolidation have been seen in zone 62-55 from oct 25 to dec 25 . For the first time yesterday close has closed above downtrend line of last 7 month that also with bullish reversal candela . so now 55 -56

Bullish CrudeoilYou can see down trendline from June 25 around 6500 to till now..
Now it's time to break the trendline..
If the trendline break and close above the trendline..
Next level around 5600 1st..
2nd 5900 and 3rd is 6100 again..

XAUUSD – M30 Trading Plan | Buy Demand + GAP–FiboAUUSD – M30 Trading Plan | Buy Demand + GAP–Fibo
🔍 Market Context (SMC)
The price has formed an upward BOS, confirming the short-term trend still belongs to the BUY side. The current decline is just a technical pullback to rebalance the cash flow, there is no bearish CHoCH → no reason to reverse th

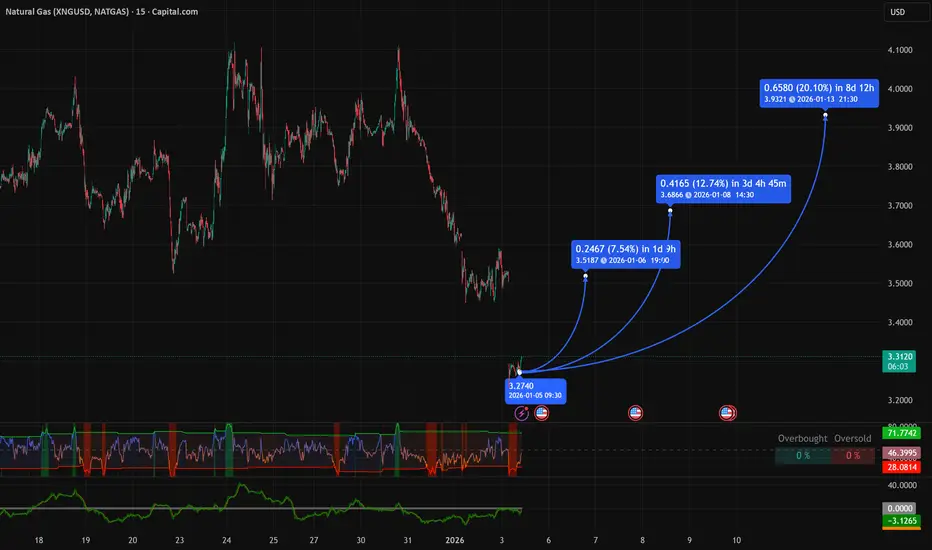
NATGAS CAPITAL (USD) Current Price: ~3.280 USD Bias: BullishNATGAS CAPITAL is holding in a strong demand zone (3.00–3.20). With weather still in play and colder patterns likely later this winter, heating demand may pick up — supporting natural gas prices and potentially pushing this instrument higher.
Immediate resistances at 3.51, 3.68, 3.92; breakout beyo
SILVER | XAGUSD 1H Chart - Make or Break LevelsFX:XAGUSD MCX:SILVER1!
Silver is trading at a make-or-break support zone — this level will decide whether the broader uptrend survives or cracks.
🔹 Price is sitting near the 200 EMA, a level that historically acted as a launchpad
🔹 Last time Silver tested the 200 EMA (around $50), it marked the

See all futures ideas
EURUSD – Liquidity Sweep + Break of Descending ChannelTimeframe: 1H
Bias: Bullish Reversal
Concepts Used: Liquidity Sweep • Discount Pricing • Reversal Structure • FVG • Channel Break
Trade Idea Summary
EURUSD has swept major sell-side liquidity below the previous swing low and immediately reacted from a deep discount demand zone. After the liquidity

EURUSD Analysis on (05 Jan 2026)#EURUSD UPDATEDE
Current price - 1.17144
If price stay above 1.16600 then next target 1.18000 and below that 1.16000

GBPUSD SHOWING A GOOD DOWN MOVE WITH 1:10 RISK REWARDGBPUSD SHOWING A GOOD DOWN MOVE WITH 1:10 RISK REWARD
DUE TO THESE REASON
A. its following a rectangle pattern that stocked the marketwhich preventing the market to move any one direction now it trying to break the strong resistant lable
B. after the break of this rectangle it will boost the mark

NZD/CAD in 4hr time framePresent chart suggests strong buy in 4hr time frame for a target mentioned in the chart. Strong impulse with an upside is expected.

USDJPY Sell TradePrice is currently in a downtrend on the 1Hour timeframe. Price retested the orderblock on the 15min Timeframe with was also between the 0.62 and 0.78 fibonacci level. Price is now rejecting the oredrblock and looking to continue to the down trend. We are targetting a 1:2 RR and Stoploss and takepro

GBPJPY sell active setup GBPJPY as expected running check my previous idea 💡 I link to this, TP 🎯 missed still struggling possible TP let's see 📈📉

WHEN THE RUPEE SCREAMS, MARKETS WHISPERA 20‑Year Inter‑Market Study Linking USD/INR Extremes to NIFTY Turning Points
Executive Snapshot
For over two decades, the USD/INR exchange rate has followed a clearly defined long‑term rising channel. This study explores a powerful yet under‑discussed inter‑market relationship: Indian equity marke

Usd jpy idea correction in terms of higher Timeframe The previous idea posted about usd jpy should hit 172$ in terms of lower timeframe but 12 month or 1 year timeframe shows target is done....

GBPUSD broke level of 1.34820As you can see GBPUSD broke level of 1.34820 and massive fall already happened so I give you next expected move.
Plan your trade accordingly.

USDINR — Controlled Structural TrendUSDINR continues to trade within a long-term rising channel on the yearly timeframe.
The move reflects gradual structural INR depreciation , driven by macro differentials rather than stress or disorderly conditions.
No currency regime shift is visible at cycle degree.
Invalidation: Only a sust

See all forex ideas
| - | - | - | - | - | - | - | - | ||
| - | - | - | - | - | - | - | - | ||
| - | - | - | - | - | - | - | - | ||
| - | - | - | - | - | - | - | - | ||
| - | - | - | - | - | - | - | - | ||
| - | - | - | - | - | - | - | - | ||
| - | - | - | - | - | - | - | - | ||
| - | - | - | - | - | - | - | - | ||
| - | - | - | - | - | - | - | - |
Trade directly on Supercharts through our supported, fully-verified, and user-reviewed brokers.


