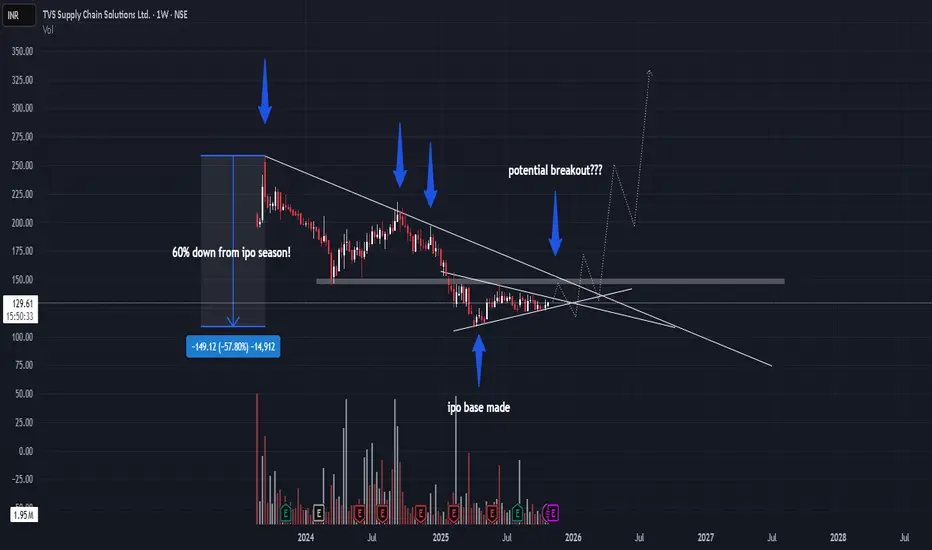
potential multibagger? TVSSCS buy trigger above 150 level
holding for more than 2-3years
hoping TVSSCS is going to be 2-3x
TVS SCS (TVS Supply Chain Solutions) is from the TVS Group, which also includes TVS Motor Company. Both companies are part of the larger TVS Mobility Group, and TVS Motor Company has increased its stake i

The best trades require research, then commitment.
Get started for free$0 forever, no credit card needed

Scott "Kidd" PoteetThe unlikely astronaut

Where the world does markets
Join 100 million traders and investors taking the future into their own hands.
Indraprastha Medical Ltd | Bullish Flag Breakout | Swing SetupCompany Overview (Fundamental)
Indraprastha Medical Corporation Ltd (IMCL) operates under the Apollo Hospitals Group and manages the Indraprastha Apollo Hospital, New Delhi — one of India’s largest multi-specialty hospitals. Company financially strong, consistent profitability, improving margins,

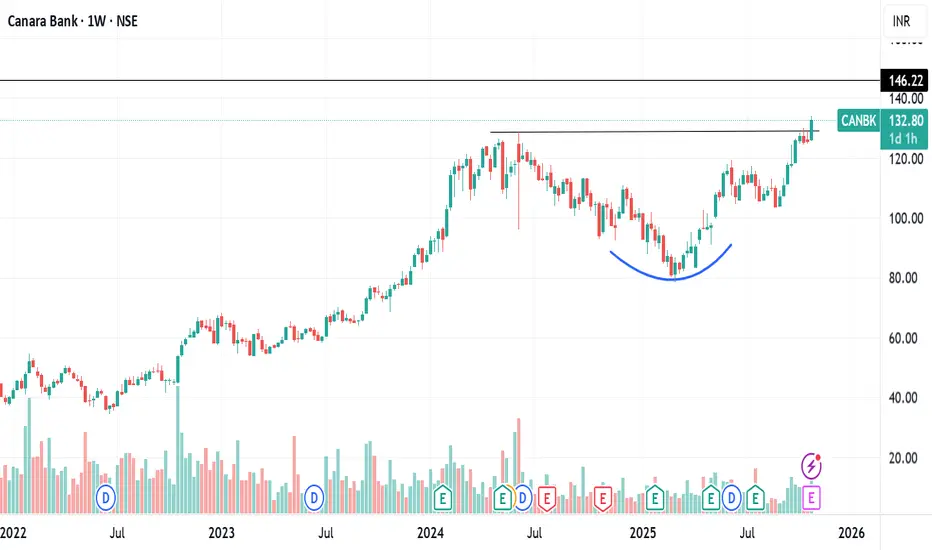
CANARA BANK ROUNDING BOTTOM BREAKOUTCanara bank breaking rounding bottom weekly
with huge volume this week
RSI above 60 bullish
heading towards 15 yr high
q2 net profit rises 19% +ve
target 146 then can lead to ATH 164 also
NO BUY/SELL RECOMENDATION
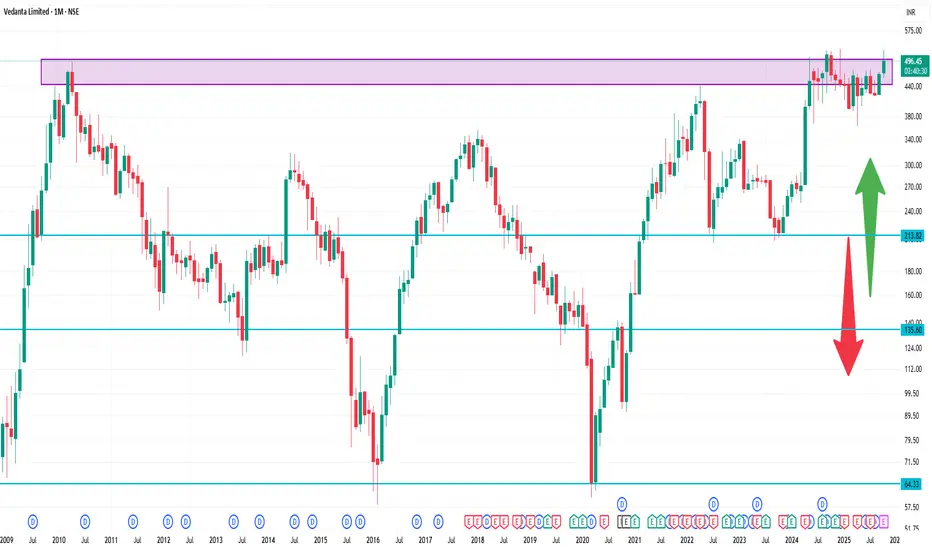
VEDLStrong Breakout Candidates!
#VEDL
1- Bottom Formation bo.
2- Uptrend is Still Intact
3- Trading above all key moving averages
Keep on Radar.
Potential Upside Stocks!
#Disclaimer: View shared it for educational purposes only.
Follow for more upcoming charts.

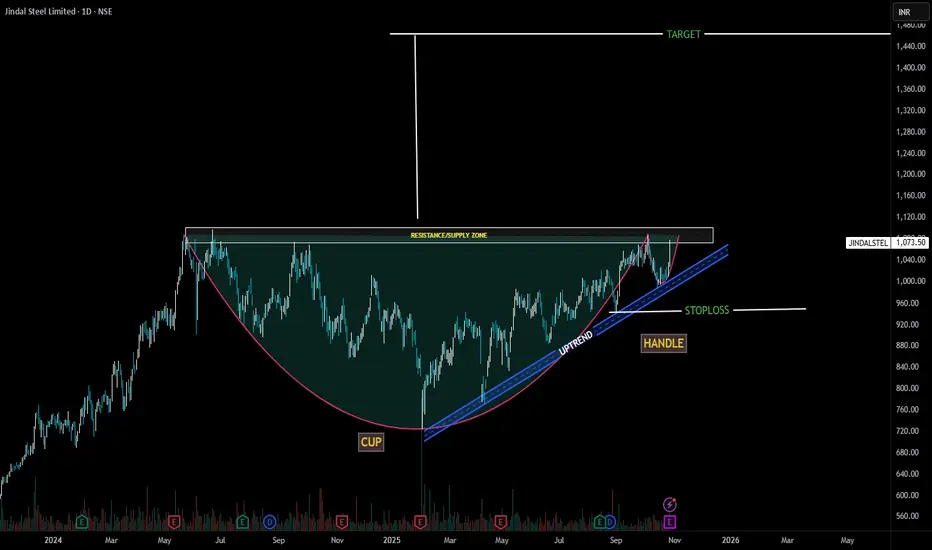
JINDAL STEEL LIMITEDCup Formation:
The left side shows a clear decline followed by a rounded bottom and a steady recovery forming a "U" shape — ✅ valid cup structure.
Volume tends to decrease during the cup and increase on the right side — which seems consistent here.
Handle Formation:
The handle is shorter in dura
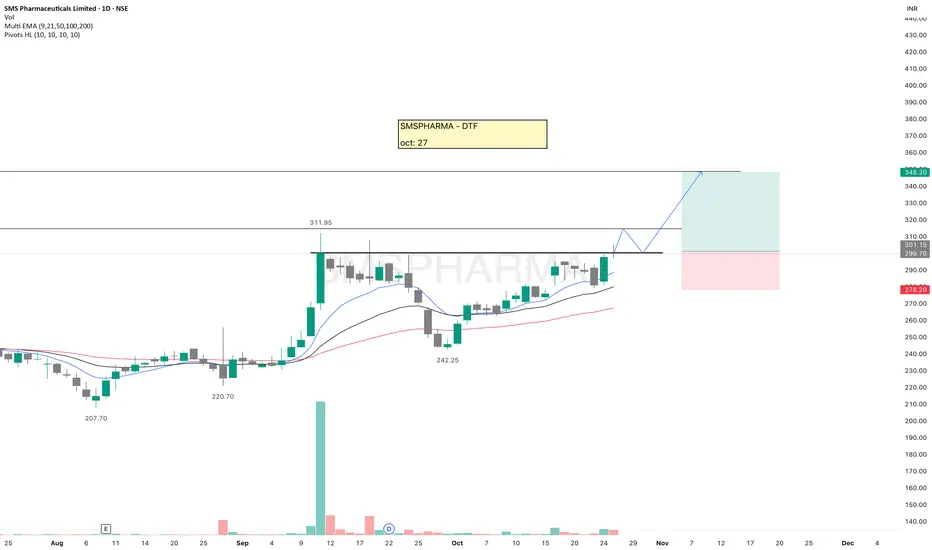
SMSPHARMASMSPHARMA is looking strong and forming a bullish structure. A breakout from the current level can lead to a good upside move.
Even while paper trading, always use a stop-loss, it builds the right trading habit.
Keep this stock on your watchlist.
✅ If you like my analysis, please follow me here
BANCOINDIA Testing Powerful Demand Zone + Breakout Retest 🧠 Understanding the Smart Money Footprints 🧠
Demand and supply zones are not just colorful boxes on a chart — they represent the footprints of smart money . When institutions buy, they don’t enter all their orders at once like retail traders do. Instead, they accumulate positions in parts — leavi

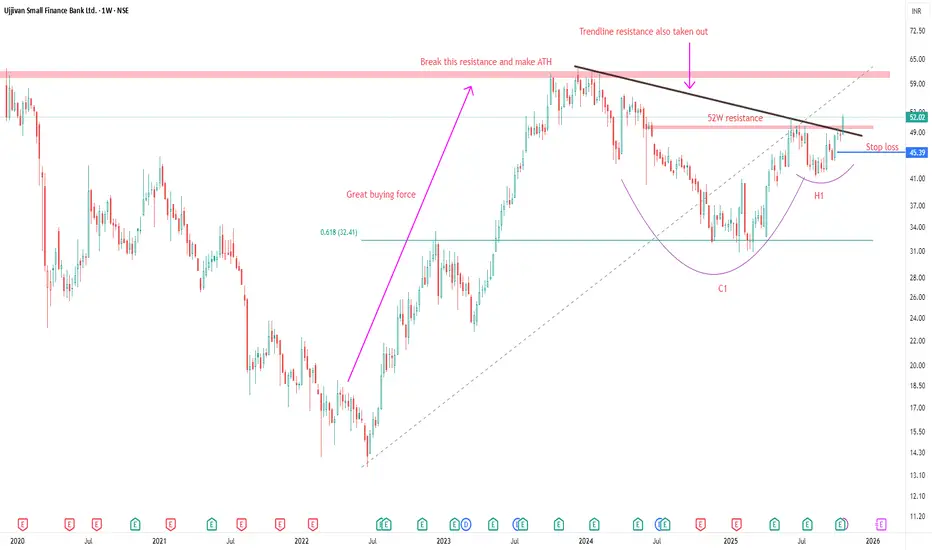
UJJIVAN SMALL FINANCE BANK ANALYSISTHIS IS MY CHART OF THE WEEK PICK
FOR LEARNING PURPOSE
UJJIVAN SMALL FINANCE BANK LTD- The current price of UJJIVAN is 52.02 rupees
I am going to buy this stock because of the reasons as follows-
1. It made a 52W high by breaking avery strong resistance and volume is good too.
Nifty Price Action Analysis for Nov 202525-Oct-25:
Nifty broke 25500 resistance with good volume on 15th Oct.
CMP is 25795 as on 24th Oct.
For November series Nifty is likely to take pullback support at 25400-25600 levels then at 25100 levels.
Major uptrend support lies at 24600 levels for another attempt for lifetime high

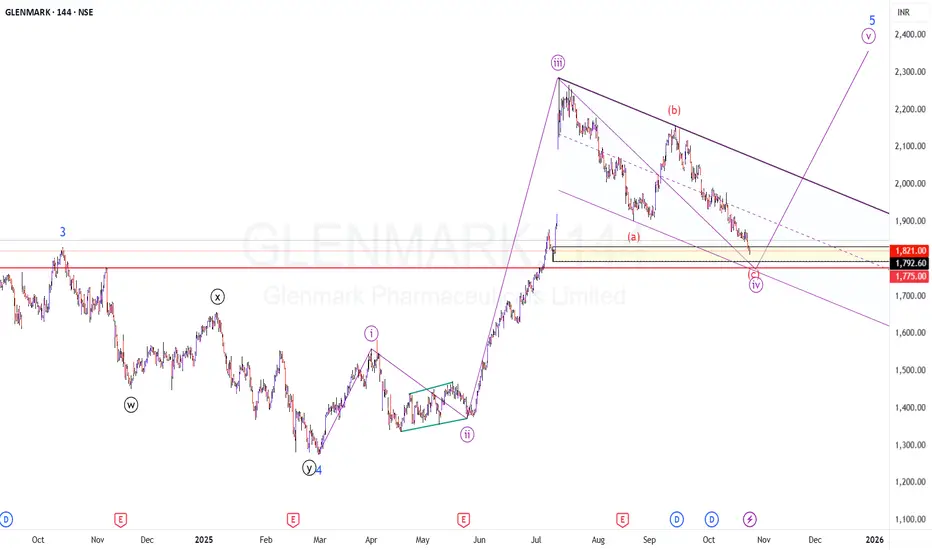
GLENMARK - Time for ATH?CMP: 1821
TFL 144 Minutes
Observation:
The script has been in bullish trend since March 2020 (Covid Lows) and is in the final leg of the impulse structure.
This view is considered from Feb-2025 lows (1275.5) for the 5th wave.
The counts are marked in the chart.
In a nutshell, price is about t
See all editors' picks ideas
LogNormalLibrary "LogNormal"
A collection of functions used to model skewed distributions as log-normal.
Prices are commonly modeled using log-normal distributions (ie. Black-Scholes) because they exhibit multiplicative changes with long tails; skewed exponential growth and high variance. This approach i

Range Oscillator (Zeiierman)█ Overview
Range Oscillator (Zeiierman) is a dynamic market oscillator designed to visualize how far the price is trading relative to its equilibrium range. Instead of relying on traditional overbought/oversold thresholds, it uses adaptive range detection and heatmap coloring to reveal where pri

Volume Surprise [LuxAlgo]The Volume Surprise tool displays the trading volume alongside the expected volume at that time, allowing users to spot unexpected trading activity on the chart easily.
The tool includes an extrapolation of the estimated volume for future periods, allowing forecasting future trading activity.
🔶 U

Smooth Theil-SenI wanted to build a Theil-Sen estimator that could run on more than one bar and produce smoother output than the standard implementation. Theil-Sen regression is a non-parametric method that calculates the median slope between all pairs of points in your dataset, which makes it extremely robust to o

Fair Value Gaps by DGTFair Value Gaps
A refined, multi-timeframe Fair Value Gap (FVG) detection tool that brings institutional imbalance zones to life directly on your chart.
Designed for precision, it visualizes how price delivers into inefficiencies across chart, higher, and lower (intrabar) timeframes — offering a fl

TASC 2025.11 The Points and Line Chart█ OVERVIEW
This script implements the Points and Line Chart described by Mohamed Ashraf Mahfouz and Mohamed Meregy in the November 2025 edition of the TASC Traders' Tips , "Efficient Display of Irregular Time Series”. This novel chart type interprets regular time series chart data to create an ir

Simplified Percentile ClusteringSimplified Percentile Clustering (SPC) is a clustering system for trend regime analysis.
Instead of relying on heavy iterative algorithms such as k-means, SPC takes a deterministic approach: it uses percentiles and running averages to form cluster centers directly from the data, producing smoo

Adaptive Volume Delta Map---
📊 Adaptive Volume Delta Map (AVDM)
What is Adaptive Volume Delta Map (AVDM)?
The Adaptive Volume Delta Map (AVDM) is a smart, multi-timeframe indicator that visualizes buy and sell volume imbalances directly on the chart.
It adapts automatically to the best available data resolution

Dynamic Equity Allocation Model"Cash is Trash"? Not Always. Here's Why Science Beats Guesswork.
Every retail trader knows the frustration: you draw support and resistance lines, you spot patterns, you follow market gurus on social media—and still, when the next bear market hits, your portfolio bleeds red. Meanwhile, institution

First Passage Time - Distribution AnalysisThe First Passage Time (FPT) Distribution Analysis indicator is a sophisticated probabilistic tool that answers one of the most critical questions in trading: "How long will it take for price to reach my target, and what are the odds of getting there first?"
Unlike traditional technical indicators

See all indicators and strategies
Community trends
Indraprastha Medical Ltd | Bullish Flag Breakout | Swing SetupCompany Overview (Fundamental)
Indraprastha Medical Corporation Ltd (IMCL) operates under the Apollo Hospitals Group and manages the Indraprastha Apollo Hospital, New Delhi — one of India’s largest multi-specialty hospitals. Company financially strong, consistent profitability, improving margins,
potential multibagger? TVSSCS buy trigger above 150 level
holding for more than 2-3years
hoping TVSSCS is going to be 2-3x
TVS SCS (TVS Supply Chain Solutions) is from the TVS Group, which also includes TVS Motor Company. Both companies are part of the larger TVS Mobility Group, and TVS Motor Company has increased its stake i
CANARA BANK MONTHLY BREAKOUTCANARA BANK MONTHLY BREAKOUT
Technical indicators and trend analysis are showing the scrip is bullish. Also usually monthly breakouts are sustainable for going long.
Kindly do your analysis as well.

ACC stocks consolidated at previous support zone and Nice price.ACC price is corrected and consolidate at support zone. The opportunity create the level of after 1960 and target is 2700

BUY TODAY SELL TOMORROW for 5% DON’T HAVE TIME TO MANAGE YOUR TRADES?
- Take BTST trades at 3:25 pm every day
- Try to exit by taking 4-7% profit of each trade
- SL can also be maintained as closing below the low of the breakout candle
Now, why do I prefer BTST over swing trades? The primary reason is that I have observed t

CANARA BANK ROUNDING BOTTOM BREAKOUTCanara bank breaking rounding bottom weekly
with huge volume this week
RSI above 60 bullish
heading towards 15 yr high
q2 net profit rises 19% +ve
target 146 then can lead to ATH 164 also
NO BUY/SELL RECOMENDATION
VEDL 1 Month Time Frame 🧭 Key levels to watch in the next ~4-5 weeks
Here are support and resistance levels relevant for the 1-month horizon:
🔷 Resistance
~ ₹501.40 — Monthly pivot/standard resistance level.
More immediate short-term resistance around ~ ₹497-₹500 zone based on recent highs.
🔻 Support
First key support
Major Counter Trendline Structure, Strong Channel & Demand FlipThe weekly chart for Chennai Petroleum Corporation Ltd (CPCL) presents a robust technical development without classic breakout language.
-Price action has respected a prominent red counter trendline, with the latest move representing a shift in momentum against the prior trend.
-A clean parallel c

CANBK | Cup and Handle | Wkly📆 Multi-Year Weekly Chart
🔹 Pattern: Cup & Handle (2010–2025)
🔹 Breakout Zone: ₹124–126 ✅
🔹 Current Price: ₹132.9
🔹 Target: ₹235 (~+88%)
🔹 Stop-loss: ₹118
🔹 Support: ₹115–118
🔹 Resistance: ₹164
Trend Strength:
✅ Price > EMA50 / EMA100 / EMA200
✅ Rising volume on breakout
✅ Bullish PSU bank momentu

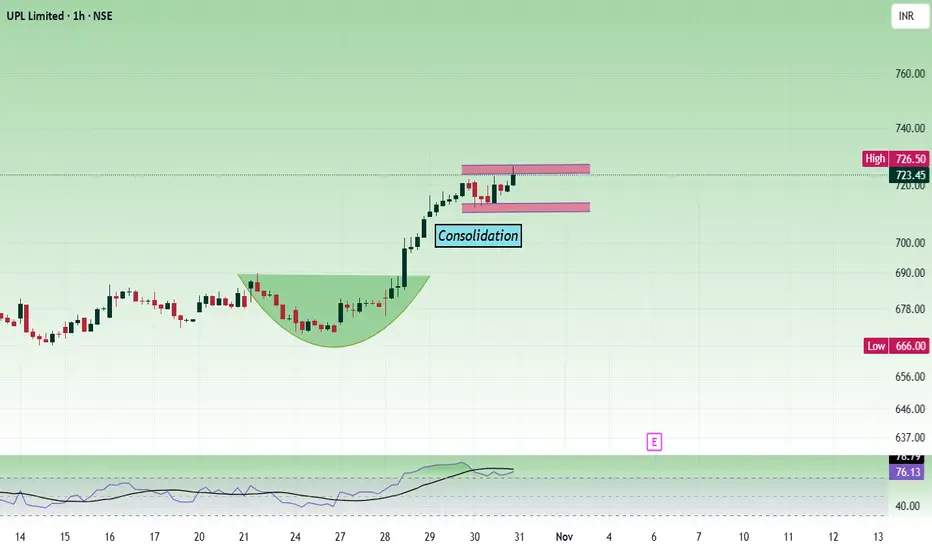
UPL - Multi time frame analysisThe price is consolidating between the range of 710 to 720. Buying levels are 710, 720, depending on your trading style. As per the daily chart, the price is giving a trend line breakout.
Buy above 715 to 718 with the stop loss of 705 for the targets 724, 736, 748 and 756.
If the price shows bearis
See all stocks ideas
Tomorrow
CDSLCentral Depository Services (India) Limited
Actual
—
Estimate
9.20
INR
Tomorrow
GHCLGHCL Limited
Actual
—
Estimate
14.40
INR
Tomorrow
AZADAzad Engineering Limited
Actual
—
Estimate
4.31
INR
Tomorrow
NETWEBNetweb Technologies India Limited
Actual
—
Estimate
5.00
INR
Tomorrow
INDRAMEDCOIndraprastha Medical Corporation Limited
Actual
—
Estimate
—
Tomorrow
ORIENTCEMOrient Cement Ltd.
Actual
—
Estimate
—
Tomorrow
TAJGVKTAJGVK Hotels & Resorts Ltd.
Actual
—
Estimate
—
Tomorrow
TATACHEMTata Chemicals Limited
Actual
—
Estimate
10.91
INR
See more events
Community trends
BTC - Buy - Price @ Support areaBTC is testing the W support area as per SMC retest. Interest Rate cut is super bullish for BTC and markets in general

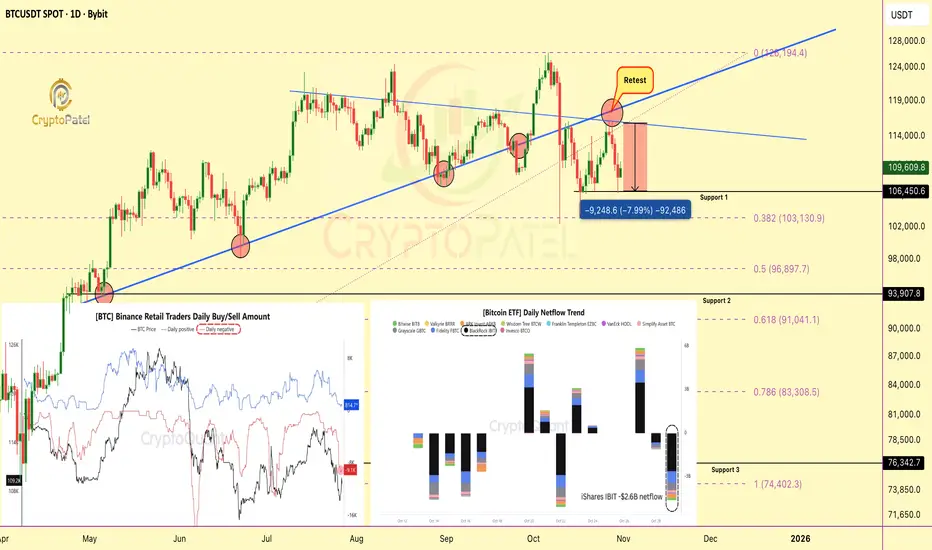
Retail Panic Meets ETF Outflows: $1B Bitcoin Sell-Off Hits MarkeRetail Panic Meets ETF Outflows: $1B Bitcoin Sell-Off Hits Markets
Bitcoin saw renewed selling pressure on Oct 30, as Binance retail traders dumped over 9,200 BTC (~$1B) around $107.7K, just days after another 12,000 BTC sell wave near $108.3K.
Technical View:
Retail traders are aggressively selli
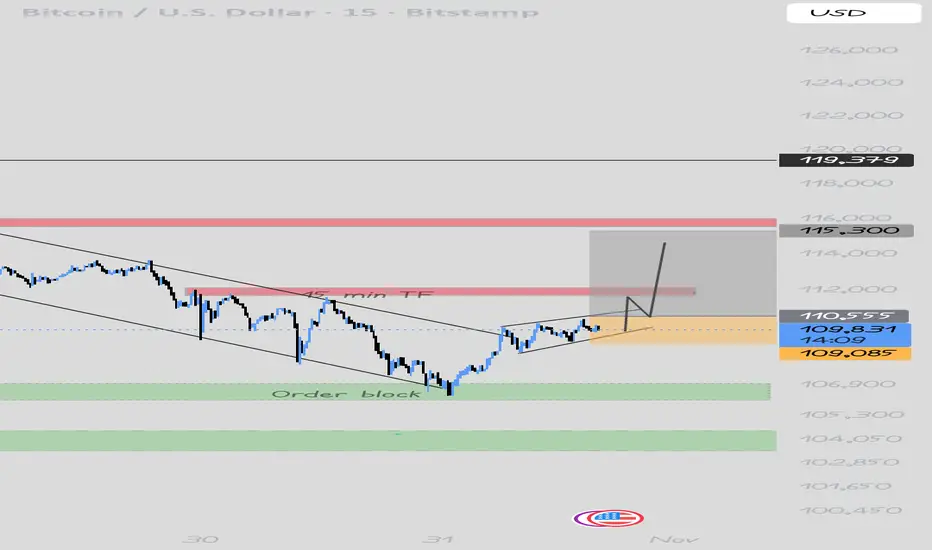
Btc current chart structure btc test the support at 106550 cBtc consolidated in 15 min TF around 110000 to 109000 and break this zone my target is 115000 previous resistance i look for
Swing according to 1 hour TF
This financial advice this is only my opinion my thoughts keep do your own anylise
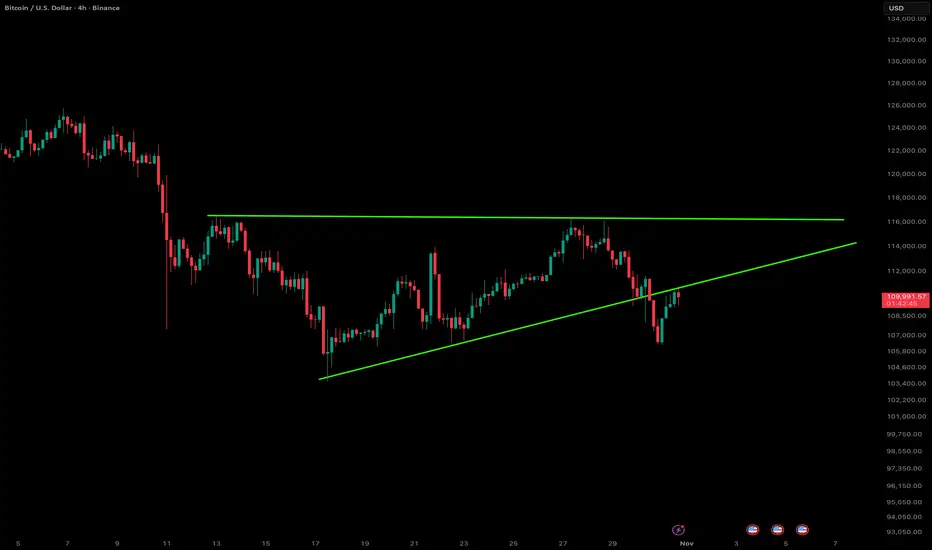
Bitcoin – Breakdown from the Ascending TriangleBitcoin just slipped below the ascending triangle support on the 4-hour chart, signaling a potential shift in short-term momentum. The structure had been forming higher lows toward the $115K resistance zone, but sellers stepped in hard near the top, breaking the trendline that’s been guiding the upt
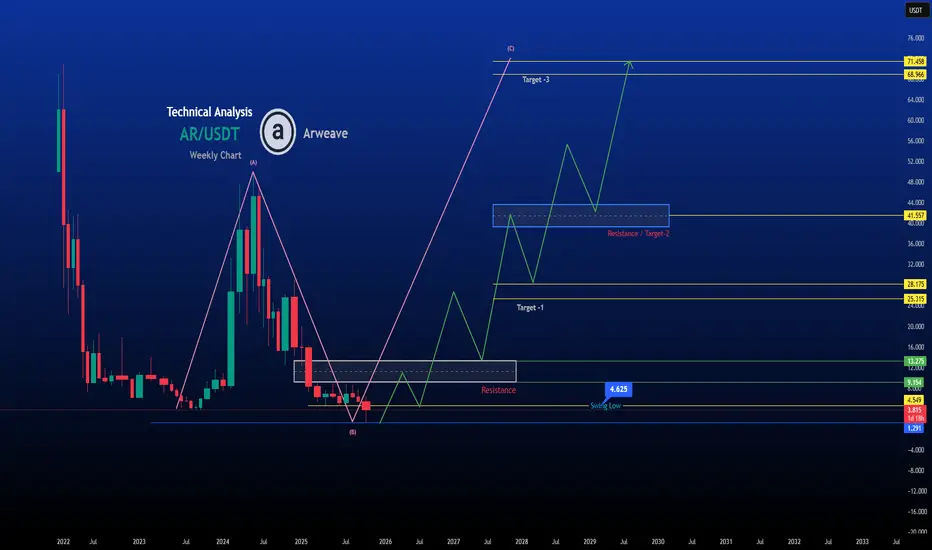
ARUSDT Technical Analysis - Monthly Time frameARUSDT Technical Analysis - Monthly Time frame
Bottom is about to hit and ready for the 'c' wave
Chart for the reference only
Disclaimer
High Risk Investment
Trading or investing in assets like crypto, equity, or commodities carries high risk and may not suit all investors.
Analysis on this
SOL/USDT (1H timeframe)...SOL/USDT (1H timeframe):
Here’s a clear technical breakdown 👇
🧭 Chart Overview:
Current price: around $200.40
Trend: Uptrend, but showing short-term pullback
Support area: $190 – $195
Resistance area: $205 – $210
🔍 Key Observations:
The ascending trendline is acting as dynamic support.
Pri


DAILY BULLISHCurrently Daily Structure looks bullish to me until we are going fail to hold the Higher Lows on the Daily time frame. Structure remains the same until we broke the HL

Solana Price Action Turns BearishSolana’s market structure shows a gradual weakening of bullish momentum after an extended upward phase earlier in the month. The asset experienced a breakout that temporarily fueled optimism among traders, but recent sessions indicate a loss of strength as sellers began to dominate. The volume profi

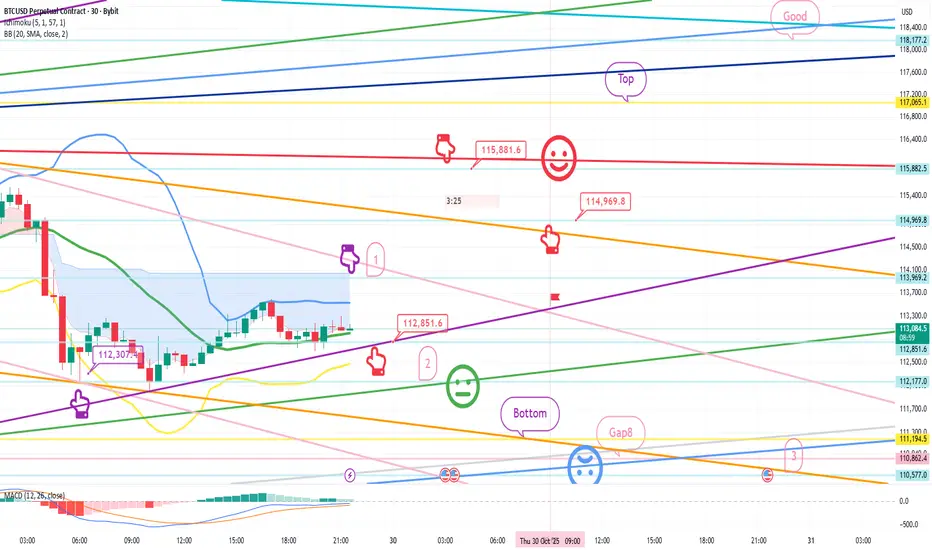
Bitcoin Bybit chart analysis October 29 (FOMC)Hello
It's a Bitcoin Guide.
If you "follow"
You can receive real-time movement paths and comment notifications on major sections.
If my analysis was helpful,
Please click the booster button at the bottom.
Here's a 30-minute Bitcoin chart.
Shortly, at 11 AM, there will be Nasdaq data releases.
See all crypto ideas
Xauusd TradePrice has just touched my entry zone and trade is active. Now staying patient and focused — will hold until it reaches the target zone. Trusting the setup, not emotions 💪✨

Gold looking bullish in 1HGold is taking support near its support zone and clearly making triangle pattern if it sustain and gave a breakout it will be great opportunity
Entry:-121700
Profit -1:- 122823
Profit -2:- 124220
Stoploss:- 120270

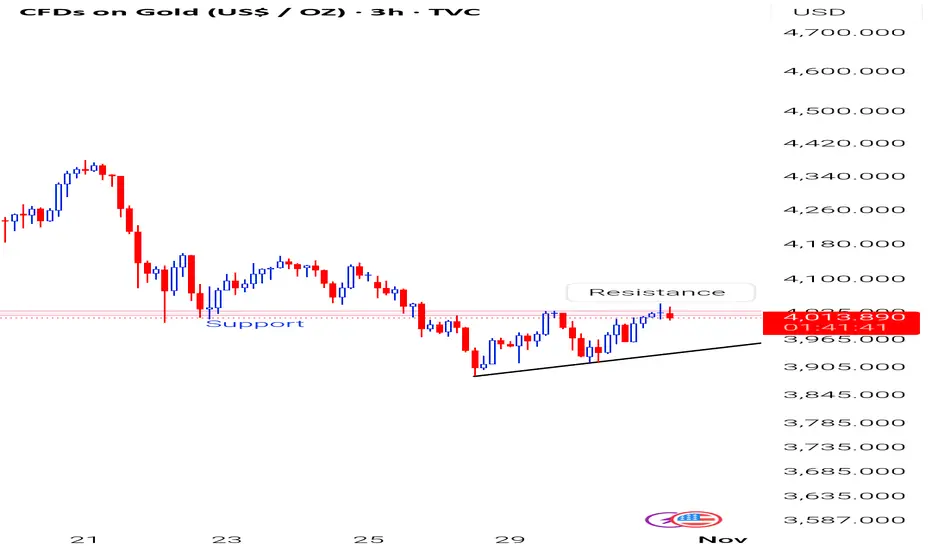
Gold Trading Strategy for 31st October 2025📈 TVC:GOLD TRADING PLAN (31 OCT 2025)
💰 BUY SETUP:
➡️ Enter GETTEX:BUY above the high of the 1-hour candle — only after candle closes above $4063
🎯 Target Levels:
1️⃣ $4073
2️⃣ $4083
3️⃣ $4095
🛡️ Stop Loss: Low of the breakout candle or as per your risk appetite
📊 Confirm with strong bullish

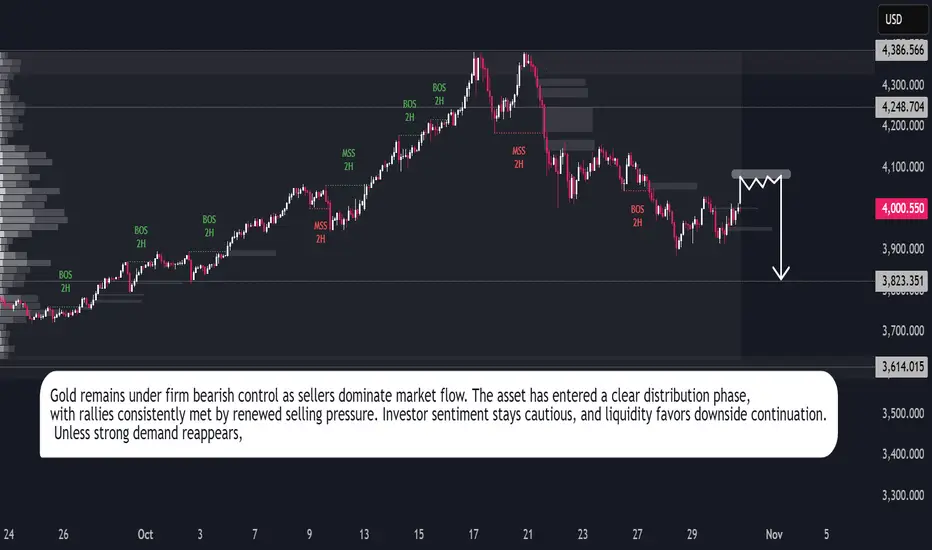
Gold Outlook: Bears Stay in ControlGold continues to operate within a bearish market environment characterized by persistent liquidation and declining momentum. The recent structural shift reflects an ongoing reallocation of capital away from defensive metals toward higher-yield instruments, signaling a broader change in market posit
#Silver | Falling Wedge + Inverse H&S = Bullish Cocktail#XAGUSD | 4H Chart
Head & Shoulders completed its breakdown target ✅
Price found support at the demand zone, formed a falling wedge breakout, and built an Inverse H&S.
Now consolidating right below the neckline, watching Immediate Resistance @48.464 👀
Above this, potential retest of key resistanc

Crude sell recommended on weekends, 5310-5270 support Crude sell rise recommended during weekends 5310-5270 support if break then more fall
How My Harmonic pattern projection Indicator work is explained below :
Recent High or Low :
D-0% is our recent low or high
Profit booking zone ( Early / Risky entry) : D 13.2% -D 16.1 % is
range if break

Gold : if fails to hold recent high 4046 then be ready for Gold taken resistance at previous support which is very crucial juncture. Expecting a sharp fall in coming day is ready .. here RR is favourable in terms of seller .
Check your set-up .
# No recommendation
XTIUSD - Analysis
Trends:
* Weekly: Strong bearish structure — lower highs from 84–86; price now inside 59–57 support area.
* Daily: Bearish continuation within 66 → 57 range; momentum still down.
* 4H/1H: Rejected from 61.0–61.3 resistance; structure confirms fresh downside move.
*LSupport & Resistance:
* *Resista

XAUUSDGold has been going down from the beginning of the week. There is possibility of retracement to the up side and take out Buy side liquidity.
Price slows down as it moves down.
Daily is closing bullish. Giving us Inside bar.
We can expect a sell side liquidity sweep and then reverse to target buy sid

Gold Futures MCX-2H — A Possible Double Zigzag at PlayThe decline from 132,294 unfolded into a clean 5-wave impulse, with Wave 3 extending 1.618 × Wave 1 and Wave 5 measuring nearly equal to Wave 1 — a classic Fibonacci rhythm confirming the completion of Wave W at 117,628.
The ongoing rebound appears corrective, unfolding as an A-B-C structure for Wa

See all futures ideas
GBP/JPY 2-hour chart...GBP/JPY 2-hour chart, here’s what I can interpret based on my markings:
Range zone (pink box): approximately 203.8 – 204.4
Resistance zone (green box): around 201.0 – 201.5
Current price: ~202.18
Ichimoku cloud: price is just breaking back toward the cloud (potential short-term bullish momentum)

EUR-USD - Pattern EUR-USD is repeating a Pattern . So in 30 Min TF it is Showing Bullish with a Target as mentioned.

EURJPY Short Idea_Elliott waveI'm considering a bearish position on the EURJPY pair, with a strict stop-loss set at 178.25. Please conduct your own research before taking any trade.

GBP/USD Correction Almost Done: Bulls LoadingGBP/USD has already completed a big corrective structure from the previous high and is now moving inside a complex W-X-Y pattern. The current drop is forming the final C-wave of Wave Y, which suggests the bearish move is close to finishing. Price is likely to dip slightly lower near the support zone

USDCAD - SELLUSDCAD SELL 🔴
Setup: P Line + SH (Capwave 1Hr)
Confirmations:
✅ 1Hr Capwave resistance
✅ Session High + Yesterday's Daily High confluence
Bias: Bearish rejection from key zone. Watching for continuation lower.

GBPJPY for next Month -> 28 OctI'm expecting the price to move higher in GJ. there might be some pull back as well but expecting a long for long term.

Buy Trade - AUD/CADGreetings to everyone!
You can place a buy trade on AUD/CAD and check out my chart for the ideal entry, stop-loss & target placement.
Remember :-
* Move your SL to breakeven once the trade reaches 1:1 R.
* Aim for a minimum reward of 1:1.5 R.
* Don't risk more than 3% of your total margin.

EURUSD 1H - LONGFX:EURUSD
Hello traders , here is the full multi time frame analysis for this pair, let me know in the comment section below if you have any questions, the entry will be taken only if all rules of the strategies will be satisfied. wait for more Smart Money to develop before taking any position

EURUSD - SELL TRADE ON 4 HR TFEURUSD – SELL Setup Loading 🚨📉
📍 Pair: EUR/USD
🕒 Timeframe: 4H | 1H | 15M
🎯 Bias: Short
---
🔍 Market Context
EURUSD has officially broken the key 4H structure level at 1.16635, confirming a bearish shift in market sentiment.
With this clean break, the next step is to wait for a proper retest be

Eur jpy going to 175 EURJPY is showing signs of weakness after tapping into a strong supply zone on the higher timeframe.
Price has broken short-term structure, suggesting that sellers may be in control for now.
If the current supply zone continues to hold, we could see a move down toward the 175.00 level, where the ne

See all forex ideas
| - | - | - | - | - | - | - | - | ||
| - | - | - | - | - | - | - | - | ||
| - | - | - | - | - | - | - | - | ||
| - | - | - | - | - | - | - | - | ||
| - | - | - | - | - | - | - | - | ||
| - | - | - | - | - | - | - | - | ||
| - | - | - | - | - | - | - | - | ||
| - | - | - | - | - | - | - | - | ||
| - | - | - | - | - | - | - | - |
Trade directly on the supercharts through our supported, fully-verified and user-reviewed brokers.


