Breakout retesting apollo HospitalBest ever result
ATH breakout & re-testing
Price should start new rally.
Price should not break the strong support of 7500
This is only for educational purpose no any trade recommendation

The best trades require research, then commitment.
Get started for free$0 forever, no credit card needed

Scott "Kidd" PoteetThe unlikely astronaut

Where the world does markets
Join 100 million traders and investors taking the future into their own hands.

SAIL : LongTrend: The stock is forming a cup and handle pattern, which is a bullish continuation setup. It has broken out above the neckline around 140 levels, showing strength. The trend has turned positive after a long consolidation phase.
Volume: There is a clear increase in volume during the breakout, whi

Bajaj Finserv: Resistance Breaks, Q2 Results Await🔍 Technical Analysis
Bajaj Finserv Limited has delivered an impressive super bullish rally since 2010, establishing itself as a blue-chip financial services stock. Multiple times since 2021, the stock faced resistance at the ₹2,000 level, which acted as a psychological and technical barrier.
Howe

Crompton | A Reversal Imminent?DISCLAIMER: This idea is NOT a trade recommendation but only my observation. Please take your trades based on your own analysis.
Points to note:
-----------------
1. RSI shows a bullish divergence with price.
2. The rejection of selling comes inside a Weekly Demand zone.
3. The high volume inside

Sobha- A breakout of consolidation is on cardsRealty sector has been performing well post Q2 results announcements.
Sobha has posted stellar Q2 numbers but it might be one off quarter as well.
Technically, stock is looking ripe for a good flag breakout of consolidation.
We might soon see a breakout coming but sustainment of breakout is crucial

Sambhv Steel Tubes cmp 121.45 by the Daily Chart since listedSambhv Steel Tubes cmp 121.45 by the Daily Chart since listed
- Support Zone 107 to 116 Price Band
- Breakout done from the Falling Price Channel
- Rising Price Channel taking upside momentum
- Volumes gradually picking up indicating continued uptrend
- Resistance Zone 125 to 135 Price Band then 1

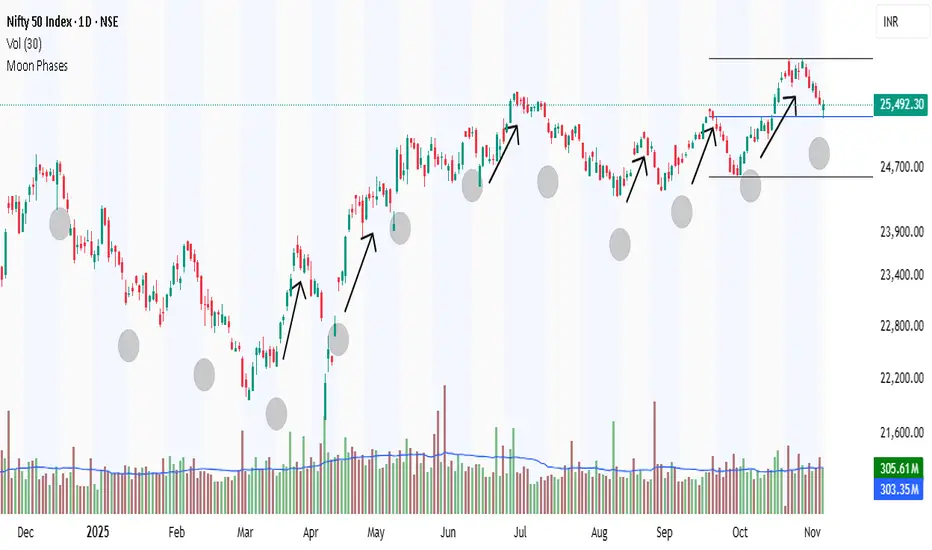
The Moon's phases are the changing mode (NIFTY)The Moon's phases are the changing shapes of the Moon's illuminated portion as seen from Earth, caused by its orbit around our planet. The Sun always lights half of the Moon, but our view of that lit half varies over a cycle lasting about 29.5 days (a synodic month). There are eight primary phases,
IDBI Bank and the Bullish Cup & Handle Pattern📈 Technical Analysis Spotlight: IDBI Bank and the Bullish Cup & Handle Pattern
In the world of technical analysis, chart patterns often serve as powerful indicators of potential price movements. One such pattern, the Cup and Handle, has recently emerged on the daily chart of IDBI Bank Limited, offer

Possible Nifty Resistance to supportMultiple bullish confluences in Nifty at current level is seen.
1. There is good resistance to support possible in Nifty nr ATH.
2. Good cup and handle pattern.
3. There is support nr weelky 20sma.
If nifty closes above Friday's high than it will trigger buy which can take nifty to 29000+ levels

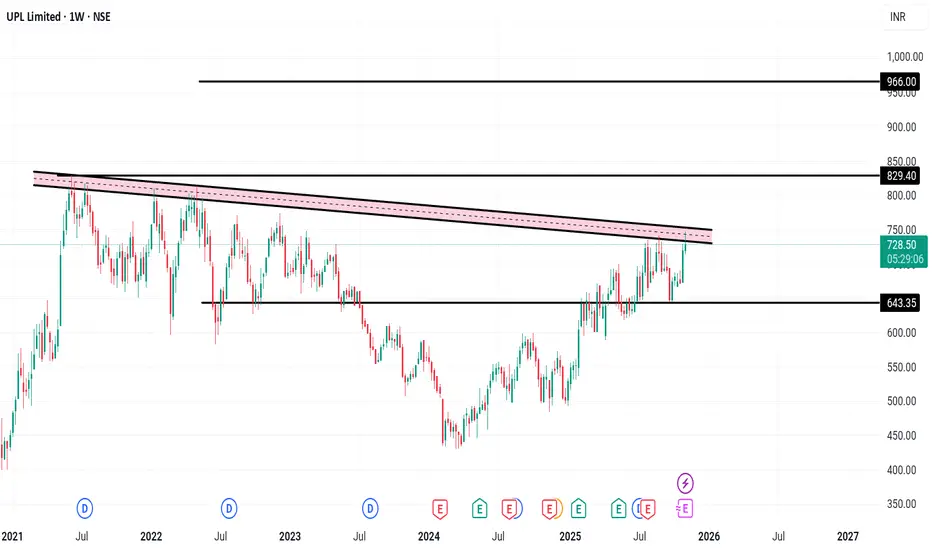
UPL Limited – Weekly Chart Analysis
📊 UPL Limited – Weekly Chart Analysis
Company Overview:
UPL Limited is a global leader in sustainable agricultural solutions, ranked among the top five agricultural solutions companies worldwide. The company operates across multiple countries, offering an integrated portfolio of patented and po
See all editors' picks ideas
PriceFormatLibrary for automatically converting price values to formatted strings
matching the same format that TradingView uses to display open/high/low/close prices on the chart.
█ OVERVIEW
This library is intended for Pine Coders who are authors of scripts that display numbers onto a user's charts. T

LogNormalLibrary "LogNormal"
A collection of functions used to model skewed distributions as log-normal.
Prices are commonly modeled using log-normal distributions (ie. Black-Scholes) because they exhibit multiplicative changes with long tails; skewed exponential growth and high variance. This approach i

Range Oscillator (Zeiierman)█ Overview
Range Oscillator (Zeiierman) is a dynamic market oscillator designed to visualize how far the price is trading relative to its equilibrium range. Instead of relying on traditional overbought/oversold thresholds, it uses adaptive range detection and heatmap coloring to reveal where pri

Volume Surprise [LuxAlgo]The Volume Surprise tool displays the trading volume alongside the expected volume at that time, allowing users to spot unexpected trading activity on the chart easily.
The tool includes an extrapolation of the estimated volume for future periods, allowing forecasting future trading activity.
🔶 U

Smooth Theil-SenI wanted to build a Theil-Sen estimator that could run on more than one bar and produce smoother output than the standard implementation. Theil-Sen regression is a non-parametric method that calculates the median slope between all pairs of points in your dataset, which makes it extremely robust to o

Fair Value Gaps by DGTFair Value Gaps
A refined, multi-timeframe Fair Value Gap (FVG) detection tool that brings institutional imbalance zones to life directly on your chart.
Designed for precision, it visualizes how price delivers into inefficiencies across chart, higher, and lower (intrabar) timeframes — offering a fl

TASC 2025.11 The Points and Line Chart█ OVERVIEW
This script implements the Points and Line Chart described by Mohamed Ashraf Mahfouz and Mohamed Meregy in the November 2025 edition of the TASC Traders' Tips , "Efficient Display of Irregular Time Series”. This novel chart type interprets regular time series chart data to create an ir

Simplified Percentile ClusteringSimplified Percentile Clustering (SPC) is a clustering system for trend regime analysis.
Instead of relying on heavy iterative algorithms such as k-means, SPC takes a deterministic approach: it uses percentiles and running averages to form cluster centers directly from the data, producing smoo

Adaptive Volume Delta Map---
📊 Adaptive Volume Delta Map (AVDM)
What is Adaptive Volume Delta Map (AVDM)?
The Adaptive Volume Delta Map (AVDM) is a smart, multi-timeframe indicator that visualizes buy and sell volume imbalances directly on the chart.
It adapts automatically to the best available data resolution

Dynamic Equity Allocation Model"Cash is Trash"? Not Always. Here's Why Science Beats Guesswork.
Every retail trader knows the frustration: you draw support and resistance lines, you spot patterns, you follow market gurus on social media—and still, when the next bear market hits, your portfolio bleeds red. Meanwhile, institution

See all indicators and strategies
Community trends
NIITMTS well posied technically and fundamentally for quick upmoFollow the "Smart Money" : Domestic Institutional Investors (DIIs) and Mutual Funds significantly increased their stake in the most recent quarter (adding +1.58%).
The "Smart Money" Divergence : This accumulation happened while retail/"public" investors sold off their holdings (-1.38%). This is

Breakout retesting apollo HospitalBest ever result
ATH breakout & re-testing
Price should start new rally.
Price should not break the strong support of 7500
This is only for educational purpose no any trade recommendation
FINCABLES 1 Day View 📌 Current Price Snapshot
Latest close around ₹ 785.40.
Day’s trading range: roughly ₹ 784 – ₹ 793.95.
52-week range: low ~ ₹ 779.80, high ~ ₹ 1,342.75.
🧭 Key Technical Levels to Watch
Support zone: ~ ₹ 780–790 — price is near its 52-week low and this band may act as immediate support.
Resist

SAIL : LongTrend: The stock is forming a cup and handle pattern, which is a bullish continuation setup. It has broken out above the neckline around 140 levels, showing strength. The trend has turned positive after a long consolidation phase.
Volume: There is a clear increase in volume during the breakout, whi
HARUN STOCKS – NIFTY VIEW (10/11/2025 – 12:00 NOON IST)HARUN STOCKS – NIFTY VIEW (10/11/2025 – 12:00 NOON IST)
Hello friends,
Here is my latest observation on the Nifty Spot Index based on Elliott Wave Theory, which I have been practicing in the Indian markets since 2001.
Currently, Nifty Spot is trading around 25,645. On the weekly chart, Nifty appe

Bajaj Finserv: Resistance Breaks, Q2 Results Await🔍 Technical Analysis
Bajaj Finserv Limited has delivered an impressive super bullish rally since 2010, establishing itself as a blue-chip financial services stock. Multiple times since 2021, the stock faced resistance at the ₹2,000 level, which acted as a psychological and technical barrier.
Howe
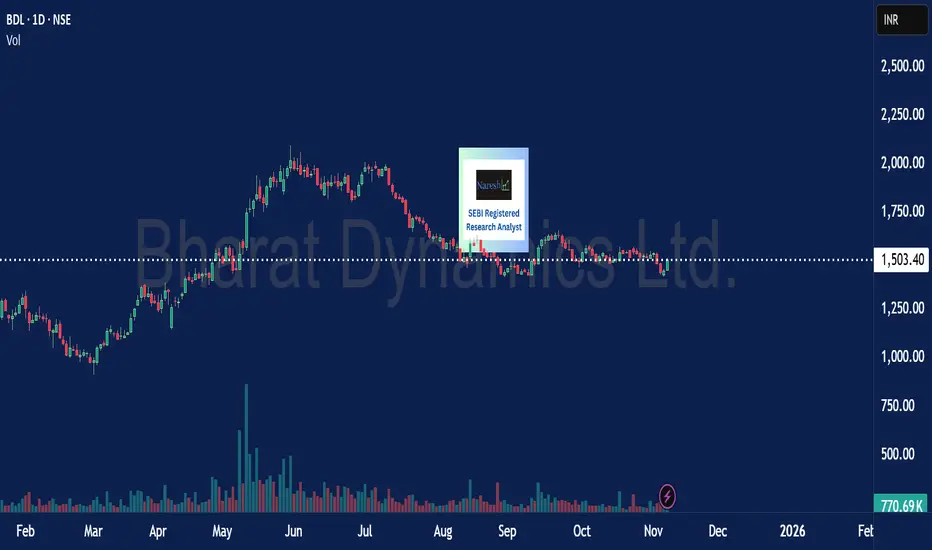
BDL - Purely Cash Positional Trade >> Options Not AdvisedBDL
CMP 1507
Buy on dips till 1400
SL CLB 1370
Expected Tgts
1600-1700-1800 & More
Hint : Sustain above 1525 > it might move up fast
⚠️ Note: Stick to levels, follow discipline & use TSL (Trailing Stop Loss) once target starts approaching.
Let’s stay hopeful that the move continues as per our e
Jio Financial Breakout Watch –Wedge Setup Points to ₹356+ TargetJio Financial Services is currently presenting an exciting opportunity on the charts, with a wedge breakout setup forming after months of consolidation. A wedge is a bullish pattern that typically signals a reversal or continuation of an uptrend, especially when supported by rising volumes and stron
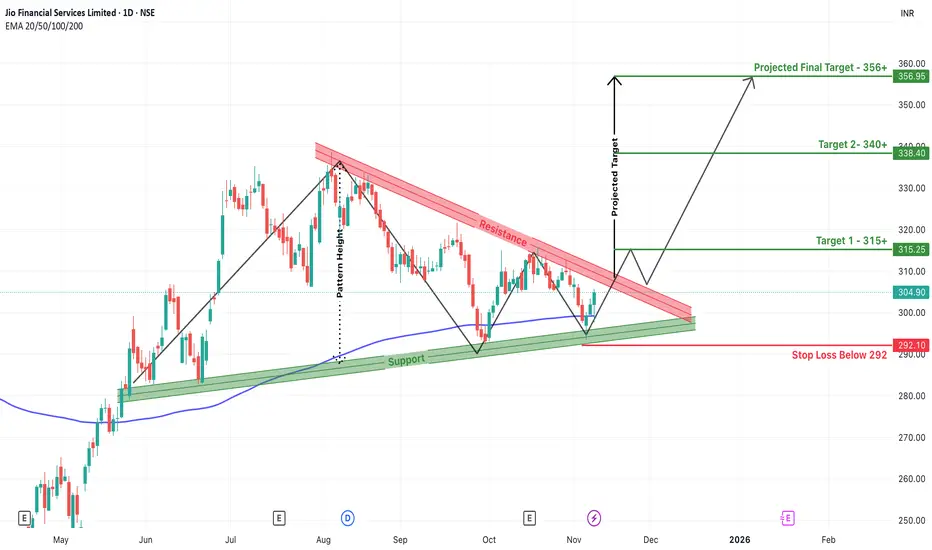
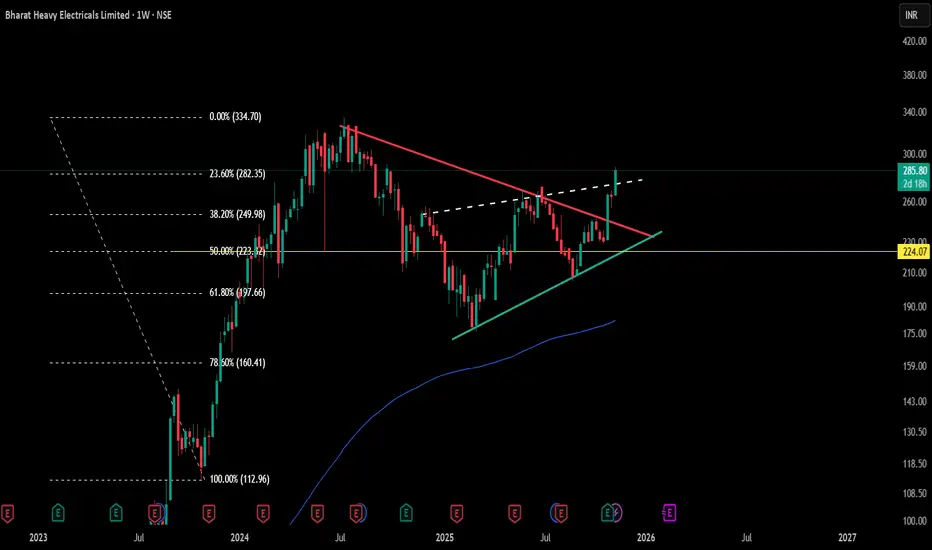
Symmetrical Triangle Structure & Key EquilibriumEditorial Insights
- Symmetrical triangles signal a balanced tug-of-war between buyers and sellers; this compression, as mapped here, often precedes significant expansions in volume and volatility.
- The triangular structure’s edges—CT (red) and trendline (green)—have been tested repeatedly over mo
Crompton | A Reversal Imminent?DISCLAIMER: This idea is NOT a trade recommendation but only my observation. Please take your trades based on your own analysis.
Points to note:
-----------------
1. RSI shows a bullish divergence with price.
2. The rejection of selling comes inside a Weekly Demand zone.
3. The high volume inside
See all stocks ideas
Today
COCHINSHIPCochin Shipyard Limited
Actual
—
Estimate
—
Today
ACIArchean Chemical Industries Ltd.
Actual
—
Estimate
4.05
INR
Today
ASAHISONGAsahi Songwon Colors Ltd.
Actual
—
Estimate
—
Today
UFBLUnited Foodbrands Limited
Actual
—
Estimate
—
Today
PURETROPPuretrop Fruits Ltd
Actual
—
Estimate
—
Today
ERISEris Lifesciences Ltd
Actual
—
Estimate
9.00
INR
Today
AGVENTURESAG Ventures Limited
Actual
—
Estimate
—
Today
MANGCHEFERMangalore Chemicals & Fertilizers Ltd.
Actual
—
Estimate
—
See more events
Community trends
DOTUSDT_Short Elliot WaveI'm anticipating DOT to move toward the $3 level, so a potential short position could be considered around $3.30. Make sure to do your own research before taking any trade.


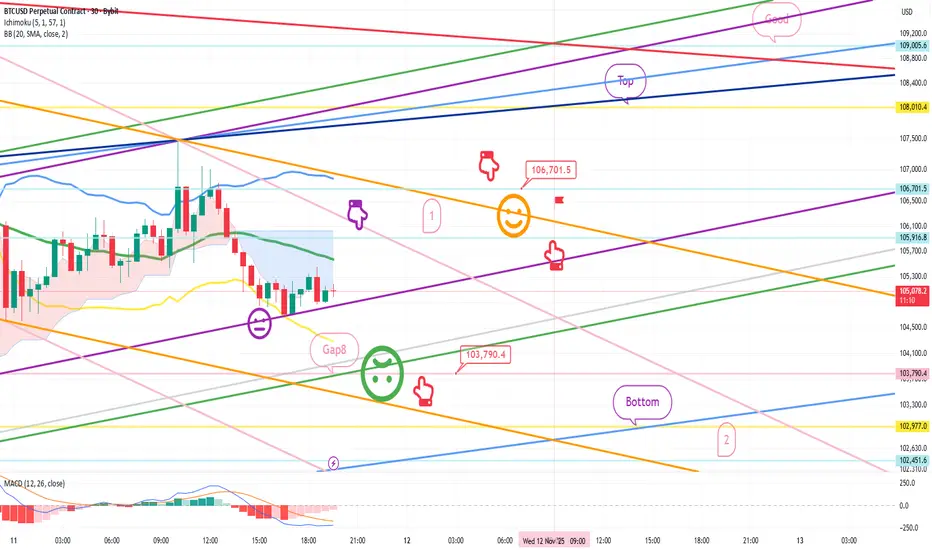
Bitcoin Bybit chart analysis November 11Hello
It's a Bitcoin Guide.
If you "follow"
You can receive real-time movement paths and comment notifications on major sections.
If my analysis was helpful,
Please click the booster button at the bottom.
This is a Bitcoin 30-minute chart.
There are no separate Nasdaq indicators.
I developed a
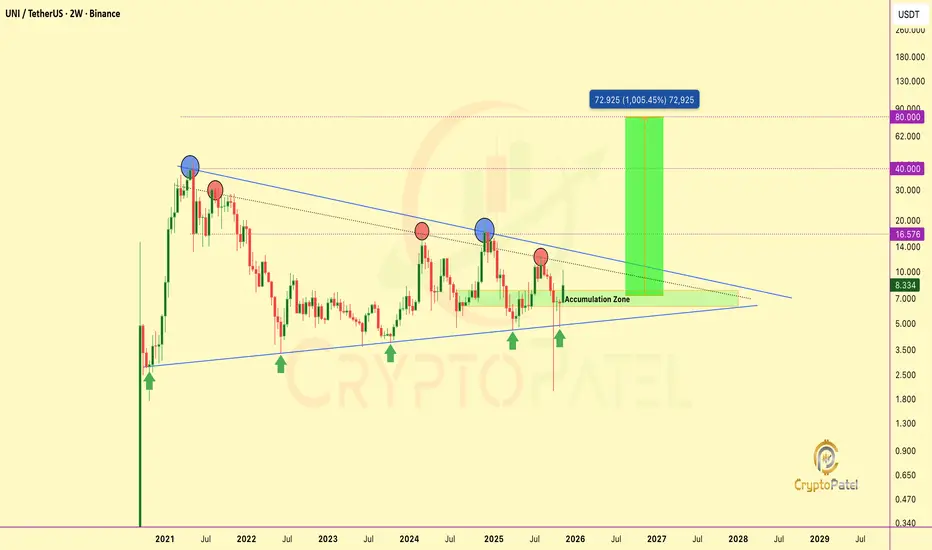
$UNI TA + FA align: Breakout loading toward $80CRYPTOCAP:UNI TA + FA align: Breakout loading toward $80
#UNI is coiling inside a multi-year descending triangle, with strong accumulation at $6–$7.
A breakout above $9–$10 could confirm a macro trend reversal toward $16.5 → $40 → $72+
Catalyst: Uniswap CEO Hayden Adams proposes turning on proto
BTCUSDBitcoin is in a downtrend.
Currently falling off the supply zone, @106 lvl.
Will be monitoring closely the demand, other then that first low is logical target.

BTC/USDT Timeframe (4-hour)BTC/USDT Timeframe (4-hour)
Current price: ≈ $105,845
My drawn:
A descending trendline (showing previous resistance)
Ichimoku Cloud, and
Two target points marked with green arrows.
---
🔍 Chart Interpretation
From my image:
Price has broken above the descending trendline.
It’s also movin

BTCUSDT SHORT I was sitting in Short after a good bearish candle formed at resistance with very good volume, i just took 1:2 and i was out of the trade.
Logic :- Price was too stretched and bears were gaining control, bulls were trapped
But still the trend is bullish for me, lets see 🚀
Happy profits 🥂 enjoy gu

Fair Value Gap Retracements in a Downtrend📈 BTC/USD – Understanding Fair Value Gap Retracements in a Downtrend
The current market structure on the daily timeframe highlights a clear bearish trend, where price continues to form lower highs and lower lows.
After a strong downward impulse, a Fair Value Gap (FVG) has formed — representing an

BTC/USD Bullish Pennant – Breakout Entry SetupBTC/USD Bullish Pe✅ BTC/USD Pennant Breakout – Technical Analysis
Chart Breakdown
The chart shows Bitcoin forming a bullish pennant pattern on the 45-min timeframe.
A pennant typically forms after a strong impulsive move (pole), followed by price compression between:
Descending trendline (upper)
Ascending/flat tre

ETHUSD SHOWING A GOOD UP MOVE WITH 1:10 RISK REWARDETHUSD SHOWING A GOOD
UP MOVE WITH 1:10 RISK REWARD
DUE TO THESE REASON
A. its following a rectangle pattern that stocked the market
which preventing the market to move any one direction now it trying to break the strong resistant lable
B. after the break of this rectangle it will boost the marke

See all crypto ideas
Gold Skyrockets: Over $100 Gain in a Day!Hey traders, great to see you back! Let’s dive into what’s happening with XAUUSD today.
Gold just delivered an explosive move — closing the U.S. session early this morning around $4,115/oz, up a massive $116 from the previous day. That’s the strongest performance in the past two weeks, signaling re

WILL GOLD CONTINUE TO RISE?I. BASIC CONTEXT
On November 10, 2025, gold prices surged after the market reacted positively to news of the U.S. government reopening.
The current market sentiment expects the FED to cut interest rates soon as recent economic data indicates a weakening U.S. economy.
Lower interest rates mean chea

Gold long trade Gold has breakout from inverted triangle after correcting from ath of 4282 amd consolidating between 3900-4030 for a nearby target of 4130-4140.
Further buy or sell decisions will b made after I touches these levels

WTI Crude Oil 4H Analysis | Potential Long SetupAfter a prolonged downtrend inside a descending channel, Crude Oil has broken out and is now consolidating near the 0.5 Fibonacci retracement level.
🔹 Buying Zone 1: 59.30 – 58.80
🔹 Buying Zone 2: 57.40 – 56.70
🔹 Stop Loss (SL): Below 55.90
🔹 Target (TGT): 66.40
Technical Outlook:
The price is re

Gold Retests FVG Preparing for a New Uptrend, Target 4,120 USD📊 Market Structure
Gold has officially broken the bearish structure (BoS + ChoCH) by surpassing the 4,025 USD zone, confirming a significant shift in market momentum.
Following a series of consecutive BoS and a break of the downtrend line, the price is entering a balanced retest phase (FVG 4,03

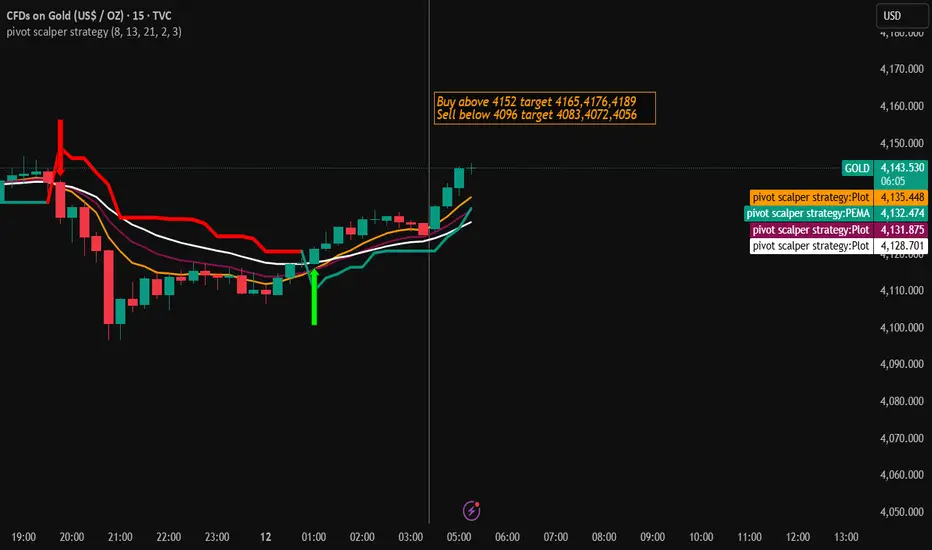
Gold Trading Strategy for 12th November 2025🪙 GOLD Trading Setup (Intraday Strategy)
📈 Buy Setup (Bullish Scenario)
👉 Condition to Enter Buy:
Wait for the 1-hour candle to close above $4152.
This confirms bullish momentum (buyers are taking control).
🎯 Targets after Buy Entry:
Target 1: $4165
Target 2: $4176
Target 3: $4189
🛑 Stop Loss (SL)
XAUUSD – PRIORITISE BUYING ON TUESDAY💛 XAUUSD – PRIORITISE BUYING ON TUESDAY 🎯
🌤 Overview
Hello everyone 💬
Gold continues its upward momentum in the first two days of the week, supported by the cash distribution policy for low-income individuals and the reopening moves by the US government under President Trump.
These factors are pu

StevenTrading – XAUUSD from an Elliott Perspective | Stick to...⚡️ StevenTrading – XAUUSD from an Elliott Perspective | Stick to the trend, wait for precise retest
Hello Trader 👋
📰 Fundamental Analysis
The White House has indicated that the October CPI may not be released on time due to the shutdown impact; a series of data (NFP, CPI 10–11) remains uncertain

XAUUSD Tape readingwaiting for a correction and a sign of continuation on htf , then i will start looking for longs

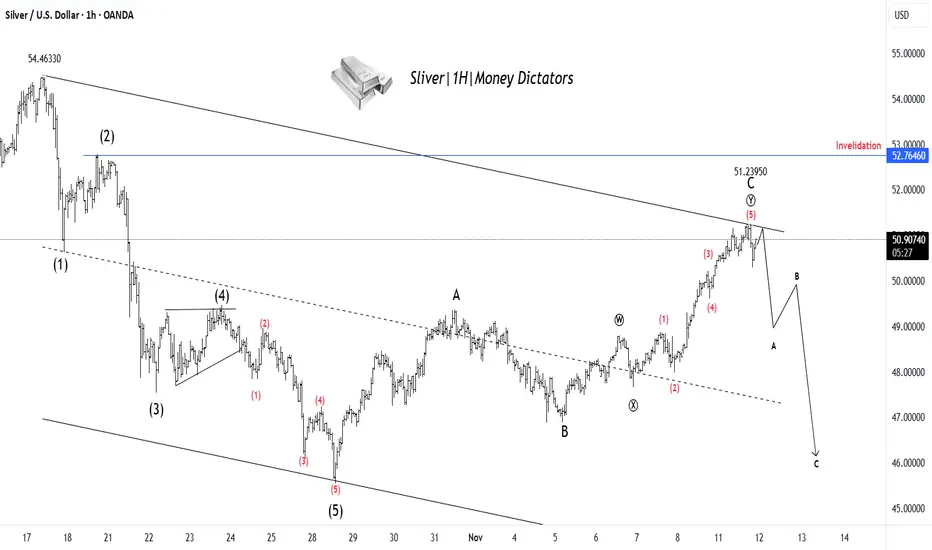
XAG/USD Set for Decline After Finishing Wave YSilver has completed a clear 5-wave upward move, ending near the 51.23 zone, which likely marks the completion of Wave C of the corrective structure. Price action shows rejection from the upper trendline, signaling that buying momentum is fading. This suggests the start of a new A–B–C corrective dec
See all futures ideas
EURUSD LONG my entry @ 1.15570
Stop: 1.15416 (days low)
Target: 1.16042 ( pdh and a little higher)
I’m aware price may dip deeper and potentially take out today’s low before pushing higher, but this setup fits my plan. My target is the previous day’s high and slightly above. Executing the trade and letting it

EURUSD — Is the Euro Ready for a Comeback?Hey — what do you think, will EURUSD rise or keep sliding lower?
Right now, the pair is hovering around 1.1566, still holding a medium-term downtrend as the U.S. Dollar gains strength after Bloomberg reported that the record U.S. government shutdown might finally be ending.
On the D1 chart, we can

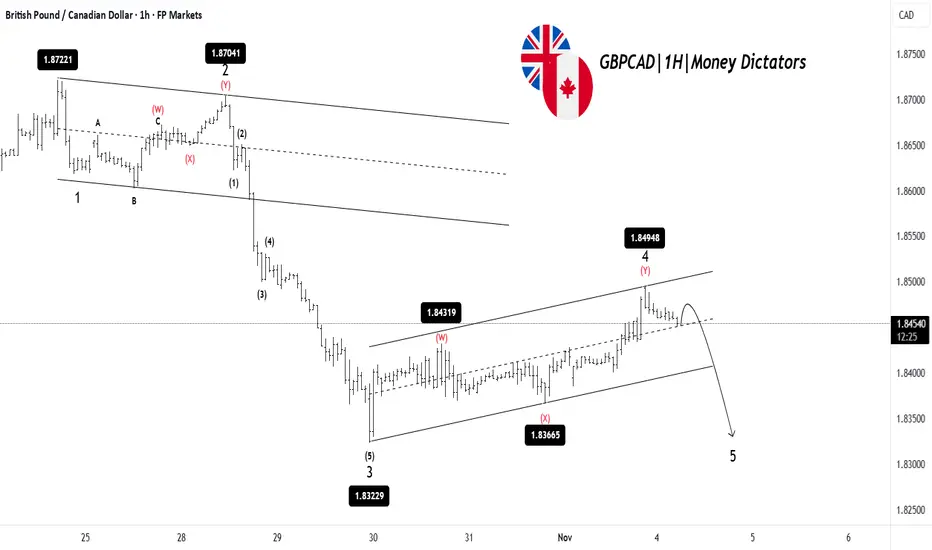
GBPCAD: Bears Ready to Push Into Wave 5GBPCAD has completed a clear 1-2-3 move to the downside, followed by a corrective Wave 4 that has pushed the price higher inside a rising channel. This correction now looks nearly complete, as the price is struggling to break above the resistance. Once Wave 4 is finished, the chart suggests a final
Trade Journal 4th trade -:10/11/25 - GBP SellWassup Lads!
So this was a trade I took which I exited at B.E., it was a risky sell - basically a counter trade in a bullish orderflow. I took it but exited it on a small profit because I was not feeling confident.
Anyway talking about the trade, this was totally a time based setup -
The reason for

AUDNZD - OVERBOUGHT CONDITIONS HINTING AT A POSSIBLE REVERSALSymbol - AUDNZD
CMP - 1.1485
AUDNZD continues to maintain its upward trajectory, supported by fundamental divergence between the two economies. The Australian dollar remains resilient and continues to outperform the New Zealand dollar after the RBNZ implemented an aggressive 50 basis point rate cu

USD-JPY is in a Bullish PatternUSD-JPY is about to Break the Pattern . In 30 Min TF it is Trading in in a FLAT-TOP pattern and also it shows a Flag & Pole pattern and Both are Bullish Patterns . This type of pattern may give the Breakout on either side.

EURAUDBuys are valid on EA,
Structure is bullis and price mitigated the demand zone.
Let's see if buyers will step in once again.

USDJPY SHORTseeking shorts on USDJPY since HTF is swept and a new choch has been created.
higher time frame triggered the entry too.
study the charts for demands below.


Eurchf bearish /SHORT
---
📉 EUR/CHF – Momentum shifts & premium short bias
The pair is showing renewed dominance of aggressive sellers, enabling a breach of key support range — buyers’ interest remains muted. Coupled with reduced inflation in Switzerland and a lowered fair-value estimate from UBS, the bias tilts decisi

See all forex ideas
| - | - | - | - | - | - | - | - | ||
| - | - | - | - | - | - | - | - | ||
| - | - | - | - | - | - | - | - | ||
| - | - | - | - | - | - | - | - | ||
| - | - | - | - | - | - | - | - | ||
| - | - | - | - | - | - | - | - | ||
| - | - | - | - | - | - | - | - | ||
| - | - | - | - | - | - | - | - | ||
| - | - | - | - | - | - | - | - |
Trade directly on the supercharts through our supported, fully-verified and user-reviewed brokers.


