Domestic Equity Market TrendsIntroduction
The domestic equity market, often considered the barometer of a nation’s economic health, has witnessed dynamic shifts over the years. Characterized by fluctuations in stock prices, trading volumes, investor sentiment, and corporate performance, these markets reflect both macroeconomic trends and microeconomic realities. Understanding domestic equity market trends is essential not only for investors and traders but also for policymakers, financial analysts, and the broader business community.
Equity markets are influenced by a variety of factors including economic policies, global financial conditions, corporate earnings, technological advancements, and investor behavior. Domestic markets serve as platforms for capital formation, wealth creation, and efficient allocation of resources, contributing significantly to overall economic development.
This detailed analysis explores the evolution of domestic equity markets, identifies prevailing trends, examines sectoral movements, evaluates regulatory and policy impacts, and assesses investor behavior in shaping market trajectories.
1. Evolution of Domestic Equity Markets
1.1 Early Development
Domestic equity markets have evolved over decades, starting from informal trading practices to highly regulated, technologically advanced platforms. In the early stages, equity trading was largely manual, with transactions recorded on paper and executed in physical trading floors. Investor participation was limited to a select group of institutional and high-net-worth investors, and the market was relatively illiquid.
1.2 Modernization and Technological Integration
The introduction of electronic trading platforms revolutionized domestic equity markets. Real-time order matching, automated clearing, and electronic settlement have increased transparency, reduced transaction costs, and expanded participation. Technology has also enabled retail investors to access the market through online brokerage platforms and mobile trading applications, democratizing market participation.
1.3 Regulatory Reforms
Over the years, regulatory reforms have strengthened market integrity. Key initiatives include:
Implementation of investor protection mechanisms.
Stringent disclosure requirements for listed companies.
Risk management frameworks to safeguard against market manipulation.
Corporate governance reforms promoting transparency and accountability.
These measures have enhanced investor confidence and encouraged broader participation in the equity markets.
2. Key Drivers of Domestic Equity Market Trends
Domestic equity markets are influenced by a combination of macroeconomic, microeconomic, and geopolitical factors. Understanding these drivers is crucial for analyzing market behavior.
2.1 Economic Indicators
Economic performance, measured through GDP growth, inflation, employment rates, and industrial production, directly affects equity market trends. For instance, robust economic growth typically boosts corporate earnings, which in turn drives stock prices higher. Conversely, economic slowdowns or recessions often lead to market corrections.
2.2 Corporate Earnings
Corporate profitability is a primary determinant of stock prices. Companies reporting strong earnings growth attract investor interest, driving demand and prices up. Conversely, declining earnings or profit warnings can trigger sell-offs. Sectoral earnings also play a role, as some industries outperform others during different economic cycles.
2.3 Monetary Policy
Central banks influence equity markets through interest rate adjustments and liquidity management. Lower interest rates make equity investments more attractive relative to fixed-income securities, often boosting market performance. Conversely, rising rates can dampen equity valuations.
2.4 Fiscal Policy
Government spending, taxation, and policy measures impact corporate profitability and investor sentiment. Expansionary fiscal policies can stimulate growth and market optimism, while contractionary measures may lead to caution or sell-offs.
2.5 Global Market Conditions
Domestic markets are not isolated from global trends. Foreign institutional investments, geopolitical tensions, global commodity prices, and currency fluctuations influence domestic equity performance. Integration with global markets means domestic indices often mirror global sentiments to some extent.
3. Current Domestic Equity Market Trends
3.1 Market Valuation Trends
Over the past few years, domestic equity markets have experienced significant valuation shifts. Key observations include:
Bullish Phases: Periods of strong economic growth, low-interest rates, and corporate earnings growth have fueled bullish markets.
Correction Phases: Market corrections have occurred due to economic slowdowns, geopolitical uncertainties, or rising interest rates.
Sector Rotation: Investors often shift funds between sectors depending on prevailing macroeconomic conditions, leading to sector-specific performance trends.
3.2 Sectoral Trends
Equity markets often exhibit sectoral trends, influenced by industry-specific developments and investor preferences. Current sectoral trends include:
Technology & IT Services: Continues to benefit from digital transformation and global outsourcing demands.
Banking & Financial Services: Driven by credit growth, asset quality improvements, and fintech adoption.
Pharmaceuticals & Healthcare: Gaining attention due to rising health awareness and government initiatives.
Consumer Goods & Retail: Sensitive to consumption patterns, inflation, and changing consumer preferences.
Energy & Infrastructure: Influenced by commodity prices, government spending, and renewable energy transitions.
3.3 Retail Participation
Retail investors have increasingly contributed to domestic equity market volumes. The rise of mobile trading apps, online brokerage platforms, and investment awareness campaigns has led to higher retail engagement, which can amplify market trends during bullish or bearish phases.
3.4 Institutional Investment Patterns
Domestic and foreign institutional investors play a significant role in shaping market trends. Their investment decisions, often based on research, macroeconomic analysis, and portfolio strategies, can create momentum in specific sectors or indices.
4. Technological and Trading Innovations
4.1 Algorithmic and High-Frequency Trading
The introduction of algorithmic and high-frequency trading has transformed equity market dynamics. These technologies execute trades at high speeds, exploiting short-term market inefficiencies. While they increase liquidity, they also contribute to heightened volatility during market stress.
4.2 Data Analytics and AI
Advanced data analytics and artificial intelligence are increasingly used by traders and analysts to predict market trends, assess risk, and optimize portfolios. Machine learning models analyze historical and real-time data to identify trading opportunities.
4.3 Mobile and Online Trading Platforms
The proliferation of mobile trading platforms has empowered retail investors to participate in real-time trading. Features such as instant order execution, portfolio tracking, and market alerts have enhanced retail engagement.
5. Market Volatility and Risk Factors
Domestic equity markets are inherently volatile, influenced by multiple risk factors:
Macroeconomic Shocks: Sudden changes in interest rates, inflation, or GDP growth can trigger market swings.
Corporate Performance Risks: Poor earnings, mismanagement, or governance issues impact stock prices.
Global Uncertainties: Geopolitical tensions, trade wars, or global financial crises can affect domestic markets.
Liquidity Risks: Market liquidity can fluctuate, especially in mid-cap and small-cap stocks, amplifying price movements.
Behavioral Factors: Investor sentiment, herd behavior, and market psychology play critical roles in short-term volatility.
6. Challenges in Domestic Equity Markets
Despite modernization and growth, domestic equity markets face several challenges:
Market Volatility: High volatility can discourage long-term investment.
Corporate Governance Issues: Instances of fraud or mismanagement can erode investor trust.
Market Inequality: Small and mid-cap companies may face liquidity constraints compared to large-cap firms.
Information Asymmetry: Retail investors often lack access to sophisticated research and analysis tools.
Regulatory Compliance: Frequent changes in rules may create compliance challenges for market participants.
7. Opportunities for Investors
Domestic equity markets offer diverse opportunities for investors:
Long-term Wealth Creation: Equity markets remain one of the most effective avenues for long-term capital appreciation.
Sectoral Diversification: Investors can exploit sectoral trends and thematic opportunities.
Derivative Instruments: Futures and options allow hedging, speculation, and risk management.
IPO Participation: Investing in new listings can provide early-stage growth opportunities.
Technology-driven Investments: Online platforms and AI-driven advisory services enhance decision-making.
8.Conclusion
Domestic equity markets are complex, dynamic, and multifaceted, reflecting a nation’s economic health and investor sentiment. Over the years, technological innovation, regulatory reforms, and increased retail participation have enhanced market efficiency and accessibility. Trends such as sectoral shifts, ESG investing, and global integration are shaping the future of domestic markets.
Investors, regulators, and corporate entities must navigate this landscape with strategic foresight, continuous learning, and risk awareness. By understanding macroeconomic drivers, corporate performance patterns, and behavioral influences, stakeholders can leverage opportunities and mitigate challenges in domestic equity markets.
The continued evolution of domestic equity markets presents both opportunities and responsibilities. A well-informed approach, combined with regulatory oversight and technological adoption, ensures that equity markets remain robust, transparent, and a critical engine for economic growth.
Community ideas

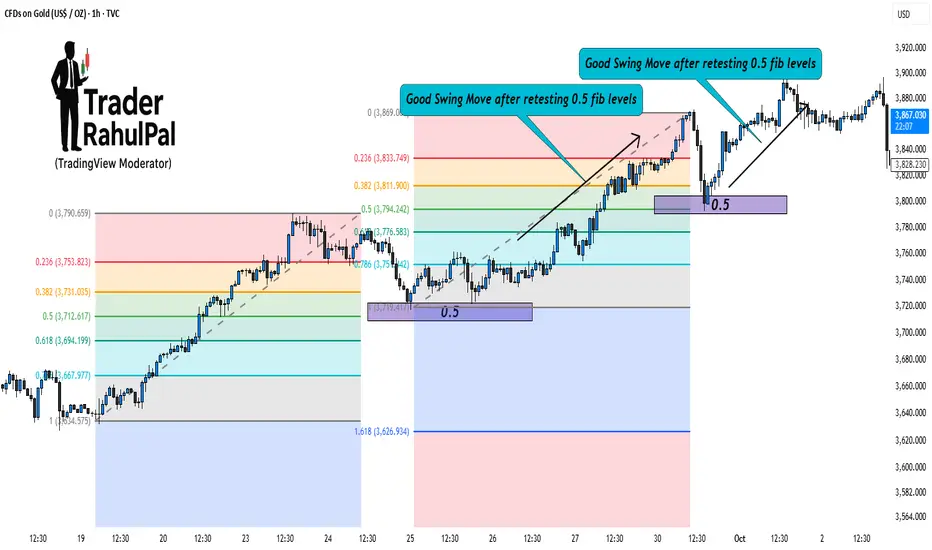
1 of the best Gold Swing Trading Strategy with Fibonacci Levels!Hello Traders!
Gold (XAU/USD) is a perfect instrument for swing trading because of its clean technical reactions.
One of the most reliable tools to trade gold swings is the Fibonacci retracement .
When used correctly, it helps you catch pullbacks and ride the next wave in the trend. Let’s break it down step by step.
1. Identify the Swing Move
First, find a strong impulse move on gold, either bullish or bearish.
This becomes your “anchor move” for drawing Fibonacci levels.
The idea is to wait for price to retrace part of this move before continuing in the main direction.
2. Draw Fibonacci Levels
Take the swing low to swing high (for bullish) or swing high to swing low (for bearish).
Mark key retracement levels: 38.2%, 50%, and 61.8% .
These levels often act as strong support or resistance zones for gold.
3. Look for Confirmation
Don’t trade blindly at a Fib level. Wait for confirmation like reversal candlesticks (pin bars, engulfing) or RSI divergence.
Volume spikes near Fibonacci zones also confirm institutional buying/selling.
4. Entry & Risk Management
Enter trades near 38.2%, 50%, or 61.8% retracements when confirmation appears.
Place stop loss just beyond the next Fibonacci level.
Set targets at previous swing highs/lows or Fibonacci extension levels like 127% and 161.8%.
5. Why It Works Well on Gold
Gold respects technical levels strongly due to high liquidity.
Institutions also use Fibonacci retracements to scale in and out of positions.
This makes Fibonacci one of the most effective tools for swing traders in gold.
Rahul’s Tip:
Always combine Fibonacci with structure. If a Fib level aligns with a key support/resistance, that zone becomes even stronger.
Conclusion:
Swing trading gold with Fibonacci retracements is simple yet powerful.
By focusing on impulse moves, waiting for retracements, and confirming with price action, you can trade gold with more confidence and less guesswork.
If this post gave you a clear strategy, like it, share your thoughts in comments, and follow for more practical gold trading setups!
Commodity MCX Trading1. Overview of MCX and Commodity Trading
The Multi Commodity Exchange (MCX) is India’s premier commodity derivatives exchange, offering futures trading in metals, energy, and agricultural commodities. It was established to provide a transparent and regulated platform for trading commodities, mitigating the risks associated with price volatility.
Key Features:
Futures contracts for commodities
Price discovery mechanism
Hedging opportunities for producers and consumers
Regulated by the Securities and Exchange Board of India (SEBI)
MCX trading allows participants to speculate on price movements or hedge against potential losses in commodity prices. Commodities traded on MCX are divided into precious metals, base metals, energy commodities, and agricultural commodities.
2. Types of Commodities Traded on MCX
MCX offers a variety of commodities under different categories:
Precious Metals: Gold, Silver, Platinum, and Palladium
Base Metals: Copper, Aluminium, Zinc, Lead, Nickel
Energy Commodities: Crude Oil, Natural Gas, Petrol, Diesel
Agricultural Commodities: Cotton, Cardamom, Jeera, Turmeric
Each commodity has specific contracts with defined lot sizes, expiry dates, and tick sizes, providing structured opportunities for traders.
3. Understanding MCX Trading Mechanism
MCX operates on a futures-based trading system. In futures trading, traders agree to buy or sell a commodity at a predetermined price on a future date.
How it works:
Contract Selection: Traders choose the commodity and the expiry month.
Order Placement: Buy or sell orders are placed through brokers registered with MCX.
Margin Requirement: Traders deposit an initial margin to cover potential losses.
Settlement: Contracts are cash-settled or physically delivered at expiry, depending on the commodity.
MCX trading is electronic, ensuring transparency, liquidity, and real-time price discovery.
4. Role of Leverage and Margins
MCX trading involves leverage, which allows traders to control a large value of commodities with a relatively small margin.
Key Points:
Initial Margin: Required to open a position, varies by commodity and market volatility.
Mark-to-Market (MTM): Daily profit or loss adjustments based on closing prices.
Leverage Risk: High leverage can magnify gains but also increases potential losses.
Understanding margin requirements is critical to managing risks effectively in MCX trading.
5. Hedging and Speculation
MCX is used by both hedgers and speculators:
Hedgers: Producers, exporters, and manufacturers use MCX to mitigate price risks. Example: A gold jeweler may hedge against future price rises by buying gold futures.
Speculators: Traders aiming to profit from price fluctuations, often using technical and fundamental analysis to identify trading opportunities.
Hedging ensures stability for businesses, while speculation adds liquidity to the market.
6. Analysis Techniques in MCX Trading
Successful MCX trading relies on technical and fundamental analysis:
Technical Analysis: Uses charts, indicators, and patterns to predict price movements. Common tools include Moving Averages, RSI, MACD, and Bollinger Bands.
Fundamental Analysis: Focuses on supply-demand dynamics, geopolitical events, weather conditions, and macroeconomic factors affecting commodity prices.
A combination of both approaches helps traders make informed decisions.
7. Risk Management in Commodity Trading
Commodity trading carries inherent risks due to price volatility. Effective risk management strategies include:
Stop-loss Orders: Limit potential losses on a position.
Position Sizing: Allocate capital according to risk tolerance.
Diversification: Trade multiple commodities to spread risk.
Regular Monitoring: Keep track of global events, inventory reports, and currency fluctuations.
Risk management is crucial for both short-term and long-term traders.
8. Benefits and Challenges of MCX Trading
Benefits:
High liquidity and transparent trading platform
Opportunities for hedging and speculation
Potential for profit in rising or falling markets
Structured contracts with standardized specifications
Challenges:
High volatility and market risk
Requires understanding of complex derivative contracts
Leverage can magnify losses
Dependence on global commodity trends and geopolitical events
MCX trading offers opportunities for wealth creation but requires discipline, knowledge, and strategy.
Conclusion
MCX commodity trading is an essential tool for hedging, price discovery, and speculative profit in India. With the right analysis, risk management, and disciplined approach, traders can leverage the platform effectively. Understanding contract specifications, margins, market drivers, and trading psychology is crucial for success in the volatile commodity markets.
Trading Discipline – The Defining Edge of Professional TradersIn Forex and Gold trading, there is one truth every trader eventually learns: discipline matters more than strategy.
A simple system executed with discipline can deliver consistent results.
A brilliant system without discipline will collapse under pressure.
🧠 Stop-loss & Take-profit – Your Survival Tools
Stop-loss: Not surrender, but capital protection.
Take-profit: Not prediction, but securing gains before greed erodes them.
👉 Rule of pros: Set SL/TP before entering a trade – and never move them out of fear or hope.
📊 Case Study: Discipline vs Emotion
Undisciplined trader: Moves stop-loss further when price goes against him. Small loss turns into account damage.
Disciplined trader: Keeps stop-loss intact, loses 1%. Over 20 trades, system edge delivers net profits.
➡️ Lose small to win big.
🚀 Habits That Build Discipline
Have a trading plan: Entry rules – SL – TP – risk – time frame.
Use alerts: Reduce stress, stop staring at charts.
Walk away after entry: Don’t let emotions interfere.
Fixed risk: 1–2% per trade, no exceptions.
Keep a trading journal: Track not only results but emotions behind decisions.
🏆 Why Discipline Separates Pros from Amateurs
Amateurs let the market control them.
Professionals control themselves.
In the long run, success doesn’t come from one “perfect trade” but from hundreds of disciplined executions.
📈 Conclusion
The market is uncontrollable. But you can control yourself.
Discipline is the edge that:
Protects your capital.
Stabilizes your mindset.
Turns strategy into consistent results.
💡 Community Question for TradingView:
👉 “Have you ever broken your stop-loss or take-profit rules? What did it teach you about discipline?”
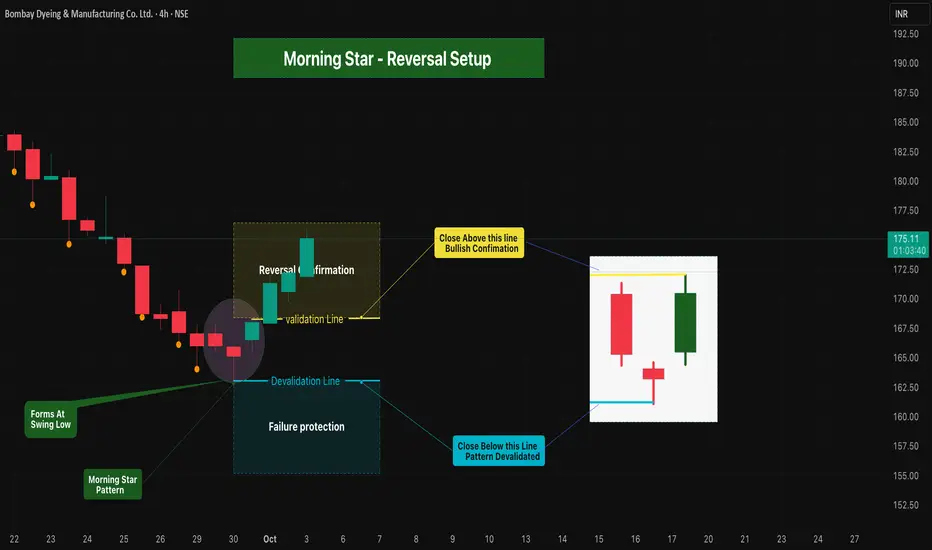
Morning Star - Reversal Setup 🔎 Overview
The Morning Star is a three-candle bullish reversal pattern that forms at a swing low after a downtrend.
• 1st Candle → Long bearish red candle (sellers in control).
• 2nd Candle → Small-bodied / Doji candle (indecision).
• 3rd Candle → Strong bullish green candle closing above the midpoint of the 1st red candle (buyers take control).
This structure signals a possible bullish reversal with clear validation & devalidation rule
____________________________________________________________
🛠 How to Use
• Validation Line → High of bullish candle = breakout confirmation level.
• Devalidation Line → Low of Doji candle = failure protection.
• Entry Rule → Candle close above Validation Line = Bullish Confirmation.
• Failure Rule → Candle close below Devalidation Line (before validation) = Pattern invalidated.
• Forms at swing low
• Protects against false signals & ensures structured risk management.
____________________________________________________________
📊 Chart Explanation
• Symbol → NSE:BOMDYEING Bombay Dyeing & Manufacturing Co. Ltd.
• Timeframe → 4H
• Pattern Confirmation → Morning Star identified & validated.
• Validation Level → 168.24
• Devalidation Level → 163.00
• On 1 Oct 2025 , price closed above validation level, confirming the bullish reversel
____________________________________________________________
🔎 Observations & Conclusion
The Morning Star provides a reliable bullish reversal framework.
With validation & devalidation levels, it filters false signals and enables disciplined risk-reward setups .
____________________________________________________________
⚠️ Disclaimer
📘 For educational purposes only.
🙅 Not SEBI registered.
❌ Not a buy/sell recommendation.
🧠 Purely a learning resource.
📊 Not Financial Advice.
E-Commerce Trading1. Introduction
E-commerce trading, also known as electronic commerce trading, represents the buying and selling of goods and services over digital platforms. Unlike traditional trading, which relies on physical stores, direct interaction, and manual processes, e-commerce operates over the internet, enabling global access, efficiency, and automation. With the exponential growth of internet penetration, smartphone usage, and digital payment systems, e-commerce trading has become one of the fastest-growing segments of the global economy.
E-commerce trading encompasses a broad spectrum of activities, including retail trading, wholesale trading, business-to-business (B2B) transactions, business-to-consumer (B2C) sales, consumer-to-consumer (C2C) platforms, and increasingly, business-to-government (B2G) operations. This digital marketplace has transformed traditional commerce by integrating technology, logistics, marketing, and finance, enabling businesses and consumers to interact seamlessly.
2. History and Evolution
Early Beginnings
The concept of e-commerce trading dates back to the late 20th century. Early examples include Electronic Data Interchange (EDI) systems used by corporations to exchange business documents electronically. The first online retail sale is often credited to the 1994 sale of a Sting CD via the website NetMarket. Soon after, Amazon and eBay emerged as pioneers, creating the blueprint for online marketplaces.
Technological Milestones
Several technological developments accelerated the growth of e-commerce trading:
Internet Expansion: The widespread availability of broadband internet allowed users to access online stores easily.
Secure Payment Gateways: Innovations like SSL encryption, PayPal, and later UPI, digital wallets, and credit/debit card integrations made online transactions secure and convenient.
Mobile Commerce: With smartphones becoming ubiquitous, mobile apps and responsive websites enabled trading anytime, anywhere.
AI and Data Analytics: Personalized recommendations, demand forecasting, and dynamic pricing became possible, improving trading efficiency.
Cloud Computing: Allowed scalable online storefronts and storage solutions for businesses without heavy infrastructure investments.
3. Types of E-Commerce Trading
E-commerce trading is not a monolithic concept; it can be categorized based on the nature of participants:
3.1 Business-to-Consumer (B2C)
B2C trading involves businesses selling directly to consumers. Amazon, Flipkart, Myntra, and Walmart are classic examples. This segment focuses on:
Product variety and convenience.
Personalized marketing using AI and customer analytics.
Rapid delivery services.
Seamless payment methods, including COD, wallets, and UPI.
3.2 Business-to-Business (B2B)
B2B platforms facilitate transactions between companies. Examples include Alibaba, IndiaMART, and ThomasNet. Key characteristics:
Bulk transactions at negotiated prices.
Long-term partnerships and contracts.
Integration of supply chain management with trading platforms.
3.3 Consumer-to-Consumer (C2C)
C2C platforms allow individuals to trade with each other. eBay, OLX, and Quikr are examples. Features include:
Peer-to-peer sales of used goods or handmade items.
Trust-building through rating systems.
Secure payment mechanisms to ensure safe trades.
3.4 Business-to-Government (B2G)
B2G trading involves businesses providing products or services to government agencies. Digital tendering platforms, government e-procurement systems, and contracts for public projects are part of this domain.
4. Key Components of E-Commerce Trading
E-commerce trading relies on multiple integrated components that ensure smooth operation:
4.1 Online Marketplace Platforms
Platforms such as Amazon, Flipkart, Shopify, and Etsy provide the digital infrastructure for trading. These platforms host multiple sellers, offer product search and categorization, manage orders, and facilitate payments.
4.2 Payment Gateways and Financial Services
Secure payment systems are the backbone of e-commerce. Payment gateways process online transactions, while financial technologies (FinTech) like UPI, PayPal, Stripe, and digital wallets ensure instant transfers and refunds.
4.3 Logistics and Supply Chain Management
Efficient trading requires prompt delivery. Logistics includes warehousing, transportation, inventory management, and last-mile delivery. Companies like DHL, FedEx, and Indian startups like Delhivery revolutionized supply chain efficiency.
4.4 Digital Marketing
E-commerce trading thrives on digital marketing strategies, including:
Search Engine Optimization (SEO)
Social media advertising
Influencer marketing
Email campaigns and retargeting
Personalized recommendation engines
4.5 Technology Infrastructure
Modern e-commerce trading depends on advanced technologies:
Cloud computing for scalable server architecture.
AI and machine learning for predictive analytics and chatbots.
Big data for consumer insights.
AR/VR for immersive shopping experiences.
Blockchain for secure transactions and supply chain transparency.
5. Advantages of E-Commerce Trading
E-commerce trading offers numerous benefits for both businesses and consumers:
5.1 Global Reach
Unlike traditional stores limited by location, e-commerce platforms enable businesses to reach customers worldwide, expanding market potential significantly.
5.2 Cost Efficiency
Lower overhead costs due to the absence of physical storefronts, reduced staff requirements, and automation in operations contribute to cost efficiency.
5.3 Convenience
Consumers can shop 24/7, compare prices, read reviews, and receive products at their doorstep, enhancing customer satisfaction.
5.4 Personalized Experiences
Using AI-driven recommendations and behavioral analytics, e-commerce platforms provide tailored product suggestions, increasing sales and customer loyalty.
5.5 Analytics-Driven Decisions
Real-time tracking of sales, customer preferences, and market trends allows businesses to make informed decisions about inventory, pricing, and marketing.
6. Challenges in E-Commerce Trading
Despite its growth, e-commerce trading faces significant challenges:
6.1 Cybersecurity Risks
Hacking, data breaches, and fraudulent transactions threaten businesses and consumer trust.
6.2 Logistics and Supply Chain Bottlenecks
Delivery delays, damaged products, and inventory mismanagement can reduce customer satisfaction.
6.3 Intense Competition
Low barriers to entry in e-commerce result in fierce competition, driving prices down and impacting profit margins.
6.4 Regulatory and Legal Issues
Compliance with tax laws, consumer protection regulations, cross-border trade laws, and data privacy rules is complex.
6.5 Technological Dependence
Overreliance on digital infrastructure exposes businesses to risks of downtime, server failures, or software glitches.
Conclusion
E-commerce trading has transformed the way businesses and consumers interact, creating an ecosystem that is fast, efficient, and global. It bridges the gap between markets and customers, empowers small businesses, and drives technological innovation. While challenges like cybersecurity, logistics, and competition remain, emerging trends in mobile commerce, AI, AR, and sustainability promise a bright and transformative future.
Businesses that adapt quickly, embrace technology, and prioritize customer-centric strategies are likely to thrive, while traditional models will need to evolve or collaborate with digital platforms to remain relevant. In essence, e-commerce trading is not just a trend—it is the new norm in global commerce, reshaping the very fabric of trade in the 21st century.

The Truth About Overnight Riches What Influencers Won’t Tell YouHello Traders!
You’ve seen it everywhere, screenshots of massive profits, luxury cars, and captions like “I made this in one trade.”
The illusion of overnight riches sells fast, but what you don’t see is the reality behind it.
Let’s uncover what most influencers never talk about, the truth behind quick money in trading.
1. The Reality Behind the Screenshot
That big profit post doesn’t show how many losses came before it.
Many traders show one winning trade out of dozens of failed ones.
You never see the emotional stress, sleepless nights, and blown accounts behind that single success.
2. Overnight Riches Come with Overnight Risk
The faster you try to make money, the faster you can lose it.
Trading with oversized lots or without stop losses may look exciting, until one bad move wipes you out.
Wealth that lasts is built on consistency, not chaos.
3. The Boring Stuff Makes You Rich
Proper risk management, discipline, and patience are not flashy, but they’re what actually make traders successful.
While others chase quick money, real traders master control over emotions and capital.
Slow growth feels boring, but it’s the only path that’s sustainable.
4. The Hidden Cost of “Fast” Success
Chasing overnight profits creates mental pressure and greed.
Even if you win once, you’ll keep gambling to repeat it, until luck runs out.
True freedom in trading comes when you stop forcing success and start following process
Rahul’s Tip:
Don’t compare your beginning to someone else’s highlight reel. The real traders you admire have spent years learning, failing, and improving before they started winning.
Conclusion:
The idea of overnight riches is a dream sold to those who don’t know better.
But once you understand trading is a skill, not a lottery, you’ll stop rushing and start growing steadily.
The best traders don’t chase money; they chase mastery, and money follows naturally.
If this post gave you clarity about the real journey of trading, like it, share your thoughts in comments, and follow for more honest trading insights!

Event-Driven Earnings TradingEvent-driven earnings trading is a strategy in the financial markets that focuses on capitalizing on price movements caused by corporate events, primarily earnings announcements. Unlike traditional trend-following or technical trading, this strategy is based on analyzing how specific news, reports, or announcements affect a company’s stock price. Earnings trading is considered highly profitable but requires precise timing, strong analytical skills, and disciplined risk management.
Here’s a detailed breakdown of key elements of event-driven earnings trading:
1. Understanding Earnings Announcements
Earnings announcements are periodic reports released by publicly traded companies detailing their financial performance over a specific period, usually quarterly. Traders monitor these announcements to gauge a company's profitability, revenue growth, and future prospects.
EPS (Earnings Per Share): A critical metric showing the profit allocated to each share of stock.
Revenue vs. Expectations: Markets react not just to absolute earnings but to how they compare to analysts’ consensus estimates.
Forward Guidance: Companies often provide future forecasts, which can influence short-term and medium-term stock movements.
Key takeaway: A solid understanding of earnings reports allows traders to anticipate market reactions before they occur.
2. Pre-Earnings Analysis and Positioning
Traders often prepare well before an earnings release. Pre-earnings analysis involves:
Studying past earnings reactions to similar announcements.
Identifying patterns in volatility expansion prior to earnings.
Analyzing analyst expectations and market sentiment.
Observing options market activity for unusual trading volumes or skewed implied volatility.
Positioning strategies can include setting up directional trades if confident in the earnings outcome or hedged trades to limit risk.
3. Earnings Surprises and Market Reaction
Earnings surprises occur when the reported earnings deviate significantly from analysts’ expectations:
Positive Surprise: EPS or revenue exceeds expectations → Stock often gaps up.
Negative Surprise: EPS or revenue falls short → Stock may gap down.
The magnitude of the reaction depends on:
Market sentiment
Magnitude of the surprise
Company fundamentals and sector context
Key insight: Markets are highly sensitive to unexpected earnings outcomes, creating short-term trading opportunities.
4. Event-Driven Trading Strategies
Several approaches are employed by traders around earnings events:
Directional Bets: Taking a long or short position based on expected earnings outcome.
Straddle/Strangle Option Strategies: Buying calls and puts simultaneously to profit from volatility spikes.
Post-Earnings Momentum: Trading the continuation or reversal of price trends immediately after earnings.
Pairs Trading: Hedging exposure by trading correlated stocks when one releases earnings.
Each strategy involves balancing risk and reward while factoring in implied volatility and market sentiment.
5. Volatility Considerations
Earnings announcements often lead to high volatility:
Pre-Earnings: Volatility often rises in anticipation of the report, reflected in options prices.
Post-Earnings: A sharp drop or spike can occur depending on the surprise and market reaction.
Traders must account for implied volatility crush, a sudden decrease in options premium after earnings release. Understanding this concept is crucial for options-based strategies.
6. Risk Management in Earnings Trading
Event-driven trading carries high risk due to unpredictable market reactions. Effective risk management includes:
Setting strict stop-loss levels
Avoiding overleveraging positions
Diversifying trades across multiple earnings events
Hedging with options to limit potential losses
Maintaining discipline is essential because unexpected announcements or market sentiment shifts can lead to significant losses.
7. Tools and Data Sources
Successful earnings trading relies on real-time data and analytical tools:
Earnings Calendars: Track upcoming announcements.
Financial News Platforms: Bloomberg, Reuters, CNBC for updates.
Options Chains: Monitor implied volatility and unusual option activity.
Technical Analysis: Identify support/resistance levels for post-earnings movement.
Combining fundamental and technical insights allows traders to make informed decisions.
8. Psychology and Market Behavior
Understanding market psychology is as important as analyzing financials:
Traders react emotionally to surprises, leading to exaggerated moves.
Herd behavior can amplify short-term volatility.
Experienced traders exploit these reactions by anticipating overreactions and mean reversions.
Key takeaway: Emotional discipline and a systematic approach increase the probability of success in earnings trading.
Conclusion
Event-driven earnings trading offers traders unique opportunities to profit from corporate announcements. By combining pre-earnings analysis, strategic positioning, risk management, and psychological insight, traders can navigate the volatility and capitalize on market inefficiencies. While the potential rewards are significant, disciplined execution and robust analysis are vital to sustaining long-term profitability.
Intraday Scalping Tips1. Understanding the Scalping Concept
Scalping is different from traditional intraday trading. While intraday traders may hold positions for several hours, scalpers aim to profit from very small price fluctuations that occur over minutes—or even seconds. Key principles include:
High Trade Frequency: Scalpers often make dozens of trades in a single day.
Small Gains: Each trade typically targets 0.1–0.5% profit.
Minimal Exposure: Trades are closed quickly to avoid major market risks.
Scalping is particularly effective in highly liquid markets like Nifty, Bank Nifty, or major blue-chip stocks where order execution is smooth and spreads are low.
2. Choosing the Right Stocks or Instruments
Not all stocks are suitable for scalping. Selecting the right instruments is critical for consistent profits. Key considerations include:
Liquidity: Highly traded stocks allow quick entry and exit.
Volatility: Moderate volatility provides enough price movement for scalping without excessive risk.
Tight Spreads: Stocks with narrow bid-ask spreads reduce transaction costs.
Market Depth: Strong support and resistance levels make prediction of price action more reliable.
Popular choices for scalpers in India include Nifty, Bank Nifty, HDFC Bank, Reliance, and Infosys, as they provide both liquidity and predictable movement patterns.
3. Time Frame Selection and Chart Analysis
Time frame selection is critical in scalping since trades are short-lived:
1-Minute and 5-Minute Charts: Most scalpers rely on very short time frames for identifying entry and exit points.
Tick Charts: Some traders use tick charts to focus on the number of trades instead of time intervals, offering precision in fast markets.
Indicators: Common indicators include:
Moving Averages: For trend confirmation.
Relative Strength Index (RSI): To spot overbought/oversold conditions.
Volume Indicators: Confirm breakout strength and liquidity.
Chart patterns like flags, pennants, and micro-trends are also useful for short-term trade setups.
4. Setting Precise Entry and Exit Points
Successful scalping relies on strict entry and exit discipline:
Entry Rules: Enter trades when technical indicators align (e.g., price breaks a micro-resistance on high volume).
Exit Rules: Always set a pre-determined profit target (e.g., 0.2–0.5%) to avoid greed.
Stop-Loss Discipline: A tight stop-loss (0.1–0.3% below entry price) prevents small losses from becoming large.
Risk-Reward Ratio: Even for small profits, maintain a risk-reward ratio that ensures overall profitability.
Automation tools like bracket orders in NSE allow traders to simultaneously set stop-loss and target levels.
5. Capital Management and Trade Sizing
Proper capital management is crucial to survive in high-frequency scalping:
Small Position Sizes: Avoid risking too much on a single trade.
Leverage Management: Use leverage cautiously; while it magnifies profits, it also amplifies losses.
Diversification: Spread trades across multiple instruments to reduce concentration risk.
Daily Loss Limits: Decide beforehand how much you can lose in a day and stick to it—emotional control is key.
Even small profits can accumulate when losses are strictly controlled.
6. Using Technology for Speed and Accuracy
Scalping is a speed-driven strategy, making technology a critical factor:
Direct Market Access (DMA): Enables faster order execution compared to traditional brokers.
Low Latency Trading Platforms: Platforms like Zerodha Kite, Upstox Pro, and Interactive Brokers help reduce slippage.
Hotkeys and Advanced Orders: Pre-set hotkeys speed up entries and exits.
Real-Time Data Feeds: Access to live market data is essential for micro-trend identification.
Automated scripts and algorithmic tools can also be employed to execute scalping strategies without hesitation.
7. Psychological Discipline and Emotional Control
Scalping is mentally demanding due to rapid decision-making:
Avoid Overtrading: Even if setups are frequent, wait for high-probability signals.
Embrace Small Wins: Focus on cumulative gains rather than single trades.
Detach from Emotions: Fear and greed can destroy scalping strategies in seconds.
Routine and Focus: A disciplined pre-market routine enhances performance.
Mental fatigue can lead to poor execution, so breaks and mental preparation are crucial.
8. Continuous Learning and Strategy Adaptation
Markets are dynamic, and scalping strategies must evolve:
Review Trades Daily: Maintain a trade journal to track setups, wins, and losses.
Backtesting: Test strategies on historical data to identify strengths and weaknesses.
Adapt to Market Conditions: Scalping in trending markets differs from range-bound markets.
Stay Updated: Economic events, corporate news, and global market movements can drastically affect intraday behavior.
Continuous refinement ensures long-term profitability and helps scalpers stay ahead of changing conditions.
Conclusion
Intraday scalping is a high-speed, high-discipline trading approach that rewards precision, strategy, and emotional control. Success depends on selecting the right instruments, leveraging technology, maintaining strict risk management, and continuously learning from market behavior. While scalping can offer consistent profits, it is not suitable for everyone due to its demanding nature. Traders who combine discipline with strategic execution and adaptive methods can use scalping to capitalize on micro-movements in the market and achieve steady gains over time.
Smart Option Strategies1. Understanding the Basics of Options
Before diving into strategies, it’s crucial to understand what options are and their fundamental mechanics. An option is a contract that gives the buyer the right, but not the obligation, to buy (call option) or sell (put option) an underlying asset at a predetermined price (strike price) on or before a specified expiration date.
Key Terms:
Call Option: Right to buy the underlying asset.
Put Option: Right to sell the underlying asset.
Strike Price: Predetermined price at which the underlying can be bought/sold.
Premium: Price paid to acquire the option.
Expiry: The date when the option contract ends.
Options can be used for speculation, hedging, or income generation. Smart strategies leverage these concepts to create a risk-reward profile suited to the trader’s objective.
2. The Importance of Market Outlook
A critical step in any smart option strategy is defining your market outlook. Options are directional instruments, meaning your choice of strategy depends on whether you expect the market to go up, down, or stay neutral.
Bullish Outlook: Use strategies like long calls, bull call spreads, or cash-secured puts.
Bearish Outlook: Use strategies like long puts, bear put spreads, or protective puts.
Neutral Outlook: Use strategies like iron condors, butterflies, or straddles/strangles.
By aligning strategy with market expectations, traders can manage risk effectively while enhancing the probability of profit.
3. Leverage Through Spreads
One of the most effective tools in smart options trading is the spread. A spread involves taking two or more options positions simultaneously to limit risk while maintaining profit potential.
Vertical Spreads: Buy and sell options of the same type (call or put) with different strike prices but the same expiry. Examples: bull call spread, bear put spread.
Horizontal/Calendar Spreads: Buy and sell options of the same type and strike price but with different expiries.
Diagonal Spreads: Combination of vertical and calendar spreads; different strikes and expiries.
Advantages of Spreads:
Reduced upfront cost compared to naked options.
Lower risk due to simultaneous hedging.
Controlled profit and loss ranges.
Spreads are ideal for traders who want to capture directional moves without exposing themselves to unlimited losses.
4. Hedging and Risk Management
A smart option strategy always includes risk management. Hedging is a way to protect your positions from adverse price movements while maintaining upside potential.
Protective Puts: Buying a put option against a long stock position to limit downside.
Covered Calls: Selling call options on stocks you own to generate income and partially hedge downside.
Collars: Combining a protective put with a covered call to create a risk-defined range.
Risk management ensures that even if the market moves unexpectedly, losses are controlled. This is crucial for long-term sustainability in trading.
5. Income Generation with Options
Options are not only for speculation—they are a powerful tool for generating consistent income. Smart traders use strategies that collect premiums while managing risk.
Covered Calls: Sell calls against stock holdings to earn premiums. Ideal for slightly bullish or neutral outlooks.
Cash-Secured Puts: Sell puts against cash reserves to potentially buy stocks at lower prices while collecting premiums.
Iron Condors: Sell an out-of-the-money call and put spread to profit from a neutral market.
These strategies allow traders to create steady cash flow while carefully managing market exposure.
6. Volatility-Based Strategies
Volatility is a critical concept in options trading. It measures the market’s expectation of price fluctuation. Smart traders exploit volatility to maximize returns.
Long Straddles: Buy both a call and a put at the same strike price and expiry, profiting from large moves in either direction.
Long Strangles: Buy out-of-the-money calls and puts, benefiting from volatility with lower premium cost.
Short Straddles/Strangles: Selling these options if you expect low volatility; profit comes from premium decay (theta).
Understanding implied and historical volatility allows traders to choose strategies that capitalize on expected market movements.
7. Time Decay and Option Greeks
Option Greeks are essential for sophisticated strategy planning. They measure how options prices react to various factors:
Delta: Sensitivity to the underlying asset’s price.
Gamma: Rate of change of delta.
Theta: Time decay of the option.
Vega: Sensitivity to volatility.
Rho: Sensitivity to interest rates.
Smart traders use Greeks to manage timing and position sizing. For instance, options lose value as expiry approaches (theta decay), so selling premium in stable markets can be profitable.
8. Combining Strategies for Flexibility
Advanced traders combine multiple strategies to create a flexible trading framework. For example:
Iron Condor with Protective Puts: Combines premium collection with downside protection.
Diagonal Spreads with Calendar Adjustments: Exploits volatility and time decay simultaneously.
Delta-Neutral Strategies: Uses a combination of options and stocks to stay market-neutral while profiting from volatility.
By integrating multiple approaches, traders can adapt to changing market conditions and improve risk-adjusted returns.
Conclusion
Smart options strategies are not about chasing high profits blindly—they are about precision, planning, and adaptability. By understanding the market outlook, leveraging spreads, managing risk, exploiting volatility, and using Greeks, traders can create positions that maximize potential while minimizing risk. Whether your goal is speculation, hedging, or income generation, a smart, structured approach to options trading ensures sustainable success.

Futures and Options (F&O) in Indian Stock Market1. Introduction to F&O
Futures and Options are derivatives, which are financial contracts whose value is derived from an underlying asset such as stocks, indices, commodities, or currencies. Unlike spot market trading, where assets are exchanged immediately, derivatives provide the right or obligation to buy or sell an underlying asset at a predetermined price on a future date.
Futures Contract: A standardized agreement to buy or sell an asset at a future date at a price agreed upon today.
Options Contract: A contract that gives the holder the right, but not the obligation, to buy (Call Option) or sell (Put Option) the underlying asset at a predetermined price before or on the contract's expiry.
F&O trading is highly leveraged, allowing traders to control larger positions with smaller capital, but it also carries higher risk.
2. Components of F&O Contracts
Every F&O contract has specific components that traders must understand:
Underlying Asset: The stock, index, commodity, or currency on which the derivative is based.
Strike Price: The price at which the option can be exercised.
Expiry Date: The date on which the contract matures.
Lot Size: The minimum quantity of the underlying asset that can be traded in a contract.
Premium (for Options): The price paid to buy an option.
Settlement Mechanism: Physical delivery or cash settlement, depending on the contract type.
These components define the risk and payoff structure of F&O trades.
3. Types of F&O Instruments
In the Indian context, F&O instruments are broadly classified into:
Stock Futures and Options: Derivatives based on individual company stocks. For example, Infosys or Reliance stock futures.
Index Futures and Options: Derivatives based on market indices like Nifty 50, Bank Nifty, or Sensex.
Currency Derivatives: Based on currency pairs like USD/INR, EUR/INR.
Commodity Derivatives: Based on metals, energy products, and agricultural commodities.
Each type has its own market participants, risk profiles, and trading strategies.
4. Trading Mechanism in F&O
F&O trading happens on recognized exchanges like NSE (National Stock Exchange) and BSE (Bombay Stock Exchange) in India.
Margin-Based Trading: Traders are required to maintain a margin instead of paying the full contract value. This allows leverage but amplifies risk.
Mark-to-Market (MTM) Settlement: Daily profits and losses are adjusted in the trader’s account to reflect the market movement.
Hedging vs. Speculation: Traders can hedge existing positions in the cash market to reduce risk or speculate purely on price movements.
The trading mechanism ensures liquidity and efficient price discovery, making F&O an essential part of modern financial markets.
5. Advantages of F&O Trading
F&O trading offers several benefits:
Leverage: Control large positions with smaller capital investment.
Hedging: Protect against adverse price movements in the cash market.
Diversification: Trade in multiple asset classes like stocks, indices, commodities, and currencies.
Profit Opportunities in Both Directions: Traders can earn from rising or falling markets using futures and options strategies.
Price Discovery: F&O markets help determine the fair price of underlying assets.
Despite the advantages, F&O trading is risky and requires a clear understanding of strategies and market behavior.
6. Risks in F&O Trading
The high rewards of F&O come with significant risks:
Leverage Risk: Small market movements can result in large gains or losses.
Time Decay (for Options): Options lose value as expiry approaches if the market does not move favorably.
Volatility Risk: Sudden market swings can lead to margin calls or loss of capital.
Liquidity Risk: Some contracts may have fewer participants, making it hard to exit positions.
Effective risk management, such as stop-loss orders, position sizing, and hedging, is crucial for sustainable trading.
7. Popular F&O Strategies
Traders use various strategies depending on market conditions and risk appetite:
Hedging Strategies: Protect investments in the cash market using futures or options.
Speculative Strategies: Take leveraged positions to profit from short-term price movements.
Options Strategies:
Covered Call: Holding the underlying asset and selling call options to earn premium.
Protective Put: Buying a put option to protect against a potential drop in the asset price.
Straddles and Strangles: Profit from high volatility by buying both call and put options.
Understanding and applying strategies carefully is key to F&O success.
8. Regulatory Framework and Market Participants
F&O trading in India is regulated by the Securities and Exchange Board of India (SEBI). Key regulations include:
Position Limits: Restrictions on the maximum number of contracts one can hold.
Margin Requirements: Minimum collateral for trading F&O to mitigate systemic risk.
Settlement Procedures: Standardized processes for MTM, delivery, and expiry settlement.
Market participants include:
Retail Traders: Individual investors participating in hedging or speculation.
Institutional Investors: Mutual funds, insurance companies, and banks using F&O for portfolio management.
Proprietary Traders: Firms or individuals trading with their own capital for profit.
Arbitrageurs: Traders exploiting price discrepancies between spot and derivative markets.
Conclusion
F&O trading is a powerful tool for investors and traders seeking to leverage capital, hedge risks, and benefit from price movements in multiple asset classes. While the potential for high returns exists, it comes with significant risks that require discipline, market knowledge, and risk management skills. With the Indian F&O market growing rapidly, a strong understanding of concepts, strategies, and regulations is essential for anyone aiming to succeed in derivatives trading.
F&O is not just about speculation; it’s an integral part of modern financial markets that supports liquidity, price discovery, and risk management. For serious market participants, mastering F&O can be a game-changer in wealth creation and portfolio optimization.
Option Chain Terms – Comprehensive Explanation1. Strike Price
The strike price (also called exercise price) is the fixed price at which the buyer of an option can buy (call option) or sell (put option) the underlying asset upon expiry.
For call options, it is the price at which the underlying asset can be purchased.
For put options, it is the price at which the underlying can be sold.
Example:
If a stock trades at ₹5,000 and the call option has a strike price of ₹5,100:
Buying the call allows you to buy the stock at ₹5,100, regardless of the market price.
Buying the put allows you to sell the stock at ₹5,100, even if the market falls to ₹4,800.
Strike prices are usually set at regular intervals, known as strike intervals, e.g., ₹50, ₹100, ₹500 depending on the underlying asset.
2. Expiry Date
The expiry date is the date on which the option contract ceases to exist. Options in India typically expire on the last Thursday of the contract month.
European-style options can only be exercised on the expiry date.
American-style options can be exercised any time before or on the expiry date.
Expiry influences option premiums:
Longer expiries usually have higher premiums due to increased time value.
Short-dated options experience faster time decay (theta).
3. Option Type (Call / Put)
Options are classified into Call Options and Put Options:
Call Option: Right to buy the underlying at the strike price. Traders buy calls when expecting price increase.
Put Option: Right to sell the underlying at the strike price. Traders buy puts when expecting price decline.
The option chain displays both call and put options for each strike price side by side for easy comparison.
4. Premium / Last Traded Price (LTP)
The premium is the price paid by the buyer to purchase the option. On an option chain, this is displayed as the Last Traded Price (LTP).
Premium consists of Intrinsic Value (IV) and Time Value (TV):
Intrinsic Value: The difference between current underlying price and strike price (only if in-the-money).
Call Option: Current Price - Strike Price (if positive)
Put Option: Strike Price - Current Price (if positive)
Time Value: Extra value due to remaining time till expiry and volatility.
Options closer to expiry have lower time value.
Premium is highly influenced by volatility, time decay, and demand-supply.
5. Open Interest (OI)
Open Interest is the total number of outstanding contracts that have not been squared off (closed) or exercised.
High OI indicates liquidity and potential support/resistance levels at that strike.
Increasing OI along with rising prices may indicate bullish sentiment; decreasing OI may indicate weak trend.
Example:
If 5,000 call option contracts at strike ₹5,000 are outstanding, it means traders have taken positions worth 5,000 contracts, reflecting market interest in that price point.
6. Volume
Volume indicates the number of contracts traded during a particular session.
High volume reflects active trading and market participation.
Comparing volume with open interest helps gauge whether new positions are being initiated or closed.
Interpretation:
Rising price + rising volume = Strong bullish trend
Falling price + rising volume = Strong bearish trend
7. Implied Volatility (IV)
Implied Volatility (IV) is the market’s expectation of future volatility of the underlying asset.
Higher IV leads to higher premiums.
Lower IV means cheaper options, reflecting market stability.
IV is crucial for traders using strategies like straddles, strangles, and spreads because these depend on expected volatility movements.
Example:
If stock X has IV of 25%, traders expect the stock price to move significantly; if IV is 10%, minimal movement is anticipated.
8. Greeks (Delta, Gamma, Theta, Vega, Rho)
Greeks quantify risk and sensitivity of option prices to various factors:
Delta (Δ) – Measures change in option price per ₹1 change in underlying.
Call Delta ranges 0–1; Put Delta ranges 0 to -1.
Gamma (Γ) – Measures rate of change of delta.
Higher gamma = option more sensitive to price changes.
Theta (Θ) – Measures time decay; negative for long options.
Vega (V) – Measures sensitivity to implied volatility.
Rho (ρ) – Measures sensitivity to interest rates.
Greeks allow traders to hedge risks and plan multi-leg strategies effectively.
9. Bid and Ask
Bid Price: Price buyers are willing to pay for an option.
Ask Price (Offer Price): Price sellers are asking.
Bid-Ask Spread: Difference between bid and ask, reflecting liquidity.
A tight spread indicates active trading, while a wide spread indicates illiquid options.
10. In-The-Money (ITM), At-The-Money (ATM), Out-Of-The-Money (OTM)
ITM: Option has intrinsic value.
Call: Strike < Underlying Price
Put: Strike > Underlying Price
ATM: Strike price ≈ Underlying Price
OTM: Option has no intrinsic value.
Call: Strike > Underlying Price
Put: Strike < Underlying Price
These classifications help traders choose options based on risk appetite and strategy (speculation vs hedging).
Conclusion
An option chain is more than just numbers; it is a market sentiment map showing where traders are positioning themselves, potential support/resistance zones, and volatility expectations. Understanding terms like strike price, premium, open interest, volume, IV, Greeks, bid/ask, and moneyness enables traders to make informed decisions, structure strategies, and manage risk effectively.
By combining quantitative data (LTP, OI, volume) with qualitative interpretation (IV, Greeks), an option chain becomes an indispensable tool for both speculative and hedging strategies in the financial markets.
Brokers’ Impact on the Indian Trading Market1. Market Liquidity Enhancement
Brokers significantly enhance liquidity in the Indian trading market. By facilitating the buying and selling of securities, they ensure that there is a continuous flow of transactions, which allows investors to enter or exit positions with relative ease. High liquidity reduces the bid-ask spread and stabilizes prices, thereby creating a more efficient market. For example, large brokerage houses like Zerodha and ICICI Direct enable millions of retail investors to transact daily, adding substantial liquidity to both equity and derivatives markets.
2. Price Discovery and Market Efficiency
Brokers contribute directly to price discovery—the process through which the market determines the fair value of a security based on supply and demand. By executing trades promptly and efficiently, brokers help in reflecting accurate market sentiment. This becomes particularly crucial in volatile conditions, where brokers’ rapid response to client orders prevents large price gaps and contributes to overall market efficiency. Institutional brokers, due to their large order volumes, play a major role in signaling market trends.
3. Investor Accessibility and Participation
The democratization of the Indian trading market has largely been driven by brokers. Online brokerage platforms have reduced barriers to entry, enabling small retail investors to participate alongside institutional players. Features such as zero brokerage trading, mobile apps, and educational resources empower investors, broadening the market base. A larger investor base increases overall market participation, which in turn stabilizes market fluctuations and fosters long-term growth.
4. Advisory Services and Investment Guidance
Beyond executing trades, many brokers provide research, advisory services, and personalized investment guidance. They analyze market trends, corporate earnings, and macroeconomic developments, helping investors make informed decisions. These services influence trading patterns and investor behavior, shaping market trends indirectly. For instance, advisory reports recommending sectoral or stock-specific strategies can trigger substantial trading volumes in those assets.
5. Regulatory Compliance and Market Integrity
Brokers are the frontline enforcers of market regulations in India. Registered with SEBI (Securities and Exchange Board of India), they ensure compliance with trading norms, disclosure requirements, and anti-fraud measures. By adhering to regulatory frameworks, brokers maintain market integrity and protect investors from malpractices. Their role in preventing insider trading, front-running, and other unethical practices is crucial to maintaining confidence in the Indian financial system.
6. Technological Innovation and Market Modernization
Brokers have driven technological innovation in the Indian trading market. The introduction of electronic trading platforms, algorithmic trading services, and real-time market data feeds has revolutionized market operations. Brokers facilitate high-speed order execution, automated trading strategies, and advanced charting tools, allowing both retail and institutional investors to make rapid, informed decisions. These technological advancements enhance transparency and reduce operational inefficiencies in the market.
7. Market Stabilization During Volatility
During periods of high market volatility, brokers play a stabilizing role by managing order flows and advising clients prudently. Their risk management tools, such as stop-loss orders and portfolio diversification recommendations, help prevent panic selling and irrational market movements. By maintaining a balance between buyer and seller interest, brokers reduce extreme price swings and contribute to a resilient market structure.
8. Impact on Market Sentiment and Investor Psychology
Brokers influence not just trading volume, but also investor sentiment. Market rumors, analyst recommendations, and brokerage reports can shape investor perception, sometimes even more than fundamental data. Positive sentiment promoted by brokers can lead to bullish market trends, while negative sentiment may accelerate corrections. Understanding the psychological impact brokers have on trading decisions is key to evaluating their overall influence on market dynamics.
Conclusion
Brokers serve as the backbone of the Indian trading ecosystem. Their impact spans liquidity provision, price discovery, regulatory compliance, technological advancement, and investor education. Both traditional and modern brokerage models continue to shape market behavior, investor participation, and overall efficiency. As the Indian trading market grows in sophistication and scale, brokers’ role remains central in sustaining market stability, enhancing transparency, and promoting a culture of informed investing.

Trading with AI: Revolutionizing Financial Markets1. Understanding AI in Trading
AI in trading refers to the use of machine learning algorithms, deep learning, natural language processing, and other advanced computational methods to analyze market data and make trading decisions. Unlike traditional trading, which relies heavily on human intuition and manual analysis, AI trading systems can process massive datasets, detect patterns, and execute trades with minimal human intervention.
Key aspects include:
Machine Learning Models: Used to forecast price movements, volatility, and trading volume.
Algorithmic Trading: AI systems can automate order placement, optimizing timing and pricing.
Predictive Analytics: Historical market data is analyzed to predict future trends.
AI-powered trading aims to reduce human biases, improve decision speed, and increase profitability by leveraging data-driven insights.
2. Types of AI Trading Strategies
AI trading encompasses multiple strategies depending on market objectives and risk tolerance. Some of the most common strategies include:
Algorithmic Trading: AI algorithms execute high-frequency trades based on predefined rules and patterns.
Sentiment Analysis Trading: AI systems analyze news, social media, and financial reports to gauge market sentiment and predict price movements.
Predictive Modeling: Machine learning models predict asset prices using historical and real-time data.
Reinforcement Learning: AI agents learn optimal trading strategies through trial and error in simulated environments.
Each strategy has its own strengths and challenges. For instance, high-frequency trading (HFT) requires extremely low-latency systems, whereas sentiment analysis relies on natural language processing and advanced data scraping.
3. AI in Market Data Analysis
The financial market generates enormous volumes of structured and unstructured data daily, including stock prices, order books, news articles, social media posts, and economic indicators. Human traders cannot efficiently process this volume in real-time. AI excels in:
Pattern Recognition: Identifying recurring price patterns and anomalies.
Correlation Analysis: Detecting relationships between assets or markets that humans may overlook.
Event Impact Analysis: Evaluating how geopolitical events, policy changes, or corporate announcements affect markets.
By leveraging AI, traders gain actionable insights from complex datasets that improve the accuracy of predictions and reduce reaction time.
4. Risk Management and AI
Effective risk management is crucial in trading, and AI can significantly enhance it by:
Real-Time Monitoring: AI models track portfolio risks continuously and alert traders to potential exposure.
Dynamic Position Sizing: Algorithms can adjust trade sizes based on volatility and market conditions.
Predictive Risk Assessment: Machine learning models forecast potential losses and drawdowns using historical data.
AI reduces human error in risk assessment and allows traders to maintain discipline even during highly volatile market conditions.
5. Benefits of AI Trading
AI-driven trading offers several advantages over traditional methods:
Speed and Efficiency: AI systems can process data and execute trades in milliseconds, outperforming human reaction times.
Data-Driven Decisions: Trading decisions are based on analytics and predictive modeling rather than emotions or intuition.
Consistency: AI executes strategies consistently without being influenced by fear or greed.
Adaptive Learning: Machine learning models evolve and improve over time with more data.
Cost Reduction: Automated AI trading reduces the need for large trading teams and manual intervention.
These benefits make AI an indispensable tool for hedge funds, institutional traders, and increasingly, retail investors.
6. Challenges in AI Trading
Despite its advantages, AI trading comes with challenges:
Model Overfitting: AI models may perform well on historical data but fail in real market conditions.
Data Quality Issues: Inaccurate or incomplete data can lead to wrong predictions.
Market Impact: High-frequency AI trades can contribute to market volatility.
Regulatory Risks: Financial regulators are increasingly scrutinizing AI trading to prevent market manipulation and ensure transparency.
Technical Complexity: Developing, testing, and maintaining AI trading systems requires expertise in data science, finance, and computing infrastructure.
Traders must balance AI capabilities with careful oversight and risk management to mitigate these challenges.
7. AI in Retail Trading
Traditionally, AI trading was limited to institutional players due to high infrastructure costs. However, advances in cloud computing, APIs, and AI platforms have democratized access:
Robo-Advisors: AI-driven advisory platforms provide portfolio management, asset allocation, and personalized investment advice for retail investors.
AI Trading Bots: Retail traders can leverage automated bots to execute trades based on algorithms.
Sentiment-Based Trading Apps: Apps analyze social media sentiment and news to provide trading signals.
Retail adoption of AI trading has grown exponentially, allowing smaller investors to compete more effectively in financial markets.
8. The Future of AI in Trading
The future of trading is intertwined with AI. Key trends likely to shape AI trading include:
Integration of Quantum Computing: Accelerating AI model training and improving prediction accuracy.
Hybrid Models: Combining human judgment with AI analytics for optimal decision-making.
Ethical AI and Transparency: Regulators will demand explainable AI models to prevent unfair advantages and ensure market integrity.
Cross-Market AI Systems: AI will simultaneously analyze equities, commodities, forex, and crypto markets to identify arbitrage and hedging opportunities.
AI in ESG Investing: AI can assess environmental, social, and governance factors to guide sustainable investment decisions.
As AI continues to evolve, it will not only enhance trading efficiency but also reshape how markets operate globally.
Conclusion
AI trading represents a paradigm shift in financial markets, transforming how data is analyzed, trades are executed, and risks are managed. By combining speed, precision, and predictive power, AI allows traders—both institutional and retail—to make smarter, more informed decisions. However, successful AI trading requires robust infrastructure, high-quality data, careful risk management, and continuous monitoring to navigate challenges effectively.
The ongoing convergence of AI, big data, and financial markets promises a future where trading is faster, smarter, and increasingly automated, while still requiring human oversight to ensure ethical and strategic decision-making.

New Policies in the Indian Trade Market1. Launch of the Foreign Trade Policy (FTP) 2023–2028
In March 2023, the Government of India unveiled the new FTP, effective from April 1, 2023. This policy introduces several strategic initiatives:
Automation and Digitalization: The FTP emphasizes process re-engineering and automation to facilitate ease of doing business for exporters. It also focuses on emerging areas like dual-use high-end technology items under SCOMET, facilitating e-commerce export, and collaborating with States and Districts for export promotion.
One-Time Amnesty Scheme: To streamline operations, the FTP introduces a one-time Amnesty Scheme for exporters to close old pending authorizations and start afresh.
Support for MSMEs: The policy aims to support Micro, Small, and Medium Enterprises (MSMEs) by reducing the minimum export requirement for recognition as a status holder, allowing smaller exporters to achieve higher status and access benefits that lower transaction costs. Additionally, user charges under popular schemes like Advance Authorization and EPCG have been capped at ₹5,000, making it more affordable for MSMEs to export.
2. Enhancement of Export Incentives
The FTP 2023 introduces several measures to boost export incentives:
Remission of Duties and Taxes on Export Products (RoDTEP): The policy aims to enhance the RoDTEP scheme, which reimburses exporters for duties and taxes previously not refunded, thereby making Indian products more competitive in international markets.
Export Promotion Capital Goods (EPCG) Scheme: The FTP proposes to simplify the EPCG scheme, allowing exporters to import capital goods at zero customs duty, provided they meet specified export obligations.
Market Access Initiatives: The policy focuses on identifying and accessing new markets, particularly in regions like Africa, Latin America, and Southeast Asia, to diversify India's export destinations.
3. Promotion of E-Commerce Exports
Recognizing the growing importance of digital trade, the FTP 2023 outlines measures to promote e-commerce exports:
Simplification of Procedures: The policy aims to simplify customs procedures for e-commerce exports, reducing compliance burdens for small and medium-sized enterprises (SMEs).
Integration with Digital Platforms: The FTP encourages integration with global e-commerce platforms, facilitating easier access to international markets for Indian exporters.
Support for Startups: The policy provides support for startups engaged in e-commerce exports, including financial incentives and capacity-building programs.
4. Strengthening of Free Trade Agreements (FTAs)
India is actively pursuing and strengthening FTAs to enhance its trade relations:
India–EFTA Free Trade Agreement: The India–EFTA Free Trade Agreement, officially called the Trade and Economic Partnership Agreement (TEPA), is a comprehensive trade pact between the European Free Trade Association (EFTA) states (Iceland, Liechtenstein, Norway, and Switzerland) and the Republic of India. It was signed on March 10, 2024, after 16 years of intermittent negotiations, and is scheduled to enter into force on October 1, 2025. The agreement aims to eliminate or reduce tariffs on the majority of goods traded between India and the EFTA countries and to liberalize trade in services and investment. It also incorporates commitments on sustainable development and includes an unprecedented investment pledge of $100 billion from the EFTA side to India over 15 years.
India–UK Free Trade Agreement: Negotiations for an FTA with the United Kingdom are progressing, with expectations to finalize the agreement within the year. This FTA aims to boost bilateral trade and investment between the two nations.
5. Implementation of Anti-Dumping Measures
To protect domestic industries from unfair trade practices, India is implementing anti-dumping measures:
Solar Cell Imports: The Indian Commerce Ministry has proposed the imposition of an anti-dumping duty on solar cell imports from China for a duration of three years. This recommendation aims to protect domestic solar cell manufacturers from the adverse effects of low-cost Chinese imports, which are seen as a threat to local industry amid the rapid expansion of India's renewable energy sector.
Other Sectors: The government is reviewing other sectors for potential anti-dumping measures to safeguard domestic industries from unfair competition.
6. Digitalization of Trade Processes
The Indian government is focusing on digitalizing trade processes to enhance efficiency:
E-Bond System in Maharashtra: The Maharashtra government has introduced an electronic bond ('e-bond') system to replace traditional stamp paper bonds in import and export transactions. Launched on Friday, this digital initiative aims to streamline trade procedures, enhance business efficiency, and contribute to the modernization of the state's economy. The new system is expected to accelerate trade operations by increasing transparency and reducing reliance on physical documentation.
The Times of India
National Digital Trade Platform: The government is developing a National Digital Trade Platform to integrate various stakeholders in the trade ecosystem, including exporters, importers, logistics providers, and government agencies, to facilitate seamless trade operations.
7. Revised Foreign Borrowing Regulations
To enhance funding access for Indian companies, the Reserve Bank of India (RBI) has proposed significant changes to the country's corporate foreign borrowing regulations:
Increased Borrowing Limits: Companies would be allowed to borrow up to $1 billion or 300% of their net worth—whichever is higher—replacing the previous automatic route limit of $1.5 billion, which required specific approval for larger sums.
Removal of Cost Caps: The RBI intends to scrap cost caps on most external commercial borrowings (ECBs), allowing market-based interest rates rather than fixed ceilings aligned with global benchmarks.
Broadened Eligibility: Reforms would broaden the eligibility for both borrowers and lenders, permitting all India-incorporated entities, including those under financial restructuring or investigation, to raise overseas debt. Entities undergoing restructuring would require an approved resolution plan, while those under investigation must provide sufficient disclosures. Previously, only entities eligible for foreign direct investment could access foreign borrowings.
8. Simplification of Taxation for Foreign Firms
To improve the ease of doing business for foreign companies operating in India, NITI Aayog has proposed an optional presumptive taxation scheme:
Presumptive Taxation Scheme: NITI Aayog has proposed an optional presumptive taxation scheme for permanent establishments (PEs) of foreign companies operating in India. The goal of this proposal is to reduce bureaucratic discretion, minimize legal disputes, streamline compliance procedures, and safeguard government revenue. The simplified tax framework is expected to improve the ease of doing business for foreign firms in India, making the tax system more predictable and less cumbersome.
Conclusion
India's trade policy reforms in 2025 signify a strategic shift towards greater integration with the global economy, enhanced competitiveness, and a more conducive environment for businesses. By focusing on automation, digitalization, protective measures for domestic industries, and simplified regulatory frameworks, India is positioning itself as a formidable player in international trade. These initiatives are expected to not only boost exports but also attract foreign investment, thereby contributing to sustained economic growth and development.

Regulatory & Policy Developments1. Introduction to Regulatory and Policy Developments
At the core, regulation refers to rules and directives issued by governing bodies to control, manage, or guide the conduct of businesses, markets, and economic participants. Policy, on the other hand, represents a broader framework of principles, strategies, and guidelines that guide decision-making in government, financial institutions, and corporations.
Key Objectives of Regulations and Policies
Market Stability: Regulations prevent market volatility and systemic risk, ensuring investor confidence.
Consumer Protection: Policies safeguard consumers from fraudulent practices, misleading information, and financial exploitation.
Transparency and Accountability: Regulatory frameworks require disclosure of financial information, promoting trust in institutions.
Economic Growth and Innovation: Policies can stimulate sectors, attract investments, and encourage innovation through incentives or guidelines.
Risk Management: Regulations manage risks in banking, finance, and corporate sectors, reducing chances of crises.
Regulations and policies are intertwined, often evolving with changing economic environments, technological advancements, and societal needs. Their impact is felt across every segment of the economy, from financial markets and corporate governance to labor markets and international trade.
2. Historical Evolution of Regulatory and Policy Frameworks
Global Perspective
The evolution of regulations globally has been shaped by crises, technological advancements, and policy reforms. Key milestones include:
Early 20th Century: Following financial panics like the 1907 crisis in the U.S., regulatory mechanisms emerged to stabilize markets.
The Great Depression (1929): The collapse of stock markets led to the Securities Act of 1933 and Securities Exchange Act of 1934 in the United States, establishing the SEC (Securities and Exchange Commission).
Post-War Era: Economic rebuilding prompted regulatory frameworks focusing on industrial development, labor rights, and social welfare.
Late 20th Century: Globalization and technological progress led to reforms in trade, banking, and securities markets.
Post-2008 Financial Crisis: The crisis highlighted risks in financial derivatives, complex banking products, and inadequate oversight, resulting in stringent reforms like Dodd-Frank Act (USA) and Basel III (Global Banking Standards).
Indian Regulatory History
India’s regulatory and policy framework has evolved gradually to balance growth and stability:
Pre-Independence: Limited formal regulations; trade largely unregulated with colonial economic policies.
Post-Independence Era (1947-1990): Emphasis on industrial licensing, import substitution, and financial control through entities like RBI, SEBI, and IRDAI.
Economic Liberalization (1991 Onwards): Liberalization, privatization, and globalization (LPG reforms) spurred regulatory modernization.
Recent Decades: Introduction of Goods and Services Tax (GST), Insolvency and Bankruptcy Code (IBC, 2016), and fintech regulations reflects India’s adaptation to global standards.
3. Types of Regulatory and Policy Developments
Regulations and policies vary across sectors, targeting specific objectives. Broadly, they can be classified into the following categories:
a. Financial Market Regulations
Securities Regulations: Governing stock exchanges, mutual funds, IPOs, and listed companies.
Example: SEBI regulations for market intermediaries and investor protection.
Banking and Finance Regulations: Ensuring capital adequacy, liquidity, and prudent lending.
Example: RBI’s Basel III implementation for Indian banks.
Insurance and Pension Policies: Protecting policyholders and promoting long-term savings.
Example: IRDAI regulations for insurance products.
b. Corporate Governance Policies
Disclosure Requirements: Mandating periodic reporting of financial statements.
Board Composition and Ethical Standards: Ensuring accountability in corporate management.
Fraud Prevention Measures: Detecting and preventing insider trading and market manipulation.
c. Trade and Economic Policies
Industrial Policies: Encouraging investment and promoting priority sectors.
Foreign Direct Investment (FDI) Regulations: Defining limits and approvals for international investments.
Export-Import Policies: Facilitating global trade and ensuring balance-of-payments stability.
d. Technological and Digital Regulations
Data Protection Policies: Protecting consumer privacy and personal information.
Example: Personal Data Protection Bill (India)
Fintech Regulations: Governing digital payments, cryptocurrencies, and blockchain adoption.
Cybersecurity Policies: Ensuring safe digital infrastructure in banking and corporate sectors.
e. Environmental and Sustainability Policies
Environmental Regulations: Reducing carbon emissions, pollution, and promoting clean technologies.
Sustainability Reporting: Mandating ESG (Environmental, Social, Governance) disclosures by corporates.
Renewable Energy Incentives: Policies promoting green energy and sustainable investments.
4. Key Regulatory Developments Globally
a. United States
Dodd-Frank Wall Street Reform (2010): Post-2008 financial crisis reform aimed at reducing systemic risk.
Sarbanes-Oxley Act (2002): Strengthened corporate governance and transparency after corporate scandals (Enron, WorldCom).
Federal Reserve Policies: Monetary regulations influencing liquidity, interest rates, and bank supervision.
b. European Union
MiFID II (2018): Financial market transparency, investor protection, and trading standards.
GDPR (2018): Comprehensive data protection and privacy regulations.
EU Sustainable Finance Regulations: ESG disclosures, green finance taxonomy, and risk assessments.
c. Asia-Pacific
China’s Financial Market Reforms: Liberalization of stock exchanges, fintech regulations, and digital currency issuance.
Japan’s Corporate Governance Code (2015): Focused on board independence, shareholder rights, and sustainable growth.
5. Key Regulatory Developments in India
a. Financial Market Reforms
SEBI (Securities and Exchange Board of India) Regulations
IPO norms, insider trading prevention, mutual fund oversight.
Emphasis on investor protection and market integrity.
RBI Banking Reforms
Basel III norms, asset quality review, and digital banking initiatives.
Insurance Sector
IRDAI’s solvency regulations and customer grievance redressal frameworks.
b. Corporate Governance and Compliance
Companies Act 2013
Mandates board independence, audit committees, CSR activities, and disclosure norms.
Insider Trading Regulations
Strengthened to deter market manipulation and unethical practices.
c. Trade and Economic Policies
FDI Policy Reforms
Liberalized norms across sectors, including defense, telecom, and retail.
GST Implementation (2017)
Unified indirect tax system improving ease of doing business.
Make in India Initiative
Policy to boost domestic manufacturing and attract global investors.
d. Technology and Digital Regulations
Fintech and Digital Payments
NPCI (National Payments Corporation of India) overseeing UPI, digital wallets, and payments security.
Cryptocurrency Policy
RBI and government regulations balancing innovation with risk containment.
Data Privacy and Protection
Draft bills addressing consumer data security and corporate responsibilities.
e. Environmental and ESG Policies
Mandatory CSR Reporting
Companies above a threshold must allocate profits for social development.
Green Finance Policies
Encouraging investment in renewable energy, clean technology, and sustainable infrastructure.
Carbon Emission Norms
Industries must comply with emission limits, promoting low-carbon technologies.
6. Impact of Regulatory and Policy Developments
a. Positive Impacts
Market Confidence and Stability
Strong regulations reduce uncertainty, attracting both domestic and foreign investments.
Consumer Protection
Policies prevent exploitation, fraud, and unfair practices.
Promoting Innovation
Incentives and supportive policies encourage startups, fintech, and green technology.
Global Integration
Alignment with global standards boosts international trade and capital inflows.
b. Challenges and Limitations
Regulatory Overreach
Excessive compliance costs can stifle small businesses.
Lag Between Policy and Implementation
Enforcement gaps often reduce effectiveness.
Technological Disruption
Rapid fintech, AI, and blockchain developments require constant regulatory adaptation.
Global Uncertainties
Trade wars, geopolitical tensions, and international regulatory divergence can impact domestic policies.
Conclusion
Regulatory and policy developments are essential pillars of modern economies. They ensure market stability, protect consumers, foster innovation, and integrate domestic economies with the global framework. The landscape of regulations is continuously evolving, influenced by crises, technological advancements, and societal needs. Countries like India are modernizing their regulatory architecture to promote transparency, efficiency, and sustainability while balancing growth and innovation.
Looking forward, the key to effective regulation lies in adaptability, technology integration, and a balance between control and freedom. Policymakers, regulators, businesses, and investors must collaborate to ensure a robust framework that fosters economic growth, protects stakeholders, and prepares the economy for future challenges. Regulatory and policy development is not just a compliance exercise—it is a strategic enabler for sustainable and inclusive economic progress.
Indian Stock Market Trends1. Introduction: Understanding the Indian Stock Market
The Indian stock market is one of the fastest-growing and most dynamic financial markets globally. Comprising the Bombay Stock Exchange (BSE) and the National Stock Exchange (NSE) as its two primary platforms, it serves as the barometer of India’s economic health. Over the last three decades, India has witnessed transformative changes in its stock market driven by economic liberalization, technological advancements, regulatory reforms, and global market integration.
The market plays a critical role in mobilizing domestic savings, enabling companies to raise capital, and providing investors with opportunities to grow wealth. Its growth is intrinsically linked to economic cycles, policy decisions, corporate earnings, and investor sentiment. Over time, the Indian stock market has evolved from a predominantly retail and family-controlled ownership pattern to a sophisticated ecosystem influenced by domestic institutional investors (DIIs), foreign institutional investors (FIIs), and algorithmic trading.
2. Historical Context: How the Market Evolved
The Indian stock market’s evolution can be divided into four phases:
2.1 Pre-Liberalization Era (Before 1991)
Before India’s economic liberalization, the stock market was relatively small and dominated by a few family-owned business groups. Market participation was limited, transparency was low, and regulatory frameworks were underdeveloped. Price manipulation and insider trading were common, and trading volumes were minimal.
2.2 Post-Liberalization Boom (1991–2000)
With the 1991 economic reforms, India opened up to foreign investments, reduced government controls, and encouraged private enterprise. The introduction of the NSE in 1992 brought transparency, electronic trading, and nationwide access. The market became more structured, attracting foreign capital and retail investors. The late 1990s saw the IT boom, which contributed to significant stock market growth, with indices such as the BSE Sensex gaining widespread attention.
2.3 Consolidation and Global Integration (2000–2010)
During this period, the Indian market became more integrated with global financial markets. The rise of derivative products, mutual funds, and increased institutional participation transformed the market into a more sophisticated environment. The 2008 global financial crisis impacted Indian equities, but the market’s resilience was evident in its recovery, highlighting growing domestic investor confidence.
2.4 Technological Transformation and Retail Participation (2010–Present)
The proliferation of digital trading platforms, discount brokers, and mobile apps has democratized market access, enabling retail investors to play a significant role. The introduction of exchange-traded funds (ETFs), algorithmic trading, and structured products has further diversified trading strategies. India’s equity market now reflects a mix of retail exuberance, institutional strategy, and global capital flows.
3. Current Trends in the Indian Stock Market
3.1 Index Performance and Volatility
The two primary indices, Sensex and Nifty 50, provide an overview of market performance:
Sensex, consisting of 30 of the largest and most actively traded stocks on the BSE, represents the performance of established blue-chip companies.
Nifty 50 tracks 50 major companies across 13 sectors on the NSE, offering a broader market perspective.
Trends Observed:
Bullish Momentum: Over the last decade, Indian markets have seen sustained growth due to economic reforms, infrastructure expansion, and corporate earnings growth.
Volatility Episodes: Global events like the COVID-19 pandemic, US Federal Reserve rate hikes, and geopolitical tensions caused sharp but often temporary volatility.
Sectoral Rotation: There is frequent rotation between sectors like IT, FMCG, banking, and energy, reflecting both domestic growth patterns and global demand cycles.
3.2 Sectoral Performance
Sectoral trends often drive broader market movements. Key sectors include:
Information Technology (IT):
IT companies like TCS, Infosys, and Wipro benefit from global digital transformation.
Revenue is influenced by foreign exchange fluctuations, client budgets, and global tech adoption.
Banking and Financial Services:
The BFSI sector contributes heavily to Sensex and Nifty 50 indices.
Trends are driven by credit growth, NPAs, policy reforms, and RBI rate decisions.
Energy and Commodities:
Reliance, ONGC, and Coal India drive energy sector performance.
Crude oil price movements and global commodity cycles directly impact profitability and stock prices.
Consumer Goods and FMCG:
Companies like Hindustan Unilever and Nestle thrive on domestic consumption patterns.
Market performance often reflects rural demand, inflation, and discretionary spending trends.
Pharmaceuticals and Healthcare:
Companies such as Sun Pharma and Dr. Reddy’s benefit from global demand, patent expirations, and regulatory approvals.
Healthcare reforms and medical tourism trends also impact sector valuations.
Emerging Sectors:
Electric vehicles (EVs), renewable energy, and fintech are gaining prominence in stock market valuations.
Investors are increasingly participating in IPOs of tech-driven start-ups, especially under the SME and unicorn segment.
3.3 IPO and FII Trends
Initial Public Offerings (IPOs):
The Indian IPO market has been vibrant, particularly in technology, fintech, and consumer sectors.
Retail participation is growing, fueled by online subscription platforms and easier access.
Foreign Institutional Investors (FIIs):
FIIs influence market liquidity, especially in large-cap stocks.
Capital inflows from FIIs are often cyclical and react to global interest rates, US market trends, and geopolitical developments.
Domestic Institutional Investors (DIIs):
Mutual funds, insurance companies, and pension funds are increasingly dominant players.
DIIs often act as stabilizers during FII outflows.
3.4 Retail Participation and Behavioral Trends
Retail investors have become a key driver of market liquidity:
Digital Trading Platforms: Zerodha, Groww, Upstox, and others have made investing easy and low-cost.
Trend-Following Behavior: Retail investors often follow market sentiment, resulting in high volatility during short-term rallies.
SIP Investments: Systematic Investment Plans in mutual funds have attracted long-term domestic capital to equity markets.
Behavioral finance studies indicate that retail participation can both amplify bullish trends during optimism and exacerbate corrections during fear-driven sell-offs.
3.5 Regulatory and Policy Impacts
The Indian stock market’s trends are strongly influenced by regulatory interventions:
SEBI (Securities and Exchange Board of India):
Enforces transparency, prevents insider trading, and regulates corporate governance.
Initiatives like T+1 settlement, margin requirements, and circuit breakers have enhanced market stability.
RBI Policies:
Interest rate decisions impact bank stocks, debt yields, and overall market sentiment.
Government Initiatives:
Policies like Make in India, Digital India, and infrastructure development have sectoral and index-level impacts.
Taxation reforms, including GST implementation and dividend taxation changes, influence market psychology.
4. Market Drivers and Influencers
Several internal and external factors shape Indian stock market trends:
4.1 Macroeconomic Indicators
GDP growth, inflation rates, industrial production, and employment data directly affect investor sentiment.
India’s strong demographic dividend and rising middle class support long-term equity consumption trends.
4.2 Corporate Earnings
Earnings growth in sectors like IT, banking, FMCG, and energy drives stock valuations.
Companies with robust fundamentals attract long-term investment despite short-term volatility.
4.3 Global Market Integration
India’s market is increasingly influenced by US market trends, oil prices, currency fluctuations, and geopolitical risks.
Events such as US Fed rate hikes or China’s economic policies have immediate ripple effects on capital inflows.
4.4 Technological Advancement
Algorithmic and high-frequency trading now contributes significantly to daily volumes.
Fintech innovation is democratizing access to equities, ETFs, and derivatives, increasing retail participation.
5. Long-term Trends and Market Outlook
5.1 Structural Growth
India’s stock market is expected to benefit from long-term structural growth factors:
Urbanization and rising disposable incomes.
Expansion of the digital economy.
Rising financial literacy leading to higher market participation.
5.2 Sectoral Shift
Technology, EVs, renewable energy, healthcare, and consumer goods are expected to dominate market growth.
Traditional sectors like oil & gas, steel, and banking will continue to remain core drivers but may face cyclicality.
5.3 ESG Investing
Environmental, Social, and Governance (ESG) investing is gaining traction among institutional and retail investors.
Companies with strong ESG credentials are increasingly receiving premium valuations.
5.4 Volatility and Risk Management
The market remains susceptible to global shocks, policy changes, and liquidity fluctuations.
Investors are adopting diversified portfolios, derivative hedging, and algorithmic strategies to manage risk.
6. Challenges and Risks
While the Indian stock market presents immense opportunities, it faces challenges:
Market Volatility: Triggered by global economic shocks or domestic policy changes.
Corporate Governance Issues: Despite SEBI oversight, lapses can lead to temporary erosion of investor confidence.
Liquidity Concerns: Small-cap stocks often experience lower liquidity, creating price inefficiencies.
Behavioral Biases: Retail investors’ herd mentality can cause speculative bubbles.
7. Conclusion
The Indian stock market is a reflection of the country’s economic aspirations, structural transformation, and global integration. From a small, opaque market in the 1980s to a technologically advanced, globally linked marketplace today, the evolution has been remarkable. The current trends—dominated by technology-driven trading, sectoral rotations, rising retail participation, and regulatory enhancements—point towards a robust future trajectory.
Investors must remain vigilant of macroeconomic shifts, policy interventions, and global cues while capitalizing on India’s long-term growth story. Strategic investment, risk management, and sectoral diversification will be key to navigating the opportunities and challenges in India’s evolving equity landscape.

Cross-Market Arbitrage Opportunities1. Understanding Cross-Market Arbitrage
Arbitrage is the simultaneous buying and selling of an asset to profit from price differences in different markets or forms. Cross-market arbitrage occurs when an asset, security, or derivative is traded across two or more markets (such as stock exchanges, commodity markets, or currency markets), and a trader exploits the temporary price mismatch.
1.1 Basic Concept
Imagine a stock listed on two exchanges—say, Exchange A and Exchange B. If the stock trades at $100 on Exchange A but $102 on Exchange B, a trader could theoretically buy at $100 on Exchange A and sell at $102 on Exchange B, locking in a risk-free profit of $2 per share (ignoring transaction costs). This opportunity exists because markets are not perfectly efficient at all times. Cross-market arbitrage seeks to exploit such temporary inefficiencies.
1.2 Importance in Financial Markets
Cross-market arbitrage contributes to:
Market efficiency: By exploiting price differences, arbitrageurs help align prices across markets.
Liquidity enhancement: Arbitrage strategies increase trading activity and liquidity.
Risk management: Investors use cross-market arbitrage in hedging strategies to manage exposure to price fluctuations.
2. Types of Cross-Market Arbitrage
Cross-market arbitrage can be categorized based on the types of assets, markets, and instruments involved. Below are the most common types:
2.1 Stock Arbitrage Across Exchanges
Stocks listed on multiple exchanges often exhibit price discrepancies due to differences in trading hours, liquidity, and investor behavior.
Example: An Indian company’s stock listed both on the NSE (National Stock Exchange) and BSE (Bombay Stock Exchange). If NSE trades at ₹1,000 and BSE at ₹1,005, arbitrageurs can buy on NSE and sell on BSE simultaneously.
2.2 Currency Arbitrage
Foreign exchange markets provide cross-market opportunities when the same currency pair trades at slightly different rates in different markets.
Triangular arbitrage is a common method, where traders exploit discrepancies among three currencies in different forex markets.
Example: USD/INR trades at 83.50 in New York and 83.60 in London. Buying USD in New York and selling in London can yield a profit.
2.3 Commodity Arbitrage
Commodities like gold, oil, and agricultural products are often traded in multiple markets. Price differences can arise due to storage costs, transportation costs, and market demand.
Example: Gold trades at $1,900 per ounce on the London Bullion Market and $1,905 in Mumbai. Traders can buy in London and sell in Mumbai after accounting for transaction costs.
2.4 Derivative and Futures Arbitrage
Arbitrage opportunities exist between the spot market and the futures market or across derivative exchanges.
Cash-and-carry arbitrage is a common example where traders buy an underlying asset in the spot market and sell futures contracts if the futures price is overpriced relative to the spot price.
Reverse cash-and-carry occurs when futures are underpriced.
3. Mechanics of Cross-Market Arbitrage
To execute a cross-market arbitrage strategy, traders follow these steps:
3.1 Identify Price Discrepancies
The first step is to monitor multiple markets and identify assets trading at different prices. Sophisticated traders use algorithmic systems, real-time data feeds, and market scanners to detect these differences within milliseconds.
3.3 Simultaneous Execution
Cross-market arbitrage requires executing buy and sell orders almost simultaneously to avoid market risk (the risk of prices changing before both trades are completed). This is often achieved through:
High-frequency trading (HFT) algorithms
Direct market access (DMA) platforms
Automated trading bots
3.4 Risk Management
Even “risk-free” arbitrage carries risks such as:
Execution risk
Liquidity risk
Regulatory restrictions
Currency or settlement risk in international markets
Professional arbitrageurs hedge these risks using derivatives or diversification strategies.
4. Popular Cross-Market Arbitrage Strategies
4.1 Dual-Listed Stock Arbitrage
Concept: Exploit price differences in a stock listed on two exchanges.
Example: Infosys Ltd., dual-listed in India and the US as ADRs (American Depository Receipts). Traders can arbitrage price differences between NSE/BSE and NYSE markets.
4.2 Index Arbitrage
Concept: Exploit differences between a stock index and its futures contract.
Mechanism: If the futures price is higher than the fair value implied by the index, traders buy the index components and sell futures simultaneously.
4.3 Cross-Currency Arbitrage
Triangular arbitrage involves three currencies. For instance, if USD/INR, USD/EUR, and EUR/INR exchange rates are misaligned, traders can make a profit by converting currencies sequentially.
4.4 Commodity Arbitrage
Traders exploit price discrepancies in commodities across global exchanges, often factoring in shipping, storage, and hedging costs.
Example: Oil traded in NYMEX versus Brent crude in ICE Europe.
4.5 Derivative Arbitrage
Exploiting differences between options, futures, and underlying assets.
Example: Convertible bond arbitrage, where traders hedge the bond portion and speculate on the stock portion to lock profits.
5. Advantages of Cross-Market Arbitrage
Risk-Adjusted Returns: Offers relatively low-risk profits when executed correctly.
Market Efficiency: Aligns prices across markets, reducing mispricing.
Liquidity Generation: Arbitrage trading increases market depth.
Diversification: Arbitrage can diversify an investor’s portfolio by introducing trades that are market-neutral.
Predictability: Unlike directional trades, arbitrage profits rely on price discrepancies rather than market trends.
6. Challenges and Risks
Despite being considered “low-risk,” cross-market arbitrage has challenges:
6.1 Execution Risk
Delays in order execution can erase profits. Markets move quickly, so any lag can turn an arbitrage opportunity into a loss.
6.2 Transaction Costs
Trading fees, broker commissions, and taxes can reduce or nullify arbitrage gains.
6.3 Liquidity Risk
Insufficient market liquidity can prevent traders from executing trades at desired prices.
6.4 Regulatory Risk
Different countries have distinct trading rules and capital controls, especially for cross-border arbitrage.
6.5 Currency Risk
For international arbitrage, fluctuations in exchange rates can impact profits.
6.6 Competition
High-frequency trading firms and institutional players dominate cross-market arbitrage, making it less accessible for retail traders.
7. Future Trends
AI-Powered Arbitrage: AI models will identify patterns and predict mispricings with greater accuracy.
Blockchain and Cryptocurrencies: Cross-exchange crypto arbitrage is gaining traction due to high volatility and fragmented exchanges.
Global Market Integration: Increased connectivity may reduce arbitrage opportunities but also create short-lived micro-opportunities.
Retail Access: As technology becomes more accessible, retail investors may participate in smaller-scale arbitrage.
8. Conclusion
Cross-market arbitrage is a sophisticated, yet fundamentally simple, trading strategy that capitalizes on temporary price discrepancies across markets. It requires speed, precision, and careful risk management. While large institutional players dominate this space, technology is gradually enabling wider participation.
Arbitrage benefits markets by enhancing efficiency, improving liquidity, and contributing to price discovery. However, it is not without risks. Transaction costs, execution delays, and regulatory hurdles are significant challenges. Understanding the mechanics, types, and tools of cross-market arbitrage is essential for traders seeking to profit in an increasingly competitive global market.
Ultimately, successful cross-market arbitrage combines market insight, technological proficiency, and disciplined execution, making it a cornerstone strategy for risk-conscious investors in the 21st century.

How to trade in the Right Trend - Beginners guide
How to Identify a Trend in a Chart?
Here's a practical breakdown of trend identification methods:
1. Price Structure Method (Most Fundamental)
Uptrend:
- Series of Higher Highs (HH) and Higher Lows (HL)
- Each peak is higher than the previous peak
- Each trough is higher than the previous trough
Downtrend:
- Series of Lower Highs (LH) and Lower Lows (LL)
- Each peak is lower than the previous peak
- Each trough is lower than the previous trough
Sideways/Range:
- Price oscillates between horizontal support and resistance
- No clear higher highs/lows or lower highs/lows
2. Moving Averages
Simple Rules:
- Price consistently above MA = Uptrend
- Price consistently below MA = Downtrend
- Price crossing back and forth = No clear trend
Popular MAs:
- 20 EMA (short-term)
- 50 SMA (medium-term)
- 200 SMA (long-term)
Golden Cross/Death Cross:
- 50 MA crosses above 200 MA = Bullish trend signal
- 50 MA crosses below 200 MA = Bearish trend signal
3. Trendline Method
Drawing Trendlines:
- Uptrend: Connect at least 2 higher lows with a straight line
- Downtrend: Connect at least 2 lower highs with a straight line
- The more touches, the stronger the trendline
- Price respecting the trendline confirms trend strength
4. Multi-Timeframe Analysis
The Complete Picture:
- Weekly chart: Overall market direction
- Daily chart: Intermediate trend
- 4H/1H chart: Entry timing
Rule: Always trade in the direction of the higher timeframe trend
#5. Indicators for Confirmation
ADX (Average Directional Index):
- Above 25 = Strong trend
- Below 20 = Weak/no trend
- Doesn't show direction, only strength
MACD:
- Histogram above zero = Uptrend
- Histogram below zero = Downtrend
- Crossovers signal potential trend changes
RSI:
- Consistently above 50 = Uptrend
- Consistently below 50 = Downtrend
6. Volume Confirmation
Healthy Trends Show:
- Rising volume on moves in trend direction
- Declining volume on corrections/pullbacks
- Volume spikes at breakout points
Quick Checklist for Trend Identification:
✅ Strong Uptrend:
- Higher highs and higher lows
- Price above rising moving averages
- Valid upward trendline intact
- ADX above 25
- Increasing volume on rallies
✅ Strong Downtrend:
- Lower highs and lower lows
- Price below falling moving averages
- Valid downward trendline intact
- ADX above 25
- Increasing volume on declines
⚠️ No Clear Trend (Stay Out):
- Choppy price action
- MAs flat or intertwined
- ADX below 20
- Price between support/resistance
Common Beginner Mistakes:
❌ Looking at only one timeframe
❌ Ignoring the bigger picture
❌ Trading every small wiggle as a "trend"
❌ Not waiting for confirmation
❌ Confusing corrections with reversals
Pro Tips:
💡 **The 3-Touch Rule:** A trend becomes more reliable after price respects a trendline at least 3 times
💡 **Trend is Your Timeframe:** What's an uptrend on daily might be a pullback on weekly
💡 **When in Doubt, Zoom Out:** Higher timeframes show the true direction
💡 **Trade WITH the trend, not against it:** Counter-trend trades have lower probability
**Remember:** Trend identification isn't about being perfect - it's about being on the right side of the market more often than not. Start with the basics (higher highs/lows), then add confirmation tools as you gain experience.
More updates with examples and Explanation on individual topics in a easy way to understand.
Unlocking India’s Derivative Power1. Introduction: The Rise of Derivatives in India
Derivatives have existed in some form for centuries, initially in agriculture and commodities, enabling farmers and merchants to hedge price risk. In India, derivatives gained prominence after the economic liberalization in the 1990s. The National Stock Exchange (NSE) launched equity derivatives in 2000, followed by commodity derivatives on the Multi Commodity Exchange (MCX) and the National Commodity & Derivatives Exchange (NCDEX).
The core appeal of derivatives lies in risk management. Investors and institutions can hedge against price volatility, speculate for gains, or arbitrage price inefficiencies across markets. India’s derivatives market, although smaller than developed economies, has shown exponential growth, both in volume and diversity.
2. Understanding Derivatives: Types and Functions
Derivatives in India primarily fall into four categories:
2.1 Futures Contracts
Futures are standardized agreements to buy or sell an underlying asset at a predetermined price on a specific future date. They exist across equity, index, commodity, currency, and interest rate segments. Futures are widely used for hedging and speculative purposes. For example, a farmer can hedge against falling crop prices using commodity futures.
2.2 Options Contracts
Options give the buyer the right, but not the obligation, to buy (call option) or sell (put option) an asset at a specified price before or on the expiration date. Options are highly versatile for hedging, income generation, and portfolio protection. In India, options trading is active in equities, indices, currencies, and commodities.
2.3 Currency Derivatives
Currency derivatives help manage foreign exchange risk. With globalization and rising trade, Indian businesses increasingly rely on currency futures and options to hedge against volatility in USD/INR, EUR/INR, and other currency pairs.
2.4 Interest Rate Derivatives
Interest rate derivatives, including forwards, swaps, and futures, are used by banks, corporates, and investors to manage interest rate exposure. They have become crucial with rising corporate borrowing and government debt issuance.
3. The Current Landscape of India’s Derivative Markets
India’s derivative markets have evolved significantly, both in depth and sophistication.
3.1 Equity Derivatives
Equity derivatives, including stock and index futures and options, dominate India’s derivative ecosystem. NSE’s Nifty 50 futures and options are among the most traded globally. Retail participation has increased, driven by online platforms, algorithmic trading, and financial literacy.
3.2 Commodity Derivatives
MCX and NCDEX facilitate trading in gold, silver, crude oil, agricultural commodities, and base metals. Commodity derivatives allow businesses and investors to manage price risk efficiently while attracting speculative interest that enhances liquidity.
3.3 Currency and Forex Derivatives
With India’s integration into the global economy, currency derivatives have become indispensable. Corporates hedging imports and exports, banks managing reserves, and traders speculating on exchange rates collectively make this segment robust.
3.4 Institutional Participation
Foreign institutional investors (FIIs), mutual funds, insurance companies, and banks actively participate in India’s derivative markets. Their involvement improves liquidity, market efficiency, and price discovery.
4. Regulatory Framework: Building Confidence
A strong regulatory framework underpins India’s derivative markets. Key authorities include:
Securities and Exchange Board of India (SEBI): Regulates equity and currency derivatives to ensure investor protection, transparency, and risk mitigation.
Forward Markets Commission (FMC): Historically regulated commodity derivatives, now merged with SEBI for unified oversight.
Reserve Bank of India (RBI): Regulates currency derivatives and interest rate products.
SEBI has implemented measures such as position limits, margin requirements, and reporting obligations to curb systemic risk and promote market integrity. Such frameworks instill confidence among investors and institutions.
5. Unlocking Derivative Power: Strategies and Opportunities
To fully unlock the power of derivatives in India, market participants need to embrace innovation, strategic usage, and risk awareness.
5.1 Hedging and Risk Management
Derivatives allow businesses, investors, and traders to hedge against market volatility. For example:
A corporates hedging foreign currency exposure.
Farmers locking in commodity prices.
Investors protecting equity portfolios through index options.
Hedging creates stability in returns, making businesses and markets more resilient.
5.2 Speculation for Returns
Speculators provide liquidity and contribute to efficient price discovery. Traders using futures, options, and spreads can generate profits based on market expectations. While speculation involves risk, disciplined strategies can significantly enhance wealth.
5.3 Arbitrage Opportunities
Derivatives provide avenues for arbitrage—exploiting price differences across markets or between underlying assets and derivatives. For example, mispricing between Nifty spot and futures creates riskless profit opportunities. Efficient arbitrage strengthens market integrity and narrows spreads.
5.4 Portfolio Diversification
Derivatives facilitate exposure to diverse asset classes without directly holding them. Investors can gain exposure to commodities, currencies, and indices efficiently, enhancing portfolio diversification and risk-adjusted returns.
5.5 Leveraging Technology
Algorithmic trading, AI-driven analytics, and data modeling enhance derivative trading efficiency. Institutional and retail investors can use sophisticated models to optimize hedging, detect opportunities, and manage risks in real-time.
6. Challenges in India’s Derivative Market
While potential is vast, India’s derivative ecosystem faces several challenges:
6.1 Low Awareness and Education
Despite growth, a large segment of retail investors lacks knowledge about derivative usage and risk management. This gap often leads to misuse and losses.
6.2 Market Volatility
Derivatives amplify market volatility. Without proper risk management, leveraged positions can lead to systemic shocks or investor losses.
6.3 Regulatory Complexity
Compliance with SEBI, RBI, and tax regulations can be cumbersome. Frequent changes require active adaptation, which can be challenging for smaller participants.
6.4 Limited Access in Certain Segments
Currency, interest rate, and commodity derivatives remain underutilized by retail investors and SMEs due to lack of exposure, awareness, and platform accessibility.
7. Unlocking Derivative Power for SMEs and Retail Investors
Small and medium enterprises (SMEs) and retail investors form a large portion of India’s economy. Leveraging derivatives can empower them:
SMEs: Can hedge raw material costs, forex exposure, and interest rate risks, ensuring stable cash flows.
Retail Investors: Can use options for risk management, generate additional income via covered calls, or hedge equity portfolios.
Education programs, simplified platforms, and advisory services can accelerate adoption.
8. Technological Innovations Driving Growth
India’s derivative markets are increasingly powered by technology:
Algorithmic Trading: Automated strategies enhance efficiency, speed, and accuracy.
AI & Data Analytics: Predictive models improve risk assessment and market forecasts.
Blockchain & Smart Contracts: Can enhance transparency, settlement efficiency, and reduce counterparty risk in derivative contracts.
9. Global Comparison and India’s Potential
Compared to developed markets like the US, derivatives penetration in India remains lower. For example:
Equity derivatives turnover in India is high, but options and exotic instruments are less prevalent.
Commodity derivatives offer tremendous growth potential, especially in agri-commodities where hedging is limited.
Unlocking India’s derivative power can align the country with global financial practices, attract foreign investment, and enhance market sophistication.
10. Risk Management and Responsible Trading
While derivatives offer leverage and profit potential, they carry inherent risks:
Leverage Risk: Small price movements can lead to large gains or losses.
Liquidity Risk: Some contracts may lack adequate liquidity, leading to slippage.
Counterparty Risk: Though exchanges mitigate this via clearinghouses, OTC contracts carry higher risk.
Systemic Risk: Excessive speculative positions can destabilize markets.
Prudent risk management strategies, margin discipline, diversification, and regulatory compliance are essential to sustainably unlock derivative power.
Conclusion: A New Era of Financial Empowerment
India’s derivative market represents a formidable yet underutilized resource. By combining technology, education, regulatory oversight, and strategic usage, India can unlock the true power of derivatives. Properly harnessed, derivatives will not only stabilize risks and enhance returns but also position India as a global financial hub with sophisticated market infrastructure.
For investors, traders, and businesses alike, understanding and using derivatives responsibly is key to unlocking wealth, managing risk, and driving long-term economic growth. India stands at the threshold of a financial revolution, where derivatives can transform market efficiency, liquidity, and resilience—ushering in a new era of economic empowerment.
Option Trading SecretsPart 1: Understanding Options – The Foundation of Secrets
1.1 What Are Options?
Options are financial derivatives that give the holder the right, but not the obligation, to buy or sell an asset at a predetermined price (strike price) before a certain date (expiry). There are two main types:
Call Options: Right to buy.
Put Options: Right to sell.
Secret Insight: Many traders fail because they focus on “predicting direction” rather than understanding the time value and volatility embedded in options prices.
1.2 Components of an Option
Strike Price – The predetermined price of the underlying asset.
Expiry Date – The date the option contract expires.
Premium – The price paid to buy the option.
Intrinsic Value – The value if exercised today.
Time Value – Additional value due to the time left until expiry.
Secret Insight: Time decay (Theta) is often overlooked. Successful option traders exploit time decay instead of fighting against it.
1.3 Why Trade Options?
Leverage: Small capital controls large positions.
Flexibility: Can profit in bullish, bearish, or neutral markets.
Hedging: Protects your stock portfolio against losses.
Income Generation: Selling options (writing calls/puts) can create steady cash flow.
Secret Insight: Most beginners try to predict market direction, while pros focus on probability, risk management, and strategic positioning.
Part 2: Core Option Trading Secrets
2.1 Volatility – The Hidden Force
Volatility is the heartbeat of option pricing.
Implied Volatility (IV): Market’s forecast of future volatility.
Historical Volatility (HV): Past price movement.
Secret Insight: Options are more expensive when IV is high. Selling options in high IV periods and buying in low IV periods can increase success probability.
2.2 The Greeks – Your Secret Weapons
Understanding the Greeks is crucial:
Delta: Sensitivity to underlying price.
Gamma: Rate of change of Delta.
Theta: Time decay effect.
Vega: Sensitivity to volatility.
Rho: Sensitivity to interest rates.
Secret Insight: Most traders obsess over price prediction. Successful traders control risk by managing Greeks, not just by buying/selling calls or puts.
2.3 The Myth of Directional Trading
While buying calls in a bullish market or puts in a bearish market is intuitive, it’s often a losing strategy if done without:
Timing
Volatility awareness
Strike price selection
Secret Insight: Many profits come from neutral strategies that capitalize on time decay or volatility changes.
Part 3: Advanced Option Strategies – Secrets of the Pros
3.1 Spreads – Reducing Risk and Cost
Vertical Spread: Buy and sell options of the same type and expiry but different strikes.
Horizontal/Calendar Spread: Exploit time decay differences.
Diagonal Spread: Combines vertical and horizontal spreads for advanced hedging.
Secret Insight: Spreads reduce cost and risk while keeping profit potential. Many retail traders ignore them, chasing naked options for huge gains and ending up in losses.
3.2 Iron Condors & Butterflies – Secrets for Range-Bound Markets
Iron Condor: Sell OTM calls and puts, buy further OTM options to hedge risk.
Butterfly Spread: Profit from minimal movement around a target price.
Secret Insight: The real secret is managing position size and probability. Profitable options trading often comes from small, consistent wins rather than rare big wins.
3.3 Protective Strategies – Hedging Like a Pro
Protective Puts: Own stock but buy puts to limit downside.
Covered Calls: Own stock and sell calls to generate income.
Secret Insight: The best traders treat options primarily as insurance and income tools, not just speculation.
Part 4: Risk Management Secrets
4.1 Position Sizing
Never risk more than 1–2% of capital on a single trade.
Adjust size based on volatility and Greeks.
Secret Insight: Even the best strategies fail without disciplined capital management.
4.2 Avoiding Common Traps
Buying deep OTM options as “lottery tickets.”
Ignoring IV crush after earnings.
Over-leveraging and underestimating Theta decay.
Secret Insight: Most traders fail psychologically before failing technically. Emotional control is a secret weapon.
4.3 The Power of Probability
Options trading isn’t gambling—it’s about stacking probabilities in your favor.
Favor high probability setups with defined risk.
Accept small consistent profits over chasing massive gains.
Part 5: Market Timing Secrets
5.1 Earnings and Events
Options react violently to earnings, FOMC, or geopolitical events.
Secret Insight: Use spreads or iron condors around events rather than naked buying. This controls risk while keeping upside potential.
5.2 Using Technical Analysis
Support/resistance levels, trend lines, and moving averages can guide strike selection.
Combine technicals with implied volatility for high-probability trades.
Secret Insight: Pros don’t blindly buy calls and puts—they combine technical triggers with probability and volatility analysis.
5.3 Psychological Edge
Patience beats impulsiveness.
Accept losses quickly; let winners run within limits.
Secret Insight: Trading psychology, discipline, and emotional control are the ultimate secrets that most books don’t emphasize.
Part 6: Building a System – From Secrets to Strategy
6.1 Developing a Personal Edge
Track historical trades and analyze winning patterns.
Identify setups where probability favors you.
Stick to trades that fit your risk tolerance.
6.2 Journaling & Review
Record each trade: entry, exit, rationale, and outcome.
Evaluate mistakes objectively.
Secret Insight: The market doesn’t care about your emotions. Your edge grows from systematic review and refinement.
6.3 Continuous Learning
Study options pricing models, volatility surfaces, and macro events.
Attend webinars, read research reports, and adapt strategies.
Conclusion
Option trading secrets are not magic formulas; they are disciplined habits:
Understanding volatility and Greeks.
Using spreads and hedges to control risk.
Managing position sizes and emotions.
Timing trades around probability and technical setups.
Constant learning and adaptation.
By mastering these secrets, traders can transform options trading from risky speculation to a high-probability, strategic, and disciplined pursuit.
Advanced Hedging Techniques in Modern Financial Markets1. Introduction to Hedging
Hedging, at its core, is about reducing risk without necessarily eliminating profit opportunities. Businesses, investors, and financial institutions face multiple types of risks:
Market risk: Price fluctuations in equities, commodities, or currencies.
Interest rate risk: Changes in rates affecting bonds or loans.
Credit risk: Counterparty default in financial contracts.
Operational and systemic risk: Broader business or financial system risks.
Advanced hedging strategies aim not only to mitigate these risks but also to optimize cost efficiency, capital utilization, and portfolio resilience.
2. Basic Hedging vs Advanced Hedging
Before diving into advanced techniques, it is important to differentiate:
Basic Hedging: Simple instruments such as forward contracts, futures, or plain vanilla options are used. For example:
Buying a currency forward contract to lock in exchange rates.
Selling stock futures to protect against equity price decline.
Advanced Hedging: Complex strategies that combine multiple instruments, dynamic adjustments, quantitative models, or derivative overlays. These methods are suitable for institutional investors, large corporates, and hedge funds. Advanced hedging can involve:
Dynamic hedging using options “Greeks” (delta, gamma, vega, theta).
Cross-asset hedging using correlated instruments.
Volatility-based hedging using derivatives.
Multi-layered portfolio insurance techniques.
3. Advanced Hedging Techniques
3.1 Delta Hedging
Delta hedging is an options-based strategy to neutralize the price risk of an underlying asset.
Delta (Δ) measures how much an option’s price moves for a one-unit change in the underlying asset.
By holding a position in the underlying asset opposite to the delta of the option, traders can achieve delta neutrality, reducing directional risk.
Example:
If an investor holds a call option with a delta of 0.6 on 100 shares of a stock, the option position is equivalent to owning 60 shares. To hedge, the investor might short 60 shares, neutralizing exposure.
Advantages:
Protects against small price movements.
Can be dynamically adjusted for changing delta (“dynamic delta hedging”).
Challenges:
Requires frequent rebalancing.
Transaction costs can accumulate.
Gamma risk remains (sensitivity of delta to price changes).
3.2 Gamma and Vega Hedging
After delta, advanced hedgers consider gamma and vega:
Gamma (Γ): Measures the rate of change of delta concerning the underlying price. Gamma hedging ensures that the delta remains stable as the asset price fluctuates.
Vega (ν): Measures sensitivity to volatility. Vega hedging protects against market volatility swings.
Application:
Options traders often construct multi-leg positions (spreads, straddles, strangles) to hedge gamma and vega risks.
This is particularly useful in volatile markets where price swings and implied volatility can affect option premiums.
3.3 Cross-Hedging
When a perfect hedge instrument is unavailable, cross-hedging is used:
It relies on the correlation between two assets.
Example: Hedging oil price exposure with energy sector ETFs or related futures.
Considerations:
Requires statistical analysis of correlation coefficients.
Basis risk exists because correlations may not remain stable.
3.4 Currency and Interest Rate Hedging
For multinational firms, FX risk and interest rate risk are significant.
Currency Hedging Techniques:
Forward contracts: Lock exchange rates for future transactions.
Currency options: Protect against adverse moves while retaining upside.
Currency swaps: Exchange cash flows in different currencies over time.
Interest Rate Hedging:
Swaps: Exchange fixed-rate payments for floating-rate to manage interest rate exposure.
Caps and floors: Protect against rising or falling rates without eliminating potential gains.
Duration matching: Aligning asset and liability durations to neutralize rate sensitivity.
3.5 Volatility and Volatility Trading as Hedge
Advanced traders treat volatility itself as a tradable hedge:
Volatility Index Futures/Options (e.g., VIX): Hedging equity portfolios against sudden market swings.
Variance swaps: Enable direct exposure to volatility; gains offset portfolio losses in volatile markets.
Correlation trading: Using instruments where the correlation structure changes to protect portfolios.
3.6 Portfolio Insurance
Portfolio insurance techniques aim to cap downside while maintaining upside:
Protective Put Strategy:
Buy put options on an equity portfolio.
Losses are limited to the strike price, preserving potential gains.
CPPI (Constant Proportion Portfolio Insurance):
Dynamically adjusts exposure between risky and risk-free assets.
Ensures portfolio never falls below a pre-defined floor.
Option Overlay Strategies:
Use a combination of calls, puts, and spreads on existing holdings.
Provides flexibility, cost optimization, and risk control.
3.7 Commodity Hedging Techniques
Commodities have unique risks such as seasonal volatility, geopolitical shocks, and storage costs:
Basis Hedging: Hedging the difference between spot and futures prices.
Spread Hedging: Using one commodity contract to hedge another (e.g., Brent vs WTI crude).
Weather Derivatives: Protect against crop loss or energy demand fluctuations due to weather.
3.8 Dynamic Hedging Using Quantitative Models
Modern hedgers increasingly rely on quantitative models:
Stochastic modeling: Simulate multiple price paths to determine optimal hedge ratios.
Monte Carlo simulations: Assess the probability distribution of portfolio outcomes under various hedge strategies.
Machine learning: Predict volatility, correlation shifts, and optimal hedge rebalancing points.
These methods allow adaptive hedging, where strategies evolve as markets change.
3.9 Exotic Derivatives in Hedging
Exotic derivatives provide tailored risk mitigation:
Barrier options: Activate or deactivate when underlying hits certain levels.
Lookback options: Allow locking the best/worst prices historically.
Asian options: Average underlying prices reduce volatility risk in hedging.
Exotics are expensive but allow precise hedging in complex scenarios.
3.10 Hedging with ETFs and Index Products
For large portfolios, ETFs, index futures, and inverse ETFs provide broad exposure hedging:
Protect against sectoral or market-wide declines.
Low transaction cost and high liquidity.
Can be combined with options to create synthetic hedges.
3.11 Risk Parity and Multi-Asset Hedging
Advanced portfolios often apply risk parity principles:
Allocate capital based on risk contribution, not nominal allocation.
Use derivatives to hedge dominant risks while maintaining exposure to growth assets.
Example: Combine equity, bond, commodity, and FX derivatives to balance overall portfolio volatility.
4. Strategic Considerations in Advanced Hedging
Cost Efficiency: Hedging is not free; premiums, spreads, and transaction costs matter.
Dynamic Adjustment: Hedge ratios must evolve with market conditions.
Correlation and Basis Risk: Imperfect hedges can introduce unintended exposures.
Regulatory Compliance: Certain hedges may have accounting, tax, or reporting implications.
Liquidity Management: Highly illiquid instruments can increase hedging risk.
5. Case Studies in Advanced Hedging
5.1 Equity Portfolio Hedging
A $500 million equity portfolio uses delta-neutral options, volatility derivatives, and index futures to mitigate downside while retaining growth.
5.2 Commodity Exporter Hedging
A global oil producer uses cross-hedging, swaps, and weather derivatives to stabilize revenue across multiple markets.
5.3 Multinational Corporate FX Hedging
A tech giant uses currency swaps, forward contracts, and exotic options to manage exposure across 10+ currencies while minimizing hedging costs.
6. Benefits and Limitations of Advanced Hedging
Benefits
Risk reduction tailored to portfolio needs.
Preserves upside potential while limiting downside.
Enhances confidence for institutional and corporate planning.
Enables strategic investment in volatile environments.
Limitations
High complexity requiring expertise.
Costs can erode portfolio returns if overused.
Model and counterparty risk in derivative contracts.
Dynamic adjustments can be operationally intensive.
7. Future Trends in Hedging
AI-Driven Hedging: Machine learning models optimizing hedge ratios in real-time.
Cross-Asset and ESG Hedging: Incorporating climate risk and sustainability-linked instruments.
Blockchain and Tokenized Derivatives: Increasing transparency and accessibility for hedging instruments.
Integration with Risk Analytics: Hedging becomes a holistic portfolio management tool rather than a reactive measure.
8. Conclusion
Advanced hedging techniques are no longer optional for sophisticated investors and corporations—they are central to risk management in a volatile, interconnected world. By leveraging derivatives, dynamic models, exotic instruments, and cross-asset strategies, market participants can control downside risk, stabilize returns, and navigate complex financial landscapes efficiently. While advanced hedging requires expertise, costs, and constant vigilance, it remains a cornerstone of modern portfolio and corporate risk management.
Indian SME IPOs: High Rewards Amidst High RisksPart 1: Introduction to SME IPOs in India
Small and Medium Enterprises (SMEs) are the backbone of India’s economy, contributing significantly to employment, GDP, and innovation. Recognizing their importance, the Indian government and capital markets have encouraged SMEs to access public funding through Initial Public Offerings (IPOs). Unlike traditional IPOs on the main board, SME IPOs are specifically designed to allow smaller companies to raise capital efficiently while offering retail and institutional investors opportunities to participate in potentially high-growth ventures.
Definition and Characteristics of SME IPOs
SME IPOs are offerings of equity by small and medium enterprises listed on the SME segment of recognized stock exchanges, primarily the BSE SME and NSE Emerge platforms. The eligibility criteria for SMEs include:
Minimum net worth and profitability standards.
A track record of at least two years of operations.
Compliance with corporate governance standards.
SME IPOs typically have a lower investment size compared to mainboard IPOs, making them accessible to retail investors. The minimum application amount is often around ₹1–2 lakh, while the maximum may vary depending on the issue size.
Why SMEs Go Public
SMEs pursue IPOs for several reasons:
Capital for Expansion: SME IPOs provide companies with funds to expand operations, invest in new technology, or enter new markets.
Brand Visibility: Listing enhances a company’s visibility and credibility among clients, suppliers, and investors.
Liquidity and Exit Opportunities: Founders, early investors, and venture capitalists gain a structured exit route.
Attract Talent: A public listing makes it easier to offer stock options and attract skilled professionals.
Potential for High Rewards
SME IPOs are high-risk, high-reward opportunities. Unlike established companies, SMEs operate in niche markets or emerging sectors, meaning a successful IPO can yield significant returns. Historically, some SME IPOs have delivered returns of 50–200% within a year of listing, attracting speculative and growth-focused investors. However, it’s important to note that the risks are also higher, including market volatility, limited liquidity, and operational challenges.
Conclusion of Part 1
The SME IPO segment offers a unique avenue for investors seeking exposure to high-growth, smaller companies in India. With regulatory support, increasing investor awareness, and improved market infrastructure, SME IPOs are becoming a mainstream avenue for wealth creation.
Part 2: Regulatory Framework and Listing Process
The growth of SME IPOs in India has been facilitated by clear regulatory frameworks established by SEBI (Securities and Exchange Board of India) and the stock exchanges. These frameworks ensure investor protection while promoting SME participation in public markets.
SEBI Guidelines for SME IPOs
SEBI has set distinct rules for SMEs to streamline the IPO process:
Companies must have a post-issue capital of at least ₹10 crore.
Mandatory appointment of a merchant banker to manage the issue.
Submission of a prospectus detailing financials, business model, risks, and future plans.
Listing on SME platforms like BSE SME or NSE Emerge, not the mainboard initially.
The IPO Process for SMEs
The process for an SME IPO typically includes:
Appointment of Merchant Banker: To ensure compliance with SEBI regulations and guide the company through the listing process.
Preparation of Draft Prospectus: Includes financial statements, growth plans, risk factors, and use of IPO proceeds.
SEBI Approval: Draft prospectus is submitted to SEBI for review and approval.
Pricing and Marketing: The IPO can be priced via fixed price or book-building route. SMEs often use book-building to determine fair value.
IPO Launch and Subscription: Investors, including retail and institutional, subscribe to the shares during the IPO period.
Listing: Once shares are allotted, they get listed on SME platforms, enabling trading and liquidity.
Investor Protection Measures
Despite being high-growth, high-risk investments, SME IPOs incorporate measures for investor protection:
Disclosure of risk factors and financials.
Requirement of a market maker to maintain liquidity.
SEBI guidelines for lock-in periods for promoters, reducing the risk of sudden sell-offs.
Conclusion of Part 2
A strong regulatory framework ensures transparency, investor confidence, and orderly growth of the SME IPO market. Understanding this framework helps investors evaluate the potential risks and rewards before committing capital.
Part 3: Factors Driving High Returns in SME IPOs
High returns in SME IPOs are driven by a combination of market dynamics, company fundamentals, and investor sentiment.
1. Growth Potential of SMEs
Many SMEs operate in emerging sectors such as technology, renewable energy, healthcare, and specialty manufacturing. These sectors have higher growth potential compared to mature industries, making them attractive for investors seeking exponential returns.
2. Market Inefficiencies and Speculation
SME stocks often have lower liquidity, creating price inefficiencies. Early investors who identify strong companies can benefit from rapid price appreciation after listing.
3. Promoter Credibility and Track Record
A promoter’s experience, credibility, and operational success significantly influence investor confidence. Companies with visionary leadership tend to perform better post-IPO, often rewarding early investors.
4. Favorable Economic Conditions
Macroeconomic factors like GDP growth, low interest rates, and government incentives for SMEs can amplify returns. For instance, policies promoting Make in India or technology adoption can increase SME valuations.
5. Undervalued Offerings
SME IPOs often carry lower valuations compared to mainboard companies. Investors with careful fundamental analysis can identify undervalued opportunities poised for growth.
6. Role of Market Makers
BSE and NSE mandate market makers for SME stocks, ensuring continuous buying and selling, which can reduce volatility and provide price support during initial trading days.
Conclusion of Part 3
High returns in SME IPOs are a result of the interplay between intrinsic company value, sector growth potential, market sentiment, and regulatory mechanisms. However, investors must exercise caution and due diligence to avoid speculative pitfalls.
Part 4: Risks and Challenges in Investing in SME IPOs
While SME IPOs promise high rewards, they are accompanied by unique risks that investors must understand.
1. Limited Operational Track Record
SMEs often have shorter business histories. Any operational misstep, market slowdown, or competitive threat can significantly impact profitability and share price.
2. Lower Liquidity
SME stocks trade on smaller platforms with fewer participants, leading to thin order books. This can result in higher price volatility and difficulty in exiting positions quickly.
3. Market Volatility
SME IPOs are more sensitive to broader market swings. Even positive company performance may not prevent stock prices from falling during bearish market conditions.
4. Regulatory and Compliance Risks
Although SEBI regulates SME IPOs, non-compliance, reporting delays, or governance lapses can affect investor confidence and share performance.
5. Sector-Specific Risks
Many SMEs operate in niche sectors that may face rapid technological changes, policy shifts, or demand fluctuations, affecting long-term sustainability.
6. Overvaluation at Listing
Due to hype, some SME IPOs may be overpriced relative to fundamentals, exposing investors to short-term losses post-listing.
Risk Mitigation Strategies
Diversification: Avoid concentrating capital in one SME IPO.
Fundamental Analysis: Study financials, business model, and growth prospects.
Monitor Market Maker Activity: Ensure liquidity support is sufficient.
Long-Term Perspective: SME IPOs often perform better over 1–3 years than in the immediate post-listing period.
Conclusion of Part 4
Understanding risks is critical for balancing potential high rewards. While SME IPOs can deliver significant returns, careful due diligence, prudent investment size, and long-term perspective are essential to mitigate inherent risks.
Part 5: Strategies for Successful Investment in SME IPOs
Investors can maximize rewards from SME IPOs by combining research, timing, and portfolio management strategies.
1. Identifying Promising SMEs
Focus on companies with:
Strong fundamentals and consistent revenue growth.
Experienced promoters with proven track records.
Products or services in emerging or high-demand sectors.
2. Timing and Market Sentiment
Investors should monitor:
IPO subscription trends: Oversubscription indicates strong demand.
Market conditions: Bullish markets often favor strong listing gains.
Listing day performance and early trading trends for post-IPO opportunities.
3. Diversification Across Sectors
Investing in multiple SME IPOs across different industries reduces sector-specific risk and increases chances of capturing high-growth opportunities.
4. Leveraging Advisory Services
Merchant bankers, financial analysts, and SEBI-registered advisors can provide insights into valuation, risk factors, and listing prospects.
5. Long-Term Investment Approach
While short-term gains are possible, many SME IPOs achieve substantial growth over 1–3 years. Investors focusing on long-term growth can benefit from compounding returns and company expansion.
6. Monitoring Post-Listing Performance
After listing, track:
Quarterly financial results.
Market share growth and competitive positioning.
Promoter activity and adherence to corporate governance.
7. Exit Strategies
Plan exits based on valuation targets or fundamental deterioration. Avoid panic selling during short-term market volatility.
Conclusion of Part 5
SME IPOs represent a compelling opportunity for investors willing to take calculated risks. By combining careful research, diversification, long-term vision, and active monitoring, investors can participate in India’s growth story and potentially achieve high rewards from the SME IPO segment.
Overall Conclusion
Indian SME IPOs are a vibrant, high-potential segment that balances risk with opportunity. Regulatory support, growth potential, and market mechanisms make it possible for investors to reap significant rewards, provided they adopt disciplined investment strategies. By understanding the nuances, risks, and strategies discussed, investors can confidently navigate the SME IPO landscape in India.
