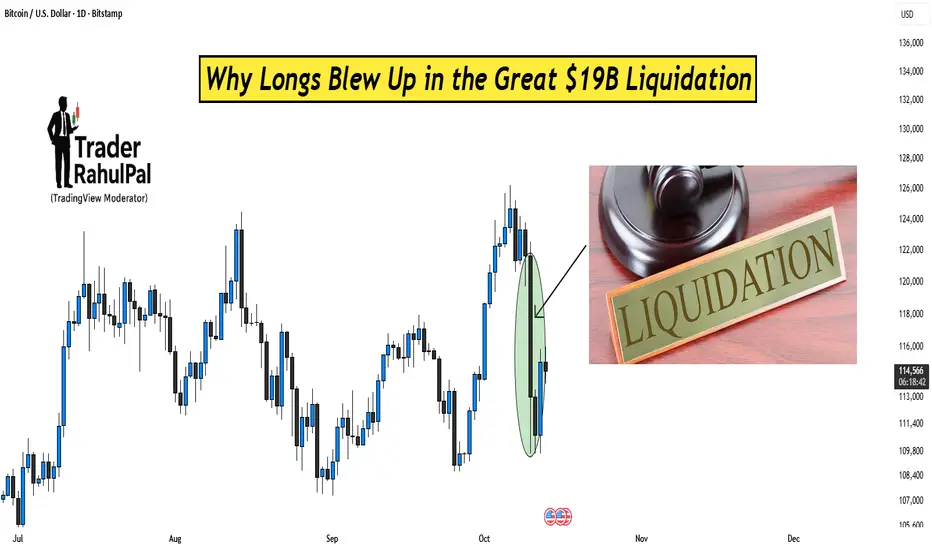
Why Longs Blew Up in the Great $19B Liquidation?Hello Traders!
Recently, crypto markets witnessed one of the biggest shakeouts in history, a $19 billion liquidation that wiped out long traders across Bitcoin, Ethereum, and altcoins in just a few hours.
Everyone called it a “crash,” but what really happened was a classic case of leverage, greed, and poor risk management colliding. Let’s break down the truth behind it.
1. Excessive Leverage Builds the Trap
During bullish phases, traders pile into long positions with 25x, 50x, or even 100x leverage.
The higher the leverage, the smaller the move needed to wipe you out.
Even a 1–2% drop in price can liquidate millions worth of positions instantly.
When too many traders are leveraged in the same direction, the market becomes top-heavy and unstable.
2. Liquidity Hunt – The Smart Money Move
Big players know where the retail stop losses and liquidation points sit, usually below obvious support levels.
They push price just far enough to trigger those liquidations.
Once the forced selling begins, it cascades, creating a chain reaction that accelerates the fall.
It’s not manipulation; it’s how liquidity flows work in leveraged markets.
3. The Domino Effect of Liquidations
When one big position gets liquidated, it triggers auto-sell orders.
Those sells push prices lower, causing more positions to get liquidated.
In minutes, you see billions vanish as exchanges auto-close overleveraged longs.
That’s exactly what created the $19B wipeout, a domino collapse fueled by forced exits.
4. How to Avoid Becoming the Next Victim
Use leverage only if you can handle losing that position completely.
Keep your stop loss and margin buffer wide enough to survive small swings.
Never risk more than 1–2% of your account on a single trade.
And most importantly, don’t chase FOMO entries near resistance levels.
Rahul’s Tip:
Leverage isn’t evil, greed is .
The same tool that builds accounts can destroy them if used recklessly.
In crypto, survival is the real skill, because only survivors get the next bull run.
Conclusion:
The Great $19B liquidation was not random, it was the market teaching a painful lesson about leverage and discipline.
If you want to last long in this game, learn to respect risk before chasing reward.
If this post helped you understand what really happened, like it, share your view in comments, and follow for more realistic market breakdowns!
Community ideas
gold📊 Gold Daily — Bullish Momentum in Focus
Gold has been climbing steadily since mid-2024, forming a clean ascending channel.
The recent surge since September came with rising volume — a strong signal of increased buying interest and momentum.
Between June and August, we saw healthy consolidation with lower volume, suggesting accumulation before the breakout.
Now, all eyes are on the upper channel resistance.
If price breaks above it with strong volume, the rally could extend toward $4,200 and beyond — targeting measured moves or extrapolated resistance zones.
But if price gets rejected at the top, a correction may follow.
Key support levels to watch:
🔸 $3,800 (mid-channel)
🔸 $3,400 (lower boundary)
This setup offers a clear roadmap for both breakout traders and risk-aware swing strategies.
#Gold #TechnicalAnalysis #PriceAction #TradingSetup #VolumeAnalysis #MarketStructure #Commodities #LearningInPublic

Part 9 Trading Master Class With Experts Option Chain and Market Data
Traders analyze the option chain—a table showing available strikes, premiums, and open interest.
Key Insights from Option Chain:
Open Interest (OI):
High OI at a strike → strong support or resistance zone.
Change in OI:
Helps identify where traders are building positions.
Put-Call Ratio (PCR):
Indicator of market sentiment.
PCR > 1 → bullish sentiment; PCR < 1 → bearish.
Option chain analysis helps identify market bias, expected ranges, and potential breakout zones.

Part 8 Trading Master Class With Experts How Option Pricing Works
Option pricing is complex because it depends on many variables. The most commonly used model is the Black-Scholes Model, which calculates the theoretical value of options based on several factors:
Underlying asset price
Strike price
Time to expiration
Volatility
Interest rates
Dividends (if any)
Volatility
This is the most important factor in option pricing.
High volatility means the underlying asset price can move significantly, increasing the chance that the option becomes profitable.

Part 7 Trading Master Class With Experts Factors That Affect Option Trading Decisions
When trading options, traders must analyze several aspects beyond just price direction:
Market Volatility: Options thrive on volatility. High volatility increases premiums.
Time to Expiry: The closer to expiry, the faster time decay (Theta effect).
Trend and Technical Analysis: Price patterns, volume, and support/resistance levels guide strike selection.
Implied Volatility (IV): It reflects the market’s expectation of future movement.
Events: Earnings announcements, policy decisions, and global news can move volatility and price sharply.
A skilled trader combines these factors with proper strategy and money management.

Part 6 Learn Institutional Trading Key Terminology in Option Trading
Before diving deeper, let’s understand some crucial terms used in options:
Underlying Asset: The financial instrument (like a stock, index, or commodity) on which the option is based.
Strike Price (Exercise Price): The price at which the underlying asset can be bought (for a call) or sold (for a put).
Expiration Date: The date when the option contract ends. After this date, the option becomes worthless if not exercised.
Option Premium: The price paid by the buyer to the seller for acquiring the option.
Intrinsic Value: The amount by which an option is in profit if exercised immediately.
Time Value: The extra value in the option premium due to time left before expiration.
In-the-Money (ITM): When the option already has intrinsic value (profitable if exercised now).
Out-of-the-Money (OTM): When the option has no intrinsic value.
At-the-Money (ATM): When the strike price equals the current market price of the underlying.
Example:
If a stock is trading at ₹1000 and you buy a call option with a strike price of ₹950, your option is in the money.
If you buy a call with a strike price of ₹1050, it’s out of the money.

Part 3 Learn Institutional Trading Introduction to Option Trading
Option trading is one of the most powerful tools in the financial markets. It allows traders and investors to speculate on price movements, hedge risks, and generate income in various market conditions. Unlike traditional stock trading—where you buy or sell shares directly—option trading gives you the right but not the obligation to buy or sell an asset at a predetermined price within a specified period.
In simple words, options give you flexibility. You can profit whether the market goes up, down, or stays flat—if you know how to use them properly. However, this flexibility also brings complexity. To understand option trading deeply, one needs to grasp how options work, the factors affecting their price, and the strategies traders use to make consistent returns.

Part 2 Ride The Big Moves Advantages of Option Trading
Leverage:
A small premium can control a large amount of the underlying asset.
Flexibility:
You can profit in bullish, bearish, or neutral markets using different strategies.
Defined Risk:
Option buyers’ risk is limited to the premium paid.
Income Generation:
Selling options can create consistent income streams through premiums.
Hedging:
Options protect existing positions against adverse price movements.

Part 1 Ride The Big Moves Hedging with Options
One of the most practical uses of options is hedging, which means reducing risk exposure in an existing portfolio.
For example, suppose you own 1,000 shares of Reliance Industries at ₹2,500 each. You worry about short-term market declines. You can buy put options with a strike price near ₹2,450.
If the price drops, your stock loses value — but the put option gains value, reducing your overall loss.
Similarly, farmers, exporters, and institutions often use options to lock in prices and protect against adverse moves in commodities, currencies, or interest rates.

Part 2 Intraday Master ClassThere are two main types of options — Call Options and Put Options.
a) Call Option
A Call Option gives the buyer the right (but not the obligation) to buy the underlying asset at a specified price (strike price) before the expiration date.
Buyers of call options are bullish — they expect the price of the asset to rise.
Sellers of call options are bearish or neutral — they believe the price will stay below the strike price.
b) Put Option
A Put Option gives the buyer the right to sell the underlying asset at a specific strike price before the expiration date.
Buyers of put options are bearish — they expect the price of the asset to fall.
Sellers of put options are bullish or neutral — they believe the price will stay above the strike price.

Part 1 Intraday Master ClassIntroduction to Option Trading
Option trading is one of the most dynamic, flexible, and powerful financial instruments in the modern market. It allows investors not only to profit from price movements but also to protect their portfolios, speculate, or earn regular income. Unlike buying stocks directly, options give traders the right but not the obligation to buy or sell an underlying asset (like a stock, index, or commodity) at a predetermined price within a certain time frame.

Technical Indicators 1. Introduction to Technical Indicators
Technical indicators are mathematical calculations based on historical price, volume, or open interest data. They are primarily used in technical analysis, a method of evaluating securities by analyzing market statistics rather than intrinsic value.
Indicators help traders:
Identify trends and reversals.
Determine momentum and market strength.
Recognize overbought or oversold conditions.
Generate buy or sell signals.
There are three main categories of technical indicators:
Trend Indicators – Identify the direction and strength of a trend.
Momentum Indicators – Measure the speed and force of price movements.
Volume Indicators – Analyze trading activity to confirm price movements.
Some indicators are leading, giving early signals of potential price movement, while others are lagging, confirming trends after they have started.
2. Trend Indicators
Trend indicators help traders identify whether an asset is moving upward, downward, or sideways. Recognizing trends early allows traders to align their strategies with the market direction.
2.1 Moving Averages (MA)
Moving averages smooth out price data to reveal trends over a specific period. There are two main types:
Simple Moving Average (SMA):
Calculated by averaging the closing prices over a specified period.
Example: A 50-day SMA sums the last 50 closing prices and divides by 50.
Exponential Moving Average (EMA):
Places more weight on recent prices, making it more responsive to price changes.
Applications:
Trend identification: Prices above the MA indicate an uptrend; below indicate a downtrend.
Crossovers: A short-term MA crossing above a long-term MA generates a bullish signal, and vice versa.
Limitations:
Lagging indicator, less effective in sideways markets.
2.2 Moving Average Convergence Divergence (MACD)
MACD measures the difference between two EMAs (usually 12-day and 26-day).
Components:
MACD Line: Difference between the fast and slow EMA.
Signal Line: 9-day EMA of the MACD line.
Histogram: Difference between MACD line and Signal line.
Interpretation:
Crossovers: MACD crossing above Signal line = buy signal; below = sell signal.
Divergence: Price making new highs while MACD fails indicates trend weakness.
Strengths:
Effective for spotting trend reversals and momentum shifts.
Weaknesses:
Lagging indicator; may give false signals in choppy markets.
2.3 Average Directional Index (ADX)
ADX measures the strength of a trend regardless of its direction.
Values above 25 indicate a strong trend.
Values below 20 suggest a weak trend or sideways market.
Applications:
Confirming trend strength before entering a trade.
Pairing with other indicators for trend-following strategies.
Limitations:
Does not indicate trend direction, only strength.
3. Momentum Indicators
Momentum indicators assess the speed of price movements, helping traders identify potential reversals or continuation patterns.
3.1 Relative Strength Index (RSI)
RSI measures the magnitude of recent price changes to evaluate overbought or oversold conditions.
Values above 70 = overbought (possible reversal or pullback).
Values below 30 = oversold (possible rebound).
Applications:
Divergence between RSI and price signals potential trend reversals.
Combining RSI with trend indicators enhances trade accuracy.
Limitations:
Can remain overbought or oversold for extended periods in strong trends.
3.2 Stochastic Oscillator
The stochastic oscillator compares a security’s closing price to its price range over a specific period.
%K Line: Current close relative to the high-low range.
%D Line: 3-period moving average of %K.
Interpretation:
Values above 80 = overbought; below 20 = oversold.
Crossovers of %K and %D lines indicate potential buy/sell signals.
Strengths:
Effective in volatile markets for timing entries and exits.
Weaknesses:
Less effective during strong trends; prone to false signals.
3.3 Rate of Change (ROC)
ROC measures the percentage change in price over a given period.
Positive ROC indicates upward momentum.
Negative ROC signals downward momentum.
Applications:
Identifying early trend reversals.
Confirming breakouts or breakdowns.
Limitations:
Sensitive to price spikes; may give false signals in choppy markets.
4. Volume Indicators
Volume analysis confirms price trends, as strong moves are typically accompanied by high volume.
4.1 On-Balance Volume (OBV)
OBV measures cumulative buying and selling pressure by adding volume on up days and subtracting volume on down days.
Applications:
Divergence between OBV and price can signal reversals.
Confirming trend strength.
Limitations:
Lagging indicator; requires combination with price analysis.
4.2 Chaikin Money Flow (CMF)
CMF measures the volume-weighted average of accumulation and distribution over a specified period.
Positive CMF = buying pressure.
Negative CMF = selling pressure.
Applications:
Identifying accumulation or distribution phases.
Supporting trade entries in trend-following strategies.
Weaknesses:
Less effective during low-volume periods.
5. Volatility Indicators
Volatility indicators help traders gauge market risk and potential price swings.
5.1 Bollinger Bands
Bollinger Bands consist of a moving average (middle band) and upper/lower bands based on standard deviation.
Price near upper band = overbought.
Price near lower band = oversold.
Applications:
Trading range-bound markets using band bounces.
Breakouts indicated when price moves outside bands.
Limitations:
Band breakouts don’t always result in sustained trends.
5.2 Average True Range (ATR)
ATR measures market volatility by calculating the average of true price ranges over a period.
Applications:
Setting stop-loss levels.
Identifying breakout potential.
Limitations:
Does not indicate trend direction, only volatility.
6. Combining Indicators for Strategy
Using a single indicator often results in false signals. Effective traders combine indicators from different categories:
Trend + Momentum:
Example: Use SMA to identify trend direction and RSI to detect overbought/oversold conditions.
Trend + Volume:
Example: Confirm trend strength with ADX and OBV before entering a trade.
Momentum + Volatility:
Example: Use MACD for momentum and ATR to set stop-loss levels.
Rule of Thumb:
Avoid indicators that provide the same information.
Mix leading and lagging indicators for better confirmation.
7. Indicator-Based Trading Strategies
7.1 Trend-Following Strategy
Use moving averages or ADX to identify trends.
Enter trades in the direction of the trend.
Use momentum indicators like MACD or RSI for entry timing.
7.2 Reversal Strategy
Use RSI, Stochastic, or Bollinger Bands to detect overbought/oversold conditions.
Look for divergence between price and indicator for potential reversals.
7.3 Breakout Strategy
Use Bollinger Bands or price channels to identify consolidation.
Volume indicators like OBV or CMF confirm breakout strength.
8. Common Mistakes in Using Indicators
Overloading charts: Too many indicators can confuse signals.
Ignoring market context: Indicators must be interpreted in conjunction with price action.
Blind reliance: No indicator guarantees success; risk management is crucial.
Neglecting timeframes: Indicators behave differently on daily, weekly, or intraday charts.
9. Advanced Indicator Techniques
Divergence Trading: Identifying differences between price and indicators like MACD or RSI to spot potential reversals.
Multiple Timeframe Analysis: Confirm signals from multiple timeframes to reduce false entries.
Weighted Indicators: Adjust indicator sensitivity to reduce lag or noise.
Algorithmic Integration: Using indicators as inputs in automated trading systems.
10. Choosing the Right Indicators
Factors to consider:
Trading style: Day traders vs. swing traders vs. long-term investors.
Market conditions: Trending vs. ranging markets.
Timeframe: Short-term indicators are more sensitive; long-term indicators reduce noise.
Simplicity: Choose a few reliable indicators rather than overwhelming charts.
11. Conclusion
Mastering technical indicators requires practice, observation, and discipline. While indicators provide valuable insights into market behavior, they are most effective when combined with strong risk management and a clear trading plan.
Successful traders:
Use indicators to enhance decision-making, not replace it.
Test strategies thoroughly before applying them in live markets.
Adapt indicator settings to suit different market conditions.
By understanding the nuances of trend, momentum, volume, and volatility indicators, traders can create robust strategies that increase probability and confidence in their trades. This Technical Indicators Masterclass equips traders with the knowledge to analyze markets effectively and navigate complex price movements with precision.
Momentum & Trend Following Strategies in TradingUnderstanding Momentum in Trading
Momentum refers to the rate at which the price of a financial instrument moves in a particular direction. Traders who adopt momentum strategies aim to buy assets showing upward momentum and sell assets showing downward momentum. The underlying assumption is that price trends, once established, tend to persist due to behavioral biases and institutional flows.
Key Concepts in Momentum Trading
Relative Strength: Momentum traders often compare the performance of an asset against its historical performance or a benchmark. Assets outperforming the market are considered candidates for buying, while underperforming assets may be sold or shorted.
Price Rate of Change (ROC): This measures the percentage change in an asset’s price over a specified period, helping traders identify accelerating trends.
Moving Averages & Crossovers: Traders use short-term and long-term moving averages to spot momentum. For instance, if a 20-day moving average crosses above a 50-day moving average, it signals upward momentum.
Breakouts: Momentum traders look for price breakouts from key resistance or support levels, often indicating the start of a strong directional move.
Volume Confirmation: A momentum move accompanied by higher trading volume suggests conviction and increases the probability of trend continuation.
Behavioral Rationale
Momentum is strongly linked to investor psychology. Behavioral biases such as herding, overconfidence, and delayed reaction to news contribute to the persistence of price trends. Market participants tend to chase rising assets, amplifying momentum, while undervalued or declining assets continue to fall as pessimism dominates sentiment.
Momentum Indicators
Several technical indicators are widely used in momentum trading:
Relative Strength Index (RSI): Measures the speed and change of price movements; helps identify overbought or oversold conditions.
Moving Average Convergence Divergence (MACD): Identifies trend direction and momentum strength.
Stochastic Oscillator: Compares a security’s closing price to its price range over a period, indicating momentum shifts.
Rate of Change (ROC): Quantifies the percentage change in price over a specified time frame.
Momentum strategies are typically short-to-medium-term, ranging from a few days to several months, depending on market conditions and the trader’s time horizon.
Understanding Trend Following
Trend following is a broader trading approach based on identifying and riding long-term directional movements in the market. Unlike momentum trading, which focuses on relative performance and price acceleration, trend following emphasizes sustained price movements regardless of speed. Trend followers aim to enter trades in the direction of the prevailing trend and exit when trends reverse.
Core Principles of Trend Following
Markets Trend More Often Than They Mean-Revert: Trend followers operate on the principle that markets, over medium to long-term periods, exhibit trends in response to macroeconomic factors, sentiment shifts, or institutional positioning.
Trading with the Market: Trend following is inherently reactive. Traders wait for clear signals from price movements rather than predicting reversals or tops and bottoms.
Risk Management and Position Sizing: Since trends can reverse unexpectedly, risk management is critical. Trend followers use stop losses, trailing stops, and controlled position sizes to protect capital.
Time Horizon: Trend-following strategies typically have longer holding periods than momentum strategies, ranging from weeks to months or even years in certain markets, such as commodities or forex.
Trend Following Indicators
Trend-following strategies rely heavily on technical indicators to identify the direction and strength of trends:
Moving Averages: Simple Moving Average (SMA) or Exponential Moving Average (EMA) crossovers are common trend signals. For example, a trader may buy when a shorter-term EMA crosses above a longer-term EMA.
Average Directional Index (ADX): Measures the strength of a trend regardless of direction; values above 25 often indicate a strong trend.
Bollinger Bands: Trend followers use bands to confirm price breakouts or sustained trends.
Parabolic SAR: Identifies potential trend reversals and helps with trailing stops.
Practical Implementation
Step 1: Market Selection
Both momentum and trend-following strategies can be applied across multiple markets, including:
Equities: Individual stocks or stock indices.
Forex: Currency pairs exhibiting strong directional movements.
Commodities: Metals, oil, and agricultural products.
Cryptocurrencies: Digital assets with high volatility and clear trends.
Step 2: Identifying Trends or Momentum
For momentum trading, rank assets based on recent performance, RSI, or ROC indicators.
For trend-following, analyze price charts for moving average crossovers, trendlines, or ADX confirmation.
Step 3: Entry and Exit Rules
Momentum Entry: Buy assets showing positive momentum or breaking above resistance; sell or short assets showing negative momentum.
Trend-Following Entry: Enter positions in the direction of the prevailing trend after confirmation from moving averages or trendlines.
Exit Rules: Use stop losses, trailing stops, or reversal signals to exit positions. Trend followers often ride trends until technical indicators signal a reversal.
Step 4: Risk Management
Risk management is critical for both strategies:
Position Sizing: Determine trade size based on account equity and risk tolerance (e.g., risking 1–2% per trade).
Diversification: Spread risk across multiple assets to reduce exposure to a single market.
Stop Losses: Protect capital from unexpected reversals.
Volatility Adjustment: Higher volatility assets may require tighter risk controls or smaller position sizes.
Advanced Strategy Variations
Dual Momentum: Combines relative and absolute momentum. Traders invest in assets with the strongest performance relative to others while ensuring they are positive in absolute terms.
Trend-Momentum Hybrid: Uses momentum indicators for entry and trend-following techniques for position management. For example, enter on RSI breakout but use moving averages to exit.
Sector Rotation: Momentum traders may rotate capital between sectors or asset classes based on relative performance trends.
Algorithmic and Systematic Approaches: Many hedge funds implement algorithmic momentum and trend-following strategies using quantitative models, high-frequency data, and machine learning for signal optimization.
Performance and Market Conditions
Momentum and trend-following strategies tend to perform differently depending on market conditions:
Trending Markets: Both strategies excel in strong, directional trends. Trend followers benefit from sustained moves, while momentum traders profit from short bursts of strong performance.
Choppy or Sideways Markets: Momentum strategies may generate false signals, while trend-following strategies may suffer from whipsaw losses.
Volatile Markets: Momentum strategies can capture rapid gains, but risk management is crucial to avoid large drawdowns.
Empirical studies have shown that momentum strategies often produce short-term outperformance in equities and commodities, while trend-following strategies are particularly effective in commodity, forex, and futures markets over the long term.
Behavioral and Psychological Considerations
Both momentum and trend-following strategies exploit behavioral biases:
Herding: Investors tend to follow recent winners, reinforcing momentum.
Anchoring: Market participants anchor to past prices, creating delayed reactions that trend followers can exploit.
Overreaction: Short-term overreactions create opportunities for momentum trades.
Discipline Requirement: Traders must overcome fear and greed, sticking to systematic rules rather than attempting to time reversals.
Examples of Momentum & Trend Following
Equities: Buying technology stocks outperforming the S&P 500 for the past 3–6 months (momentum) or holding positions until a 50-day moving average crossover signals a reversal (trend-following).
Forex: Trading EUR/USD when it breaks above a recent high with increasing volume (momentum) or following a long-term uptrend using EMA crossovers (trend-following).
Commodities: Entering oil futures when prices break out from a support/resistance zone (momentum) or riding a multi-month trend using ADX to gauge trend strength (trend-following).
Advantages and Limitations
Advantages
Simplicity: Rules-based approach allows systematic trading.
Adaptability: Works across multiple markets and timeframes.
Behavioral Edge: Exploits common psychological biases in trading.
Scalability: Can be applied to both retail and institutional portfolios.
Limitations
False Signals: Particularly in range-bound markets, leading to potential losses.
Drawdowns: Both strategies can experience significant losses during trend reversals.
Market Sensitivity: Performance may degrade in markets with low liquidity or sudden news shocks.
Discipline Required: Traders must follow strict rules, avoiding emotional decision-making.
Conclusion
Momentum and trend-following strategies are pillars of modern trading methodology. While momentum strategies capitalize on short-term price accelerations, trend-following strategies aim to capture long-term directional moves. Both approaches are grounded in behavioral finance principles, technical analysis, and empirical research, making them effective tools for traders seeking systematic, disciplined approaches.
The success of these strategies depends on rigorous market analysis, sound risk management, and psychological discipline. While they are not immune to losses, their adaptability across markets, scalability, and historical efficacy make them indispensable in both retail and institutional trading.
By combining these strategies intelligently, traders can create robust portfolios capable of profiting in multiple market conditions, harnessing both short-term momentum surges and long-term trends for sustained success.
Behavioral Finance and Trader Psychology:Introduction
The traditional models of finance and economics often assume that individuals are rational decision-makers, consistently acting in their best interests to maximize utility. However, real-world financial behavior frequently deviates from these assumptions. Behavioral finance and trader psychology delve into the psychological influences and biases that affect financial decision-making, challenging the notion of rational actors in the market.
Behavioral Finance: An Overview
Definition and Emergence
Behavioral finance is a subfield of behavioral economics that examines how psychological factors influence financial behaviors and market outcomes. It emerged in the late 1970s as a response to the Efficient Market Hypothesis (EMH), which posits that asset prices reflect all available information and thus always trade at their fair value. Behavioral finance contends that cognitive biases and emotional factors lead to market anomalies and inefficiencies.
Key Concepts in Behavioral Finance
Cognitive Biases: These are systematic patterns of deviation from norm or rationality in judgment, whereby inferences about other people and situations may be drawn in an illogical fashion. Common cognitive biases include:
Confirmation Bias: The tendency to search for, interpret, favor, and recall information in a way that confirms one's preexisting beliefs or hypotheses.
Anchoring Bias: The reliance on the first piece of information encountered (the "anchor") when making decisions.
Overconfidence Bias: The tendency to overestimate one's own abilities, knowledge, or control over events.
Availability Bias: The tendency to overestimate the likelihood of events based on their availability in memory.
Emotional Biases: These biases arise from emotions and feelings that influence decision-making. Examples include:
Loss Aversion: The tendency to prefer avoiding losses rather than acquiring equivalent gains; it's better to not lose $5 than to find $5.
Regret Aversion: The reluctance to make decisions due to the fear of making a wrong choice and the potential for future regret.
Herd Behavior: The tendency to mimic the actions (rational or irrational) of a larger group, often leading to asset bubbles or crashes.
Market Implications
Behavioral finance explains various market phenomena that traditional theories struggle with, such as asset bubbles, market crashes, and anomalies like the January effect or momentum. It suggests that markets are not always efficient and that prices can deviate from their intrinsic values due to collective psychological factors.
Trader Psychology: The Emotional Landscape of Trading
Definition and Importance
Trader psychology refers to the emotional and mental state of a trader, which significantly impacts their trading decisions and performance. Understanding trader psychology is crucial because emotions like fear, greed, and hope can lead to impulsive decisions, overtrading, or holding onto losing positions longer than rational analysis would suggest.
Common Psychological Challenges
Fear and Greed: These are the two primary emotions that drive market behavior. Fear can lead to panic selling during downturns, while greed can result in chasing after high-risk, high-reward opportunities during bull markets.
Overtrading: Driven by the desire to make profits or recover losses, traders may engage in excessive trading, leading to higher transaction costs and potential losses.
Loss Aversion: Traders may hold onto losing positions longer than advisable, hoping the market will turn in their favor, due to the psychological pain associated with realizing a loss.
Confirmation Bias: Traders may seek information that confirms their existing beliefs about a trade, ignoring contradictory evidence, which can lead to poor decision-making.
Strategies for Managing Trader Psychology
Developing a Trading Plan: Having a clear plan with defined entry and exit points can help mitigate emotional decision-making.
Risk Management: Setting stop-loss orders and position sizes can prevent significant losses and reduce emotional stress.
Mindfulness and Emotional Awareness: Practicing mindfulness can help traders recognize emotional reactions and prevent them from influencing trading decisions.
Continuous Learning: Educating oneself about psychological biases and their impact on trading can lead to more rational decision-making.
Integrating Behavioral Finance and Trader Psychology
The integration of behavioral finance and trader psychology offers a comprehensive understanding of financial decision-making. While behavioral finance provides a framework for understanding how biases and emotions affect market outcomes, trader psychology focuses on the individual trader's mental and emotional state. Together, they highlight the importance of psychological factors in financial markets and the need for strategies to mitigate their negative effects.
Conclusion
Behavioral finance and trader psychology underscore the complexity of financial markets and the significant role of human behavior in shaping market outcomes. By acknowledging and understanding the psychological factors that influence decision-making, investors and traders can develop strategies to make more informed and rational financial decisions. This holistic approach not only enhances individual performance but also contributes to the overall efficiency and stability of financial markets.
Cryptocurrency and Blockchain TradingIntroduction
Cryptocurrency and blockchain trading represent a transformative evolution in global financial markets. Unlike traditional fiat currencies governed by central banks and financial institutions, cryptocurrencies operate on decentralized networks built on blockchain technology. This paradigm shift has created unique opportunities and challenges for traders, investors, and institutions worldwide.
At its core, cryptocurrency trading involves buying, selling, and exchanging digital assets, often with the goal of making profits from price fluctuations. Blockchain technology, the underlying framework for cryptocurrencies, ensures transparency, security, and decentralization, enabling peer-to-peer transactions without intermediaries.
This article explores the principles, mechanisms, strategies, and risks involved in cryptocurrency and blockchain trading, offering a detailed guide for beginners, intermediate, and advanced market participants.
Understanding Cryptocurrencies
Definition and Characteristics
A cryptocurrency is a digital or virtual currency that uses cryptography for security and operates on a decentralized ledger called a blockchain. The defining characteristics include:
Decentralization: No single entity controls the network. Decisions are made through consensus mechanisms.
Security: Cryptographic algorithms secure transactions and wallets, making fraud extremely difficult.
Transparency: Blockchain ensures that all transactions are visible to participants, enhancing trust.
Limited Supply: Many cryptocurrencies, like Bitcoin, have a capped supply, creating scarcity that can influence value.
Programmability: Smart contracts enable programmable transactions, automatically executing when predefined conditions are met.
Popular Cryptocurrencies
Bitcoin (BTC): The first and most valuable cryptocurrency, often regarded as digital gold.
Ethereum (ETH): Known for its smart contract capabilities and decentralized applications (dApps).
Ripple (XRP): Focused on cross-border payments and banking solutions.
Litecoin (LTC): A faster, lighter alternative to Bitcoin for peer-to-peer transactions.
Binance Coin (BNB): Initially used for exchange fee reductions on Binance, now powering multiple DeFi applications.
Blockchain Technology: The Backbone
How Blockchain Works
A blockchain is a distributed digital ledger that records transactions across multiple computers. Key components include:
Blocks: Data structures that store transaction records.
Chains: Blocks are linked sequentially, forming a chain. Each block contains a cryptographic hash of the previous block, ensuring integrity.
Nodes: Computers participating in the network that validate and store blockchain data.
Consensus Mechanisms: Protocols like Proof of Work (PoW) and Proof of Stake (PoS) ensure agreement on the blockchain's state.
Benefits for Trading
Security: Immutable records prevent fraud and manipulation.
Transparency: Publicly accessible ledgers allow traders to verify transactions.
Efficiency: Automated smart contracts reduce reliance on intermediaries.
Global Reach: Cryptocurrencies are borderless, allowing participation across nations.
Cryptocurrency Trading Explained
Cryptocurrency trading differs from traditional markets due to high volatility, continuous operation (24/7 trading), and unique technical dynamics.
Types of Cryptocurrency Trading
Spot Trading
Spot trading involves buying and selling cryptocurrencies for immediate settlement. Traders profit from price differences in the short term or long term. Exchanges like Binance, Coinbase, and Kraken facilitate spot trading.
Margin Trading
Margin trading allows traders to borrow funds to increase their market exposure. This amplifies both potential profits and losses. For example, using 10x leverage, a $1,000 investment controls $10,000 worth of crypto.
Futures Trading
Futures contracts are agreements to buy or sell cryptocurrency at a predetermined price on a future date. Platforms like BitMEX, Binance Futures, and Bybit provide derivatives markets. Futures trading enables speculation on price movements without owning the underlying asset.
Options Trading
Options give traders the right, but not the obligation, to buy or sell cryptocurrency at a set price within a specific period. This allows hedging and risk management strategies.
Algorithmic and Automated Trading
Bots and trading algorithms execute orders based on predefined strategies, such as arbitrage, trend-following, or market-making, enabling high-frequency trading and consistent execution.
Market Participants
Cryptocurrency trading involves diverse participants, each influencing market behavior differently:
Retail Traders: Individual investors seeking profit from short-term or long-term price movements.
Institutional Investors: Hedge funds, asset managers, and corporations investing in crypto assets, influencing liquidity and stability.
Market Makers: Entities providing liquidity by continuously buying and selling assets, reducing bid-ask spreads.
Speculators: Traders aiming to profit from volatility without necessarily believing in the long-term value of the asset.
Arbitrageurs: Traders exploiting price differences across exchanges for risk-free profit.
Key Factors Influencing Cryptocurrency Prices
Market Sentiment: News, social media, and influencer activity can dramatically affect prices.
Regulation: Government policies, legal status, and taxation of cryptocurrencies impact market confidence.
Technology Upgrades: Network updates, forks, and innovations influence asset value.
Liquidity and Market Depth: Higher liquidity reduces volatility, whereas low liquidity can amplify price swings.
Global Economic Factors: Inflation, fiat currency performance, and geopolitical events indirectly affect crypto markets.
Technical Analysis in Cryptocurrency Trading
Common Tools
Candlestick Patterns: Identify trends and reversals through patterns like doji, hammer, or engulfing candles.
Moving Averages (MA): Track average prices to determine trend direction. Popular types include SMA (Simple Moving Average) and EMA (Exponential Moving Average).
Relative Strength Index (RSI): Measures overbought or oversold conditions.
MACD (Moving Average Convergence Divergence): Identifies trend changes and momentum.
Fibonacci Retracements: Used to predict support and resistance levels.
Trading Strategies
Day Trading: Entering and exiting positions within a single day to profit from intraday volatility.
Swing Trading: Holding assets for days or weeks to capitalize on medium-term trends.
Scalping: Rapid, high-volume trades exploiting small price movements.
HODLing: Long-term holding based on belief in the asset’s future potential.
Fundamental Analysis
Fundamental analysis evaluates a cryptocurrency’s intrinsic value based on qualitative and quantitative factors:
Whitepapers: Documents detailing a project’s goals, technology, and tokenomics.
Development Team: Experienced and reputable developers increase project credibility.
Community Support: Active communities on forums, social media, and GitHub indicate long-term viability.
Partnerships and Adoption: Integration into businesses and financial systems enhances value.
Supply Mechanisms: Token supply, staking incentives, and burning mechanisms influence scarcity.
Risk Management in Cryptocurrency Trading
Due to extreme volatility, risk management is crucial:
Position Sizing: Limit exposure based on account size and risk tolerance.
Stop-Loss Orders: Automatically close positions to prevent excessive losses.
Diversification: Spread investments across multiple assets to reduce concentration risk.
Leverage Caution: High leverage can magnify losses; traders should use it judiciously.
Security Practices: Use hardware wallets, two-factor authentication (2FA), and secure exchanges.
Regulatory and Legal Considerations
Cryptocurrency trading regulations vary globally:
United States: Regulated by SEC, CFTC, and FinCEN, focusing on securities compliance and anti-money laundering.
European Union: Markets are gradually regulated under MiCA (Markets in Crypto-Assets Regulation).
Asia: Countries like Japan and Singapore have clear licensing frameworks, while India’s stance fluctuates.
Other Regions: Some nations ban crypto entirely, while others encourage innovation.
Traders must stay informed to comply with taxation, reporting, and legal requirements.
Emerging Trends
Decentralized Finance (DeFi): Peer-to-peer financial systems offering lending, borrowing, and staking opportunities.
Non-Fungible Tokens (NFTs): Unique digital assets creating new investment classes and liquidity opportunities.
Institutional Adoption: Companies adding crypto to balance sheets or offering trading platforms.
Layer-2 Scaling Solutions: Enhancements like Ethereum’s Polygon reduce fees and increase transaction speed.
AI-Driven Trading: Advanced algorithms analyzing market sentiment and predictive trends.
Challenges in Cryptocurrency Trading
Volatility: Rapid price swings can lead to significant losses.
Security Risks: Exchange hacks, phishing, and wallet theft remain major concerns.
Regulatory Uncertainty: Changing laws can disrupt markets and affect liquidity.
Liquidity Constraints: Low trading volume in certain coins can cause slippage.
Emotional Trading: Fear and greed often lead to irrational decisions.
Conclusion
Cryptocurrency and blockchain trading is a dynamic and rapidly evolving domain combining technology, finance, and human behavior. While it offers opportunities for significant profit, it carries substantial risk. Successful trading requires a blend of technical analysis, fundamental research, risk management, and regulatory awareness.
As blockchain adoption grows and institutional participation increases, cryptocurrency markets are likely to mature, offering more stability, innovative instruments, and integration into the broader financial ecosystem.
Traders who stay informed, disciplined, and adaptable are best positioned to navigate this revolutionary landscape. With proper education, robust strategy, and caution, cryptocurrency trading can transform from a speculative gamble into a structured, potentially rewarding endeavor.
ESG Investing and Carbon Credit Trading1. Understanding ESG Investing
1.1 Definition of ESG Investing
ESG investing refers to investment strategies that incorporate environmental, social, and governance factors into the analysis of companies and assets. Rather than solely focusing on financial returns, ESG investing evaluates:
Environmental (E): A company’s impact on the natural environment, including carbon emissions, waste management, water usage, and energy efficiency.
Social (S): The company’s relationships with employees, suppliers, customers, and communities. It includes labor standards, diversity and inclusion, community engagement, and human rights.
Governance (G): Corporate governance practices such as board structure, executive compensation, shareholder rights, transparency, and ethical business conduct.
ESG investing can take several forms, such as negative screening (excluding companies that harm society or the environment), positive screening (investing in companies with strong ESG practices), or impact investing (targeting investments that generate measurable social or environmental benefits alongside financial returns).
1.2 Evolution and Global Adoption
ESG investing gained traction in the early 2000s, influenced by growing awareness of climate change, social inequality, and corporate scandals. Key drivers include:
Regulatory pressures: Governments and regulatory bodies worldwide now require companies to disclose ESG risks and sustainability reporting.
Investor demand: Institutional investors, such as pension funds and sovereign wealth funds, increasingly prioritize ESG to mitigate long-term risks.
Corporate accountability: Companies with strong ESG profiles often demonstrate resilience, lower regulatory risks, and better operational efficiency.
The market for ESG investments has expanded exponentially. According to the Global Sustainable Investment Alliance (GSIA), sustainable investment assets exceeded $35 trillion globally in 2023, representing over 36% of total professionally managed assets.
1.3 ESG Investment Strategies
Negative Screening: Avoiding investments in sectors such as tobacco, fossil fuels, weapons, or companies with poor labor practices.
Positive Screening: Selecting companies with best-in-class ESG performance, e.g., renewable energy companies or firms with exemplary governance practices.
Thematic Investing: Focusing on specific sustainability themes like clean energy, water management, or gender equality.
Impact Investing: Targeting investments that generate measurable social or environmental impact in addition to financial returns.
ESG Integration: Incorporating ESG factors into traditional financial analysis to enhance risk-adjusted returns.
1.4 Benefits of ESG Investing
Risk Mitigation: ESG-focused companies are less prone to environmental liabilities, regulatory penalties, and reputational damage.
Long-term Value Creation: Sustainable practices often translate into operational efficiency, customer loyalty, and innovation.
Enhanced Portfolio Diversification: ESG investments may have lower correlations with traditional financial markets.
Alignment with Values: Investors can support ethical and sustainable business practices.
1.5 Challenges in ESG Investing
Data Inconsistency: ESG reporting standards vary across regions and companies, making comparisons difficult.
Greenwashing: Companies may exaggerate their ESG efforts to attract investment without meaningful impact.
Financial Trade-offs: Some ESG investments may underperform in the short term due to higher costs or niche markets.
Measurement Complexity: Quantifying social and governance impact is often subjective.
2. Carbon Credit Trading: An Overview
2.1 Definition and Concept
Carbon credit trading is a market-based mechanism aimed at reducing global carbon emissions. It operates under the principle of cap-and-trade, where a regulatory authority sets a limit (cap) on the total greenhouse gas emissions allowed for companies or sectors. Entities are issued carbon credits representing the right to emit one metric ton of CO2 or equivalent greenhouse gases.
If a company emits less than its allocated credits, it can sell the surplus in the carbon market. Conversely, companies that exceed their limits must purchase additional credits or face penalties. This creates a financial incentive to reduce emissions efficiently.
2.2 Historical Context
Carbon trading emerged from global climate agreements:
Kyoto Protocol (1997): Introduced the Clean Development Mechanism (CDM), allowing emission reductions to be traded internationally.
European Union Emission Trading Scheme (EU ETS, 2005): The first major regional carbon market, setting a benchmark for emissions trading globally.
Paris Agreement (2015): Reinforced carbon markets under Article 6, encouraging countries to collaborate in emission reductions.
2.3 Types of Carbon Credits
Compliance Credits: Issued under government-regulated cap-and-trade programs.
Voluntary Carbon Credits: Bought by companies or individuals to offset emissions voluntarily, often through projects like reforestation, renewable energy, or methane capture.
2.4 Mechanism of Carbon Trading
Cap Setting: Authorities determine the total allowable emissions for sectors or companies.
Credit Allocation: Companies receive carbon credits based on past emissions or regulatory quotas.
Trading: Companies can buy or sell credits depending on their actual emissions relative to their cap.
Verification: Third-party audits ensure reported emissions reductions are accurate and credible.
2.5 Market Participants
Corporations: Major emitters such as power plants, airlines, and industrial manufacturers.
Brokers and Traders: Facilitate buying and selling of carbon credits.
Governments and Regulatory Bodies: Establish rules, issue credits, and monitor compliance.
Environmental Projects: Generate carbon credits by implementing emission-reducing projects.
3. Integration of ESG Investing and Carbon Credit Trading
3.1 ESG and Carbon Markets Synergy
ESG investing and carbon credit trading are inherently linked, particularly through the environmental component. Companies with robust ESG strategies often engage in carbon credit trading to:
Offset unavoidable emissions.
Demonstrate commitment to climate targets.
Improve sustainability credentials for investors.
Investors increasingly assess carbon strategies as part of ESG due diligence. Companies actively participating in carbon markets may be more attractive for ESG-focused portfolios, aligning financial performance with sustainability outcomes.
3.2 Financial Implications
Hedging Climate Risk: By investing in companies that trade carbon credits or adopt low-carbon practices, investors reduce exposure to regulatory or reputational risks.
Revenue Generation: Selling surplus carbon credits provides an additional income stream.
Valuation Impact: Firms with effective carbon management often enjoy higher valuations and lower cost of capital.
3.3 Case Examples
Microsoft: Pledged to become carbon negative by 2030, investing in carbon credits and renewable projects.
Tesla: Generates revenue by selling regulatory carbon credits to other automakers.
BP and Shell: Invest in carbon offset projects to complement ESG commitments and mitigate emissions.
4. Global Trends in ESG and Carbon Markets
4.1 Rising Investor Awareness
ESG investment products, including mutual funds, ETFs, and green bonds, are growing rapidly.
Millennials and Gen Z investors prioritize sustainability, influencing capital flows.
4.2 Regulatory Push
The EU, UK, and US are tightening ESG disclosure requirements.
Mandatory reporting on Scope 1, 2, and 3 emissions enhances transparency and accountability.
4.3 Technological Innovations
Blockchain and digital registries improve the traceability of carbon credits.
Artificial intelligence helps analyze ESG data and monitor compliance.
4.4 Market Growth
The global voluntary carbon market is expected to exceed $50 billion by 2030.
ESG assets under management are projected to surpass $50 trillion by 2025, highlighting a long-term trend toward sustainability-focused finance.
5. Challenges and Criticisms
5.1 ESG Investing Challenges
Subjectivity: ESG ratings vary across agencies, leading to inconsistent assessments.
Greenwashing Risk: Companies may overstate sustainability achievements to attract capital.
Limited Impact: Some ESG investments may not translate into measurable environmental or social improvements.
5.2 Carbon Credit Trading Challenges
Verification Complexity: Ensuring credits correspond to real emission reductions is challenging.
Market Volatility: Carbon prices fluctuate due to regulatory changes or market sentiment.
Ethical Concerns: Over-reliance on offsets can allow continued emissions instead of driving systemic change.
6. Future Outlook
6.1 ESG Investing
ESG integration will become standard practice for asset managers and institutional investors.
Enhanced global ESG reporting standards, such as the International Sustainability Standards Board (ISSB), will improve transparency.
6.2 Carbon Credit Trading
Expansion of voluntary and compliance markets is expected, particularly in Asia-Pacific.
Innovations like nature-based carbon credits and digital carbon registries will enhance credibility and efficiency.
Carbon pricing may become more widespread, influencing corporate strategy and investment decisions.
6.3 Combined Impact
The synergy between ESG investing and carbon credit trading can accelerate the transition to a low-carbon economy. Financial markets will increasingly reward companies that embed sustainability into strategy and operations, making environmental stewardship a core value driver.
Conclusion
ESG investing and carbon credit trading represent transformative trends in global finance, emphasizing the integration of sustainability into investment decisions. ESG investing aligns financial returns with environmental and social responsibility, while carbon credit trading provides a market-driven mechanism for reducing greenhouse gas emissions. Both are critical tools in addressing climate change, promoting corporate accountability, and meeting the growing demand for sustainable investments.
Despite challenges such as data inconsistency, greenwashing, and verification complexities, the long-term outlook remains positive. As regulatory frameworks strengthen, technology improves, and investor awareness rises, ESG investing and carbon credit markets are poised to redefine the role of finance in building a sustainable, resilient global economy.
The interconnection of ESG and carbon trading illustrates a broader shift: capital is no longer just a means of generating profit; it is a lever for societal and environmental impact. Investors, corporations, and policymakers who embrace this integrated approach will shape the future of finance and the health of the planet.

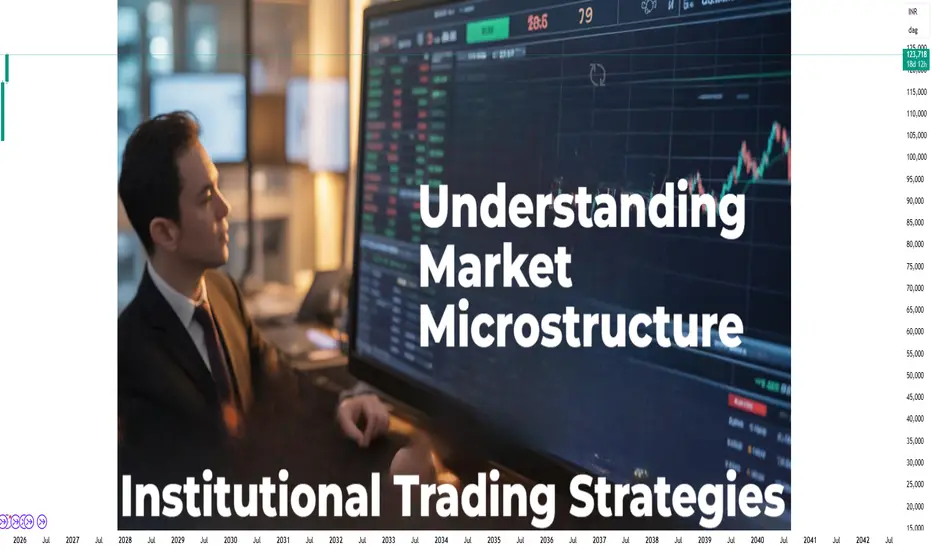
Market Microstructure and Institutional Trading Strategies1. Understanding Market Microstructure
Market microstructure focuses on the mechanics of trading rather than the fundamental valuation of assets. While traditional finance examines “why” prices should move based on information, market microstructure investigates how prices move, what factors influence trading efficiency, and how different participants interact.
1.1 Key Components
Trading Mechanisms:
Order-driven markets: Prices are determined by matching buy and sell orders (e.g., stock exchanges like NYSE, NSE).
Quote-driven markets (dealer markets): Market makers provide continuous bid and ask prices (e.g., forex markets, bond markets).
Hybrid markets: Combine order-driven and quote-driven features for improved liquidity and transparency.
Market Participants:
Retail traders: Small-scale investors making trades based on personal strategies.
Institutional investors: Large organizations trading significant volumes.
Market makers: Ensure liquidity by standing ready to buy or sell assets.
High-frequency traders (HFTs): Exploit very short-term inefficiencies using advanced algorithms.
Price Formation:
Market microstructure studies how the interaction of supply and demand, order types, and trading rules create asset prices. Concepts like bid-ask spread, depth of the order book, and price impact are central to understanding price formation.
Transaction Costs:
Every trade incurs costs: explicit costs (commissions, fees) and implicit costs (slippage, market impact). Understanding these is critical for large-scale traders to optimize execution.
2. Microstructure Theories
Market microstructure is supported by multiple theoretical frameworks:
The Inventory Model:
Market makers adjust prices based on inventory levels to mitigate risk. A dealer holding excess stock may lower prices to encourage buying and reduce exposure.
The Information Model:
Price movements reflect private information. Informed traders (e.g., institutions with advanced research) can cause prices to move before public information becomes available.
The Strategic Trading Model:
Large orders influence price movement. Traders may split large orders into smaller ones to avoid adverse market impact, a concept central to institutional trading strategies.
3. Institutional Trading
Institutional trading represents the actions of large entities managing substantial pools of capital. Their trades are not only larger than those of retail investors but also significantly influence market dynamics.
3.1 Types of Institutional Investors
Mutual Funds: Pool investor capital to invest across diverse assets.
Pension Funds: Focus on long-term investments to meet future liabilities.
Hedge Funds: Pursue high-risk, high-reward strategies using derivatives, leverage, and complex models.
Insurance Companies: Invest premiums to cover claims and generate steady returns.
Sovereign Wealth Funds: State-owned entities investing for national economic objectives.
3.2 Objectives and Constraints
Institutional investors balance return objectives with regulatory and liquidity constraints. Their strategies often prioritize minimizing market impact and execution costs while adhering to risk management mandates.
4. Institutional Trading Strategies
Large-scale investors deploy specialized trading strategies that reflect their goals, risk tolerance, and market conditions. These strategies can broadly be categorized into execution strategies, alpha strategies, and liquidity provision strategies.
4.1 Execution Strategies
Execution strategies aim to minimize the cost and market impact of large trades.
Algorithmic Trading:
Uses computer algorithms to automate order placement. Popular methods include:
VWAP (Volume Weighted Average Price): Splits large orders to execute at the average market volume price.
TWAP (Time Weighted Average Price): Spreads execution evenly over a set time frame.
Implementation Shortfall: Minimizes the difference between the decision price and execution price.
Iceberg Orders:
Large orders are broken into smaller visible slices to hide the true size and reduce market impact.
Dark Pools:
Private trading venues where institutions can execute large orders without revealing intentions to the broader market, thus limiting price impact.
4.2 Alpha Strategies
Alpha strategies aim to generate excess returns beyond the market benchmark.
Statistical Arbitrage:
Exploits short-term pricing inefficiencies using historical correlations and advanced quantitative models.
Momentum and Trend-Following:
Buys assets with upward momentum and sells those trending downward, often using technical indicators for timing.
Pairs Trading:
Trades two correlated securities: long on the underperformer and short on the outperformer, expecting convergence.
Event-Driven Strategies:
Capitalizes on events like mergers, acquisitions, earnings releases, or regulatory changes.
4.3 Liquidity Provision Strategies
Institutional traders often act as liquidity providers, profiting from the bid-ask spread while managing inventory risk.
Market Making:
Providing continuous quotes to facilitate trading while managing risk exposure.
Cross-Market Arbitrage:
Exploiting price differences between correlated markets, such as futures and underlying assets.
5. Interaction Between Market Microstructure and Institutional Strategies
The behavior of institutional investors shapes market microstructure significantly:
Price Impact:
Large trades move prices temporarily (or permanently), affecting short-term volatility. Market microstructure models help quantify these impacts and guide execution.
Liquidity Dynamics:
Institutions influence liquidity by their trading activity. Passive liquidity provision supports market stability, while aggressive trades can reduce depth temporarily.
Information Dissemination:
Institutional trades often signal private information to the market. Microstructure research examines how this information leaks through trading patterns.
Order Book Dynamics:
Large orders change the visible order book, affecting how other participants place orders. High-frequency traders often respond to these signals, amplifying market reactions.
6. Advanced Concepts
6.1 High-Frequency Trading (HFT)
HFT strategies operate at microsecond speeds, exploiting order book imbalances, latency arbitrage, and short-term momentum. These strategies interact with institutional trading, sometimes acting as liquidity providers and sometimes competing for the same alpha opportunities.
6.2 Transaction Cost Analysis (TCA)
TCA measures the effectiveness of trade execution by analyzing costs such as:
Explicit costs: Commissions, exchange fees.
Implicit costs: Market impact, slippage, timing risk.
Opportunity costs: Missed favorable prices.
Institutional traders use TCA to refine execution strategies, balancing speed and price improvement.
6.3 Dark Pools and Alternative Trading Systems (ATS)
Dark pools allow institutions to trade off-exchange, hiding the size and timing of large trades. While reducing market impact, they raise concerns about transparency and fair access for smaller investors.
7. Regulatory and Ethical Considerations
Institutional trading operates under strict regulatory frameworks to ensure market fairness, transparency, and risk management. Key areas include:
Best Execution: Mandates that brokers execute orders at the most favorable terms for clients.
Insider Trading Laws: Prevent trading based on non-public material information.
Market Manipulation Rules: Prohibit practices like spoofing and layering that distort prices.
Risk Management Requirements: Institutions must maintain capital adequacy and liquidity buffers.
Ethical concerns arise when strategies prioritize profit over market integrity, such as front-running or excessive use of dark pools.
8. Case Studies and Real-World Examples
BlackRock and Passive Investing:
As one of the world’s largest asset managers, BlackRock’s trades influence market microstructure, especially in ETFs. Their strategies aim to minimize tracking error while executing large orders efficiently.
Hedge Fund Activism:
Activist investors like Elliott Management target undervalued companies, executing trades that signal private information and provoke strategic changes, demonstrating the interaction between microstructure and institutional impact.
Flash Crashes and HFT:
Events like the 2010 “Flash Crash” highlight how high-frequency and institutional trading interact with microstructure, causing sudden liquidity shortages and extreme price volatility.
9. Future Trends
AI and Machine Learning in Execution:
Algorithms are increasingly leveraging AI to predict market impact, optimize order slicing, and anticipate short-term price movements.
Blockchain and Decentralized Markets:
Distributed ledgers could reshape market microstructure by providing transparency and reducing settlement times, impacting institutional strategies.
Environmental, Social, and Governance (ESG) Factors:
Institutional investors increasingly integrate ESG considerations into trading strategies, influencing demand patterns and market microstructure in specific sectors.
Globalization of Trading:
Cross-border trading increases complexity, requiring institutions to navigate different regulations, liquidity conditions, and currency exposures.
10. Conclusion
Market microstructure and institutional trading strategies are interlinked dimensions of modern financial markets. Microstructure provides insights into how markets operate, highlighting the role of liquidity, order flows, and price formation. Institutional strategies, in turn, reflect how large participants navigate these mechanics to execute trades efficiently, generate alpha, and manage risk.
Understanding these concepts is crucial not only for institutional traders but also for regulators, retail participants, and market analysts. It provides a framework to interpret market behavior, anticipate price movements, and design better trading systems. As technology evolves and global markets integrate, the interplay between microstructure and institutional strategies will remain a cornerstone of finance, shaping liquidity, volatility, and the efficiency of markets worldwide.
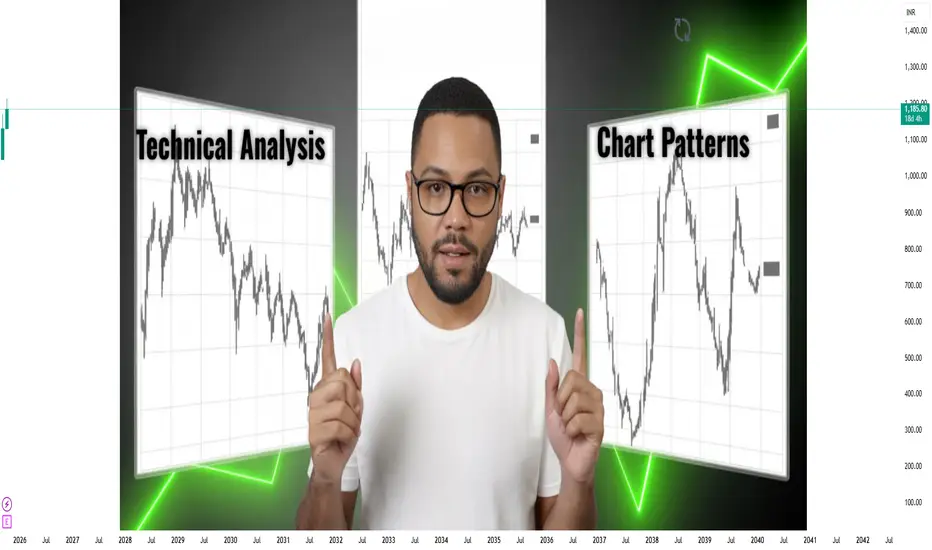
Technical Analysis and Chart PatternsIntroduction to Technical Analysis
Technical Analysis (TA) is the study of historical price and volume data to forecast future price movements in financial markets. Unlike fundamental analysis, which focuses on the intrinsic value of an asset, technical analysis relies on patterns, trends, and statistical indicators to identify trading opportunities. It is widely used across equity, forex, commodities, and cryptocurrency markets by traders of all timeframes, from intraday scalpers to long-term investors.
The foundation of technical analysis rests on three main assumptions:
Market Action Discounts Everything: All information, whether public or private, is already reflected in the current price of an asset.
Prices Move in Trends: Markets follow trends rather than random movement, and identifying these trends can help traders profit.
History Tends to Repeat Itself: Human psychology drives market behavior, and patterns formed in the past tend to recur under similar conditions.
1. Key Principles of Technical Analysis
Trend Analysis
Uptrend: Characterized by higher highs and higher lows. Indicates bullish sentiment.
Downtrend: Characterized by lower highs and lower lows. Indicates bearish sentiment.
Sideways/Range-bound Trend: Occurs when prices move horizontally, often leading to breakout opportunities.
Support and Resistance Levels
Support: A price level where demand is strong enough to prevent further decline. Often a buying opportunity.
Resistance: A price level where selling pressure prevents further rise. Often a selling opportunity.
Breakouts and Breakdowns: Breaching these levels can signal the start of new trends.
Volume Analysis
Volume reflects the intensity of a price movement.
Rising prices with increasing volume confirm trends, whereas divergences (e.g., rising price with falling volume) indicate potential reversals.
Momentum Indicators
Measure the speed and strength of price movements.
Examples: Relative Strength Index (RSI), Moving Average Convergence Divergence (MACD), Stochastic Oscillator.
Moving Averages
Smooth out price fluctuations to identify trends.
Common types: Simple Moving Average (SMA), Exponential Moving Average (EMA).
Crossovers (e.g., 50-day SMA crossing 200-day SMA) are key trading signals.
2. Chart Types
Understanding chart types is crucial for recognizing patterns:
Line Charts
Simple representation connecting closing prices.
Useful for identifying long-term trends but lacks intraday information.
Bar Charts
Displays open, high, low, and close (OHLC) for each period.
Provides more detailed insight into market sentiment.
Candlestick Charts
Originated in Japan; visually appealing and widely used.
Each candlestick shows open, high, low, and close, forming recognizable patterns that signal market direction.
Point and Figure Charts
Ignores time; focuses solely on price changes.
Useful for identifying strong trends and breakout points.
3. Chart Patterns
Chart patterns are visual representations of market psychology, helping traders anticipate future price action. They can be broadly categorized into reversal and continuation patterns.
3.1 Reversal Patterns
Reversal patterns indicate a potential change in trend.
Head and Shoulders
Signifies a trend reversal from bullish to bearish.
Features a left shoulder, a head (higher peak), and a right shoulder.
The neckline is the support level; breaking it confirms the trend reversal.
Inverse Head and Shoulders
Opposite of the standard head and shoulders.
Signals reversal from bearish to bullish.
Double Top
Occurs after an uptrend; two peaks at roughly the same level.
Breaking the support level between the peaks signals a downtrend.
Double Bottom
Occurs after a downtrend; two troughs at a similar level.
Breaking the resistance confirms a bullish reversal.
Triple Top/Bottom
Less common but more reliable than double tops or bottoms.
Indicates stronger resistance or support levels.
3.2 Continuation Patterns
Continuation patterns suggest that the existing trend is likely to continue.
Triangles
Ascending Triangle: Bullish; flat resistance and rising support. Breakout likely upwards.
Descending Triangle: Bearish; flat support and descending resistance. Breakout likely downwards.
Symmetrical Triangle: Neutral; breakout direction depends on the preceding trend.
Flags and Pennants
Short-term consolidation patterns after strong moves.
Flags: Rectangular consolidation; pennants: small symmetrical triangles.
Typically continue in the direction of the previous trend.
Rectangles (Trading Ranges)
Horizontal consolidation between support and resistance.
Breakout indicates trend continuation.
3.3 Candlestick Patterns
Candlestick patterns provide detailed insight into market sentiment:
Single Candlestick Patterns
Doji: Indicates indecision; potential reversal if appearing after a strong trend.
Hammer/Inverted Hammer: Bullish reversal after a downtrend.
Shooting Star: Bearish reversal after an uptrend.
Multiple Candlestick Patterns
Engulfing Pattern: Bullish or bearish reversal depending on candle alignment.
Morning Star/Evening Star: Signals trend reversal.
Three White Soldiers/Three Black Crows: Strong trend continuation patterns.
4. Indicators and Oscillators
Technical analysis often combines chart patterns with indicators:
Trend Indicators
Moving Averages, MACD, ADX (Average Directional Index)
Momentum Indicators
RSI, Stochastic Oscillator, Rate of Change (ROC)
Volatility Indicators
Bollinger Bands, Average True Range (ATR)
Volume Indicators
On-Balance Volume (OBV), Chaikin Money Flow (CMF)
5. Technical Analysis in Trading Strategy
Technical analysis is integrated into different trading strategies:
Day Trading
Focuses on intraday price movements using candlestick patterns and intraday indicators.
Swing Trading
Capitalizes on short to medium-term trends using support/resistance and chart patterns.
Position Trading
Long-term trend following; relies on moving averages, trendlines, and breakout patterns.
Algorithmic Trading
Combines TA rules with automated systems for high-frequency trading.
6. Advantages of Technical Analysis
Quick decision-making due to focus on charts and indicators.
Applicable across different asset classes and timeframes.
Helps identify entry and exit points with greater precision.
7. Limitations of Technical Analysis
Reliance on historical data; past performance doesn’t guarantee future results.
Can produce false signals in highly volatile or low-volume markets.
Requires experience and discipline to interpret patterns accurately.
8. Combining Technical Analysis with Other Tools
Many traders combine TA with fundamental analysis to improve accuracy.
Sentiment analysis, news events, and macroeconomic data can enhance decision-making.
Risk management is essential: stop-loss, position sizing, and portfolio diversification mitigate losses.
Conclusion
Technical analysis and chart patterns provide traders with a structured way to interpret market behavior. While no method guarantees success, mastery of TA enables traders to identify high-probability setups, manage risk, and make informed decisions. With the right combination of pattern recognition, indicator use, and disciplined execution, technical analysis can be a powerful tool in the trader’s arsenal.
By understanding trends, patterns, support/resistance levels, and combining them with indicators and sound risk management, traders can navigate financial markets with greater confidence and precision.
Divergence SecretsThere are two main types of options: Call Options and Put Options.
A Call Option gives the buyer the right to buy an asset at a predetermined price, called the strike price, before the expiry date. Investors buy calls when they expect the price of the underlying asset to rise.
A Put Option, on the other hand, gives the buyer the right to sell an asset at the strike price before expiry. Traders buy puts when they expect the asset’s price to fall.

Part 2 Support and ResistanceAdvantages of Option Trading
a. Leverage:
Options allow traders to control large positions with small capital. Buying one option contract often represents 100 shares, meaning traders can gain significant exposure at a fraction of the cost.
b. Flexibility:
Options can be used for speculation, hedging, or income generation.
c. Limited Risk for Buyers:
When you buy options, your maximum loss is limited to the premium paid.
d. Hedging Tool:
Investors can use options to protect their portfolios from downside risk — for instance, buying a put option as insurance against a market fall.

Part 1 Support and Resistance Option Pricing – The Greeks
Option pricing is influenced by several factors such as the underlying price, time to expiry, volatility, and interest rates. These factors are represented by “Greeks,” which measure the sensitivity of an option’s price to different variables:
Delta (Δ): Measures how much the option price changes with a ₹1 move in the underlying asset.
Gamma (Γ): Measures the rate of change of Delta — i.e., how stable Delta is.
Theta (Θ): Measures time decay — how much value the option loses each day as expiry nears.
Vega (ν): Measures sensitivity to volatility — how much the option price changes with changes in market volatility.
Rho (ρ): Measures sensitivity to interest rates.
Understanding these helps traders build strategies that match their risk tolerance and market view.

Option Trading Participants in Option Trading
There are generally four types of participants in the options market:
Buyers of Calls: Expect the price of the underlying to go up.
Sellers (Writers) of Calls: Expect the price to remain the same or fall.
Buyers of Puts: Expect the price of the underlying to go down.
Sellers (Writers) of Puts: Expect the price to remain the same or rise.
Buyers have limited risk (the premium paid) and unlimited profit potential, while sellers have limited profit (premium received) but unlimited potential risk.

Part 2 Master Candle Stick PatternHow Option Trading Works
Let’s take a simple example.
Suppose a stock named XYZ Ltd. is trading at ₹1000. You believe it will rise in the next month, so you buy a call option with a strike price of ₹1050, expiring in one month, and pay a premium of ₹20 per share.
If the price rises to ₹1100, your profit = (1100 - 1050 - 20) = ₹30 per share.
If the price stays below ₹1050, you lose the premium (₹20 per share).
This is the beauty of options — your loss is limited to the premium, but your potential profit is unlimited.
Similarly, if you believe the stock will fall, you can buy a put option. For example, if you buy a put option at ₹950 with a premium of ₹15:
If the stock falls to ₹900, your profit = (950 - 900 - 15) = ₹35 per share.
If the stock stays above ₹950, you lose the ₹15 premium.
