Sandhar Technologies LtdStock is in a clear rising channel (higher highs & higher lows).
Price is currently 559, near the middle of the channel.
Strong demand/support zone seen around ₹515–₹525 (highlighted box).
Buy above 565, with immediate resistance is near 585, with major resistance at 600.
Your 2025 space mission is here
Suit up and get ready to explore every highlight of your trading galaxy.


RR KABEL : Breakout Soon Candidate NSE:RRKABEL
🔹 Technical View
Strong recovery from ₹900 zone
Price testing major resistance at ₹1,500–1,510
Above ₹1,510 (weekly close): Breakout → ₹1,650–1,800
Support: ₹1,380–1,400
Structure turning higher high–higher low → bullish bias
🔹 Fundamental Snapshot
Strong brand in wires & cables
Consi

State Bank Weekly Price Action Analysis for Jan 2026Analysis date: 20-Dec-2025
State Bank closed at 980 levels but the volume is pretty low. This is not a good sign of bullishness. Chances are, sellers could be waiting for price to come in 990 range. They may take the price down to 970 levels as shown on the charts.
Bulls trade with caution.
Bullish

#JKTYRE - Cup & Handle / IHNS BO in DTFScript: JKTYRE
Key highlights: 💡⚡
📈 Cup & Handle / IHNS BO in DTF
📈 Volume spike seen during Breakout
📈 MACD Bounce
📈 RS Line making 52WH
✅Boost and follow to never miss a new idea! ✅
⚠️ Important: Always Exit the trade before any Event.
⚠️ Important: Always maintain your Risk:Reward Ratio as 1

EURUSD-Short-15MThe trade was initiated based on a high-probability setup identified through a confluence of technical factors.
Higher Timeframe (HTF) Analysis: Price action on a higher timeframe (15 MIn) demonstrated a perfect retracement into a previously identified order block (OB). This order block represente

HEROMOTOCO - Rejection From Strong Resistance, Momentum Cooling💹 Hero MotoCorp Ltd (NSE: HEROMOTOCO)
Sector: Automobiles | CMP: 5817
View: Bearish — Rejection From Strong Resistance, Momentum Cooling
HEROMOTOCO has recently faced a sharp rejection from its upper resistance zone near the 6100–6200 region after a strong prior rally, indicating supply emergence

BANKNIFTY at a Make-or-Break ZoneNIFTYBANK is currently trading at a critical confluence zone where a downward-sloping resistance trendline is meeting a well-defined rising support area on the 1-hour timeframe. This price compression indicates indecision and typically precedes a sharp directional move. The index has repeatedly resp

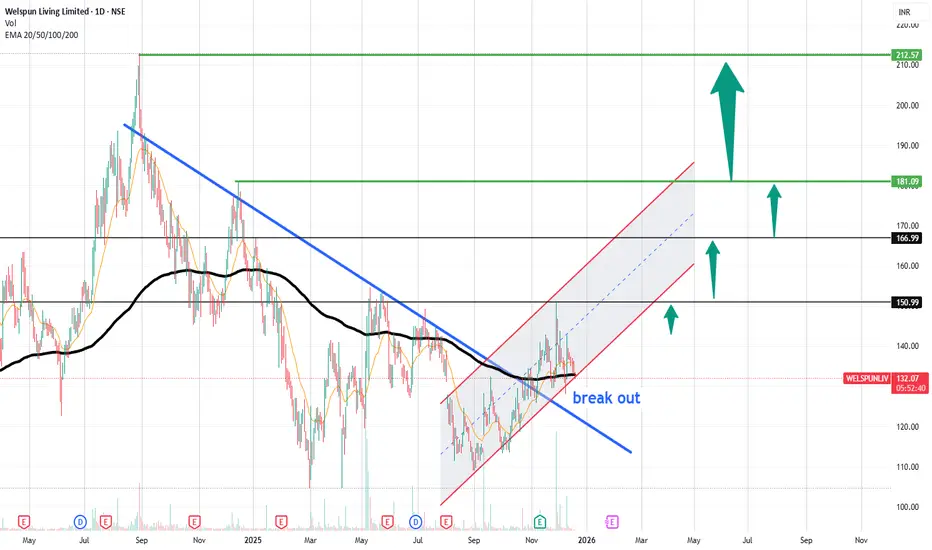
WELSPUNLIV | Trend Reversal with Strong VolumeWelspun Living Ltd. (NSE: WELSPUNLIV) is showing signs of a significant trend reversal as it breaks out of a downward channel, supported by a surge in volume. After multiple attempts to move higher, the price action has finally broken above the crucial resistance at ₹132.90, signaling the potential
Nifty 50 Analysis for Short and Long TermIn the video, few points that are discussed are :
Nifty 50 is sustaining on long term chart.
Nifty 50 is sideways to bearish on short term chart.
Check the past chart and control your emotions in short term up and down moves.

CEAT LTD: Demand Is Quietly Winning This BattleThis chart tells a very classic supply–demand story where emotions and patience are clearly separated. On the surface, recent price action may look weak or confusing, but when you zoom out and read it through the lens of demand–supply and price action, the bigger picture becomes very clear.
🔥 High

See all editors' picks ideas
Multi-Distribution Volume Profile (Zeiierman)█ Overview
Multi-Distribution Volume Profile (Zeiierman) is a flexible, structure-first volume profile tool that lets you reshape how volume is distributed across price, from classic uniform profiles to advanced statistical curves like Gaussian, Lognormal, Student-t, and more.
Instead of forcin

Multi-Ticker Anchored CandlesMulti-Ticker Anchored Candles (MTAC) is a simple tool for overlaying up to 3 tickers onto the same chart. This is achieved by interpreting each symbol's OHLC data as percentages, then plotting their candle points relative to the main chart's open. This allows for a simple comparison of tickers to tr

Vdubus Divergence Wave Pattern Generator V1The Vdubus Divergence Wave Theory
10 years in the making & now finally thanks to AI I have attempted to put my Trading strategy & logic into a visual representation of how I analyse and project market using Core price action & MacD. Enjoy :)
A Proprietary Structural & Momentum Confluence System

Per Bak Self-Organized CriticalityTL;DR: This indicator measures market fragility. It measures the system's vulnerability to cascade failures and phase transitions. I've added four independent stress vectors: tail risk, volatility regime, credit stress, and positioning extremes. This allows us to quantify how susceptible markets are

Volatility Risk PremiumTHE INSURANCE PREMIUM OF THE STOCK MARKET
Every day, millions of investors face a fundamental question that has puzzled economists for decades: how much should protection against market crashes cost? The answer lies in a phenomenon called the Volatility Risk Premium, and understanding it may fundam

Volume Gaps & Imbalances (Zeiierman)█ Overview
Volume Gaps & Imbalances (Zeiierman) is an advanced market-structure and order-flow visualizer that maps where the market traded, where it did not, and how buyer-vs-seller pressure accumulated across the entire price range.
The core of the indicator is a price-by-price volume prof

Match Finder [theUltimator5]Match Finder is the dating app of indicators. It takes your current ticker and finds the most compatible match over a recent time period. The match may not be Mr. right, but it is Mr. right now. It doesn't forecast future connection, but it tells you current compatibility for today.
Jokes aside,

Trend Line Methods (TLM)Trend Line Methods (TLM)
Overview
Trend Line Methods (TLM) is a visual study designed to help traders explore trend structure using two complementary, auto-drawn trend channels. The script focuses on how price interacts with rising or falling boundaries over time. It does not generate trade sign

Breakouts & Pullbacks [Trendoscope®]🎲 Breakouts & Pullbacks - All-Time High Breakout Analyzer
Probability-Based Post-Breakout Behavior Statistics | Real-Time Pullback & Runup Tracker
A professional-grade Pine Script v6 indicator designed specifically for analyzing the historical and real-time behavior of price after strong All-Ti

Count█ OVERVIEW
A library of functions for counting the number of times (frequency) that elements occur in an array or matrix.
█ USAGE
Import the Count library.
import joebaus/count/1 as c
Create an array or matrix that is a `float`, `int`, `string`, or `bool` type to count elements from, t

See all indicators and strategies
Community trends
Sandhar Technologies LtdStock is in a clear rising channel (higher highs & higher lows).
Price is currently 559, near the middle of the channel.
Strong demand/support zone seen around ₹515–₹525 (highlighted box).
Buy above 565, with immediate resistance is near 585, with major resistance at 600.
RR KABEL : Breakout Soon Candidate NSE:RRKABEL
🔹 Technical View
Strong recovery from ₹900 zone
Price testing major resistance at ₹1,500–1,510
Above ₹1,510 (weekly close): Breakout → ₹1,650–1,800
Support: ₹1,380–1,400
Structure turning higher high–higher low → bullish bias
🔹 Fundamental Snapshot
Strong brand in wires & cables
Consi
Nifty Auto – Summary Nifty Auto is showing strong consolidation and higher lows, indicating accumulation.
Index is near a key resistance zone; a breakout with volume can trigger momentum.
Sector leaders (Maruti, M&M, Tata Motors) and auto ancillaries are participating, improving breadth.
The sector is outperforming N

HIND ZINC:At the verge of a Huge breakoutHIND ZINC:Trading at 545
Trading above all its Moving averages even in weekly chart with 10 DEMA Golden Cross over.
Formed a rounding bottom in weekly chart also.
Combination of the above suggests a move towards 600+(For educational purpose only)

NMDC Compressing Inside Rising Structure – Breakout Bias StrongNMDC on the weekly timeframe is trading inside a rising trend structure, where price is getting compressed between rising support and a long-term falling resistance. This kind of structure usually leads to a sharp expansion move once price resolves the compression.
The stock has clearly defended th

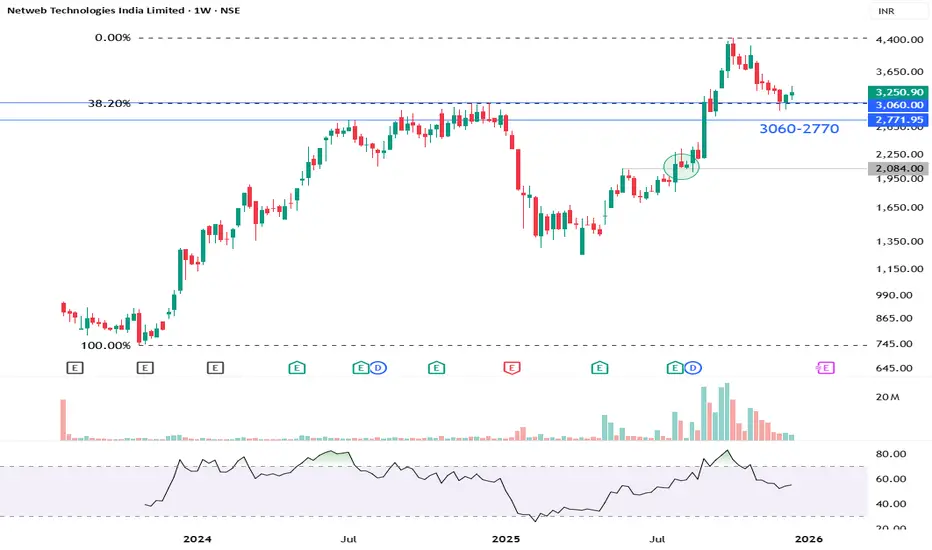
NETWEB
We identified change of trend around July 2025 (Rs.1962).
The stock witnessed a strong up-move after that supported with high volumes.
Currently, the stock has witnessed a pullback to its Support zone provided by important previous highs.
The stock is likely to resume its up-move from this su
This Multi time frame Trick will save you from FAKEOUTSIn this video I am showcasing a daily, weekly and monthly time frame combination - also sharing a trick which can save you a lot of money from those regular sized fakeouts .
Charts used are 3 months old in this video and video is purely educational based .

TECHNICAL VIEW OF KAYNESKaynes is forming a triangle pattern on the 1-hour timeframe. A breakout can happen on either side, so entry should be taken only after confirmation. For now, it is in a no-trade zone.

TMPV at major supportOverall structure is down but there's a major support 320 levels
Current candle shows relief bounce.

CIPLA – When Candlesticks Tell the Real StoryNotice how price keeps getting rejected at the upper channel while buyers defend the lower boundary. The candlesticks clearly show hesitation, rejection, and acceptance at key levels. This is not about predicting a move, but about understanding how price behaves inside a structure. When you read can

See all stocks ideas
No scheduled reports
Today
N
NVFYKSH International Ltd.
Exchange
BSE
Offer price
4.254
USD
Today
K
KSHINTLKSH International Ltd.
Exchange
BSE
Offer price
4.254
USD
Tomorrow
5
544512Marc Technocrats Limited
Exchange
NSE
Offer price
0.98 - 1.03
USD
Tomorrow
H
HYPE3Global Ocean Logistics India Ltd.
Exchange
BSE
Offer price
0.81 - 0.86
USD
Dec 30
5
544562Gujarat Kidney & Super Speciality Ltd.
Exchange
NSE
Offer price
—
Dec 30
N
NFLDSundrex Oil Company Limited
Exchange
NSE
Offer price
0.90 - 0.96
USD
Dec 30
MAEDachepalli Publishers Limited
Exchange
BSE
Offer price
—
Dec 31
5
544500Bai-Kakaji Polymers Limited
Exchange
BSE
Offer price
1.96 - 2.06
USD
Dec 31
5
544599Apollo Techno Industries Limited
Exchange
BSE
Offer price
1.35 - 1.43
USD
Dec 31
6
601088Admach Systems Ltd.
Exchange
BSE
Offer price
2.49 - 2.63
USD
See more events
Community trends
BTC idea around 24 hours LiqudityThere is a short-term bullish setup for BTC to go back to 94k. Also, the liquidity has shifted to little upward around 88k, suggesting the market is in short-term relief and Macro BullTrap
1. Retest around 88.7K - Probability 70%
2. Retest the local high around 95k - Probability 67%
3. The retest

Bull Run at a Critical PointThe last hope for bull continuation on the weekly chart lies in the $86K–$74K demand zone.
✅ A strong weekly rejection from this level is mandatory
✅ Followed by a daily close above $107,400
❌ If $107.4K is not reclaimed, this move is just a relief rally in a bearish trend, with more downside ahea

Short setup on BTC 4HBTC has been in Weekly downtrend.
with today's LTF pump it has reached it premium zone in the weekly swing leg.
will wait in 15min-1H for entry confirmation.

Weekly Analysis of BTC with Buy/Sell scenarios...We analyzed three weeks back that BTC would be in range for some time before taking any further move, And BTC is following same analysis and trapped within a small range since then. BTC prediction of last week also worked perfectly well and market kept in consolidation mode itself. BTC is still in c


BTC - Break out on 1DThis is key level to watch!
Break out of long down trend is entry as it’s already faked out a support and rallying!
It will be a Relief rally if it breakouts.

BTCUSD Short Trade - Precision Execution BTCUSD Short Trade – Precision Execution 📉
BTCUSD short trade executed and managed as planned.
Entry: 89,000
Stop Loss: 89,760
Target: 87,600
Partial profits booked, risk controlled, and execution stayed disciplined.
No emotions. Just levels and management.
#BTCUSD #Bitcoin #CryptoTrading #ShortTr

BTCUSD (Bitcoin) ViewBitcoin Technical Analysis:
Testing Key Diagonal Support – Bearish Risk Ahead?
Bitcoin (BTC/USD) is currently trading around $89,500–$90,000 as of December 22, 2025, showing some intraday volatility but holding onto an overall uptrend from recent lows.
Looking at the 1-hour chart, price is ri


POWRX/USDT (Crypto Setup)
POWRX/USDT is showing bullish continuation strength, indicating a potential upside breakout. A Buy Stop is placed at 0.08373, confirming entry only after price acceptance above resistance. The first upside objective is 0.08463, followed by an extended target at 0.08573, where partial or full profit

See all crypto ideas
NG : bullish for another highthere is a 5th wave which is pending. which will lead prices to another high in coming weeks or months

Silver Intraday: Exhaustion Sell Near Upper Bollinger BandTrading Day - Monday (22nd Dec 2025)
Entry : Sell
Entry Zone: 208,000 – 208,200
Stop Loss: 208,760
Targets: MCX:SILVER1!
T1: 207,000
T2: 206,000
Reason:
* Upper BB rejection candle → momentum exhaustion
* PSAR dots compressing → trend strength weakening
* Vertical rally without pullback → corr

US OIL Intraday AnalysisOverview: WTI has rebounded sharply from the lower channel support near 55.00, forming a short-term base and printing higher lows. Price is now reclaiming the mid-Bollinger band around 57.00, indicating improving bullish momentum. A sustained move above 57.50 can open upside toward 58.10–58.50 resis

Gold Trading Strategy for 23rd December 2025🟡 GOLD TREND TRADING PLAN ($)
📈 BUY SETUP
🟢 Entry:
Buy only if the 1-Hour candle closes above 4483
🎯 Targets:
T1: 4494
T2: 4505
T3: 4518
🛑 Stop-Loss:
Below 1-Hour candle low
Or fixed SL: 4468
📉 SELL SETUP
🔴 Entry:
Sell only if the 1-Hour candle closes below 4410
🎯 Targets:
T1: 4395
T2: 4380
T3: 43

XAUUSD – Lana prioritises Buy on pullbacksXAUUSD – Lana prioritises Buy on pullbacks 💛
Uptrend confirmed: Lana prioritises Buy on pullbacks 💛
Quick Summary
Trend: Strong bullish, no clear signs of correction
Status: New ATH has been established
Timeframe: H1
Strategy: Focus on Buy setups, waiting for pullbacks into liquidity zones
Mark

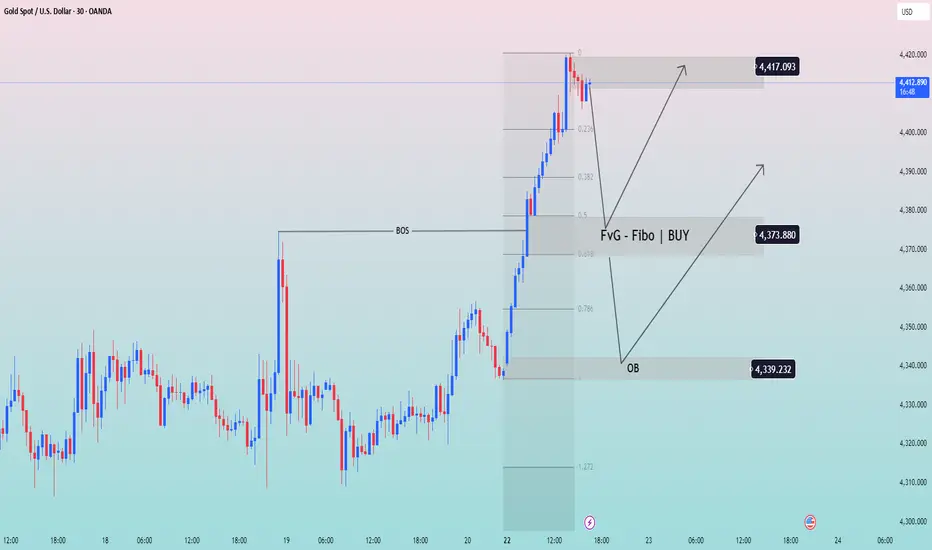
XAU/USD: Buy on BOS, FVG + Fibo retracement!◆ Market Context (M30)
Gold has just broken the rising BOS and created a strong push to the short-term peak area of 4,417. After the impulse, the market enters a pullback to rebalance—a common behavior before continuing the main trend.
◆ SMC & Price Action
• The rising structure remains valid (HH–H
GIFTY 500 Points Rally possible in next 10 trading sessions.GIFTY 500 Points Rally possible in next 10 trading sessions.
GIFTY is seen making bottom around 25780 & can now breaking down trending channel.
500 Points Rally possible in next 10 trading sessions.
LTP - 26000
Targets - 26500+
Timeframe - 8-10 days.
Banking & IT sector looking strong for next

XAGUSD ANALYSISAs per my analysis we can see correction in both silver and gold and we can see a new last high in upcoming months as per this market can form now abc pattern as a corrective pattern it will takes time. as per my view high is formed of 3rd wave and now silver is in correction.
you can post your com

Silver Spot Viewsilver sell price 67.25 to 67.66
Target 65.00,63.25
Sl 68.70 Above sustain
view is for study purpose only, we are not recommend any trade or investment

XAUUSD (H4) – Weekly Outlook (Dec 22–26)Buy the dip inside the channel, watch for a short-term correction after Wave 5
Strategy summary for next week
On the H4 chart, gold is still trading inside a mid-term rising channel. However, the wave structure suggests Wave 5 is likely finished, so next week I’m focusing on two main ideas:
Mid-te

See all futures ideas
USDINR VIEWUsdInr Cmp 89.67
Wave 4 88.30 , 87.60 took support
wave 5 92.50 , 94.00
wave 5 97.70 , 99.30 , 101.00
86.70 below Sustain or close below invalidation
View is for study purpose only , we are not recommend any trade or investment
Always do your own analysis

USD/CAD – Liquidity & Structure Based Short IdeaUSD/CAD has been trading inside a well-defined rising channel for a while. Price is now approaching the upper boundary of this channel, a zone where sellers have previously stepped in with strength.
This area is not just resistance, it’s also a liquidity zone, where stop-losses of late buyers are r

GBP/USD Signals Trend Shift – Impulsive Upside ExpectedThe chart shows that GBP/USD has completed a full W–X–Y corrective pattern, with the final wave (y) and its C wave forming a clean bottom near the long-term support line. From that low, price has started a strong upward move, which looks like the beginning of a new impulsive Wave 1. The current pull

EUR/USD – Trap or Trend Continuation?EUR/USD – Trap or Trend Continuation?
The market has recently transitioned from a strong directional advance into a phase of hesitation and balance. After a sustained upward expansion marked by clear momentum and orderly price progression, buying pressure has begun to slow. This slowdown is evident

Aud Cad Short-Term Downtrend: The short-term trend has been identified as being "DOWN" since December 10, 2025, indicating that minor, temporary corrections might occur within the larger bullish trend.
Resistance Zones: The price is testing strong resistance or supply zones around the 0.9140–0.9150 area, wh

EUR/USD bullish in 4hr time frameThe current chart looks like bullish in 4hr time frame for an target of 1.8040

CHFJPY – Monthly Top Wick Expected This Week.Waiting for 2026CHFJPY is currently in a higher-timeframe bullish structure.
This week, price may form a top wick on the monthly candle, indicating short-term pause or consolidation.
From the second week of January, if volume supports the move, bullish continuation to the upside is expected.
This is a higher-time

Triangle Compression Zone🔎 Overview
The Triangle Compression Zone highlights a phase where price transitions from directional movement into consolidation. After an initial trend, price begins to contract between converging support and resistance lines, signaling reduced volatility and temporary market balance.
-------

EUR/USD Decision PhaseEUR/USD Decision Phase
Recent candles indicate a slowdown in upside follow-through, implying that short-term positioning may be crowded. This pause does not immediately invalidate the broader constructive tone but introduces the risk of a corrective rotation as liquidity is rebalanced. The projecte

EURUSD-Short-15MThe trade was initiated based on a high-probability setup identified through a confluence of technical factors.
Higher Timeframe (HTF) Analysis: Price action on a higher timeframe (15 MIn) demonstrated a perfect retracement into a previously identified order block (OB). This order block represente
See all forex ideas
| - | - | - | - | - | - | - | - | ||
| - | - | - | - | - | - | - | - | ||
| - | - | - | - | - | - | - | - | ||
| - | - | - | - | - | - | - | - | ||
| - | - | - | - | - | - | - | - | ||
| - | - | - | - | - | - | - | - | ||
| - | - | - | - | - | - | - | - | ||
| - | - | - | - | - | - | - | - | ||
| - | - | - | - | - | - | - | - |
Trade directly on Supercharts through our supported, fully-verified, and user-reviewed brokers.


