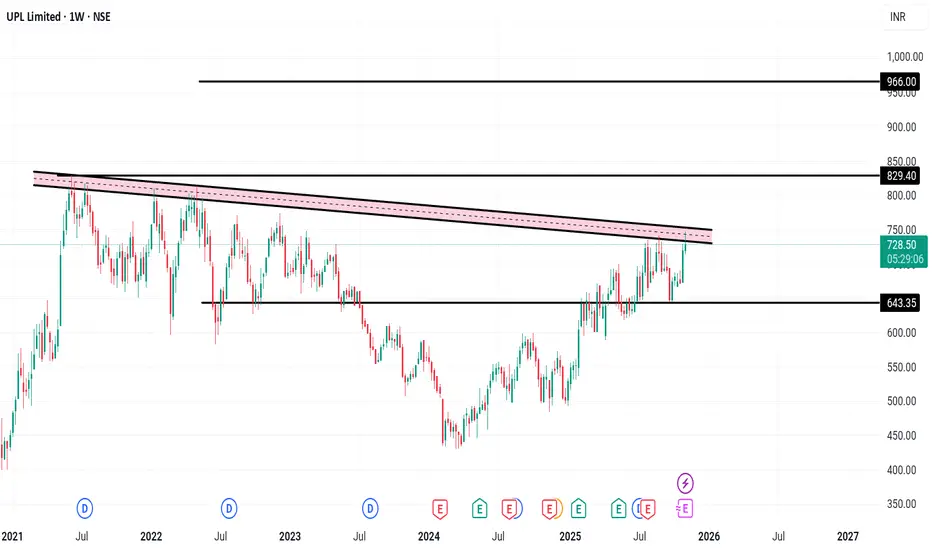
UPL Limited – Weekly Chart Analysis
📊 UPL Limited – Weekly Chart Analysis
Company Overview:
UPL Limited is a global leader in sustainable agricultural solutions, ranked among the top five agricultural solutions companies worldwide. The company operates across multiple countries, offering an integrated portfolio of patented and po

The best trades require research, then commitment.
Get started for free$0 forever, no credit card needed

Scott "Kidd" PoteetThe unlikely astronaut

Where the world does markets
Join 100 million traders and investors taking the future into their own hands.
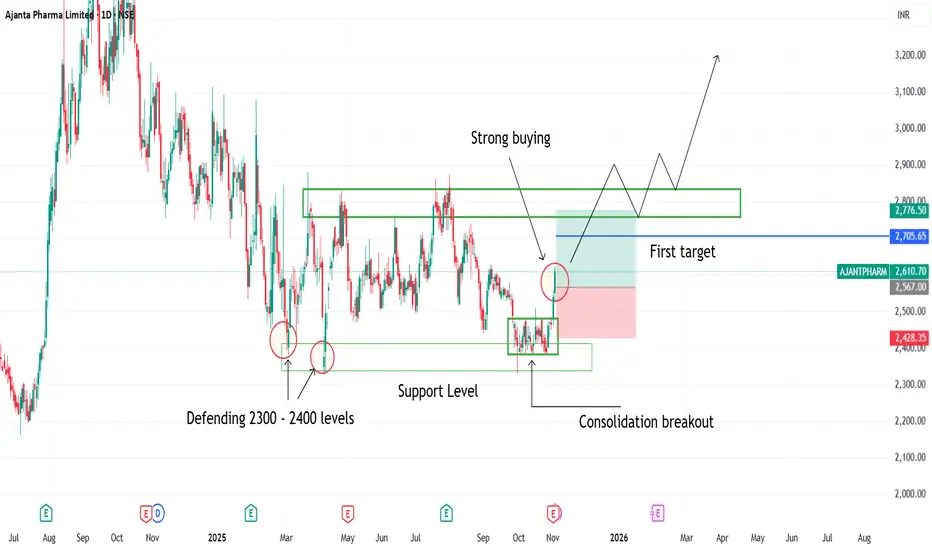
Consolidation breakout seen in ajanta pharma1. Consolidation breakout seen in ajanta pharma
2. Buyers defending 2300 2400 levels
3. Strong Bullish candles indicating strong buyers strength
4. Consolidation breakout has been happened on support levels
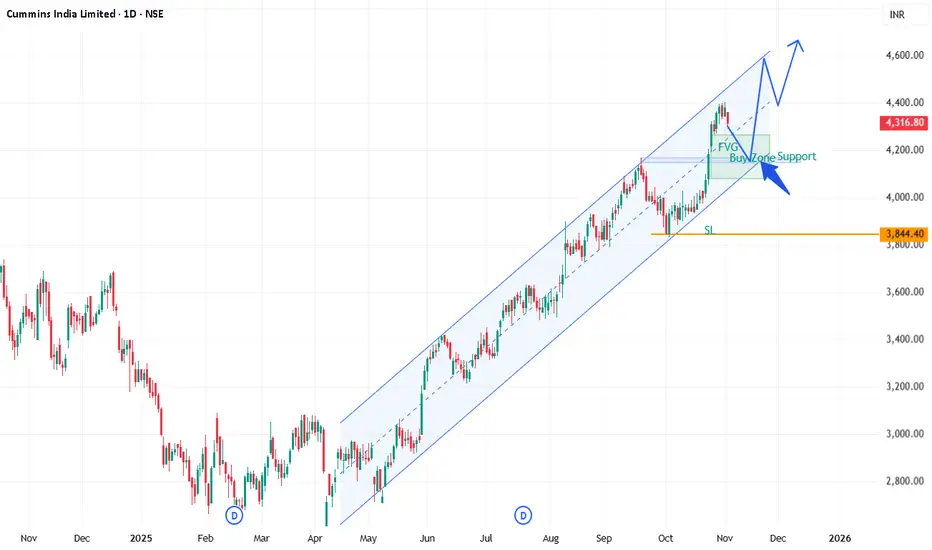
CUMMINSINDCUMMINSIND, Channel support, FVG entry, risk:reward 1:1.5
Cummins India Limited (CUMMINSIND) reported strong financial results for the second quarter (Q2) of FY 2025-26:
Revenue: ₹2,444 crore, up 31% YoY and 8% QoQ, driven by 47% domestic sales growth despite a 13% YoY export decline.
Net Prof
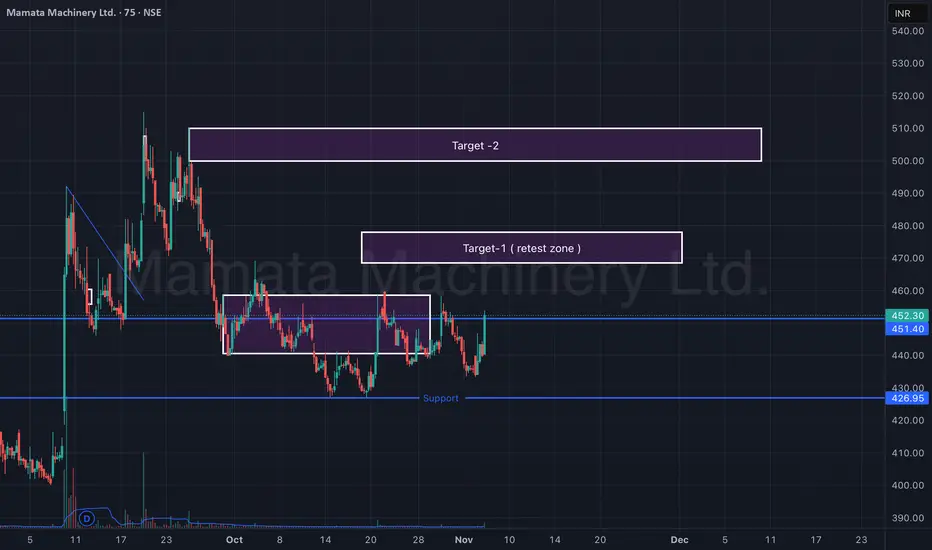
Mamata Machinery Ltd – Support Reversal & Retest Zone (75-min)Mamata Machinery is showing early signs of reversal from a strong support zone around ₹425–₹430. After forming a double-bottom-like structure, the stock has bounced sharply with rising volumes, indicating a possible short-term trend reversal.
Currently, price action is approaching a retest zone (Ta
KPILAscending Channel (Main Structure)
• The stock is trading within an upward-sloping channel, making higher highs and higher lows.
• The lower trendline acts as dynamic support, and the upper trendline as resistance.
Rectangle / Box Range (Recent Phase)
• Price consolidated between 1,220–1,310 for

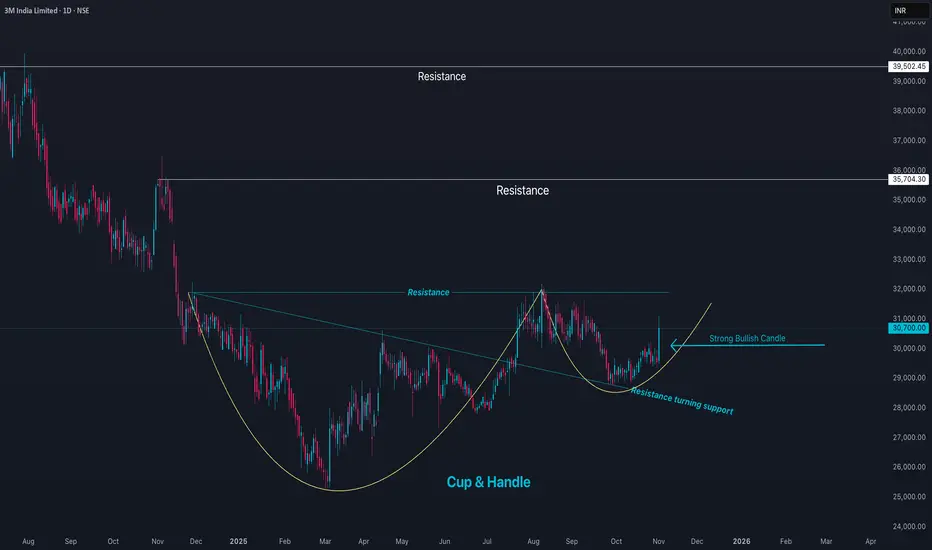
3MINDIA Price Action3M India Limited (3MINDIA) is currently trading around ₹30,865, marking a strong 4.4% rise in the latest session. The stock has a 52-week high near ₹37,133 and a low around ₹25,718, placing it closer to the upper end of its annual range. The market capitalization is approximately ₹33,300 crore.
3M
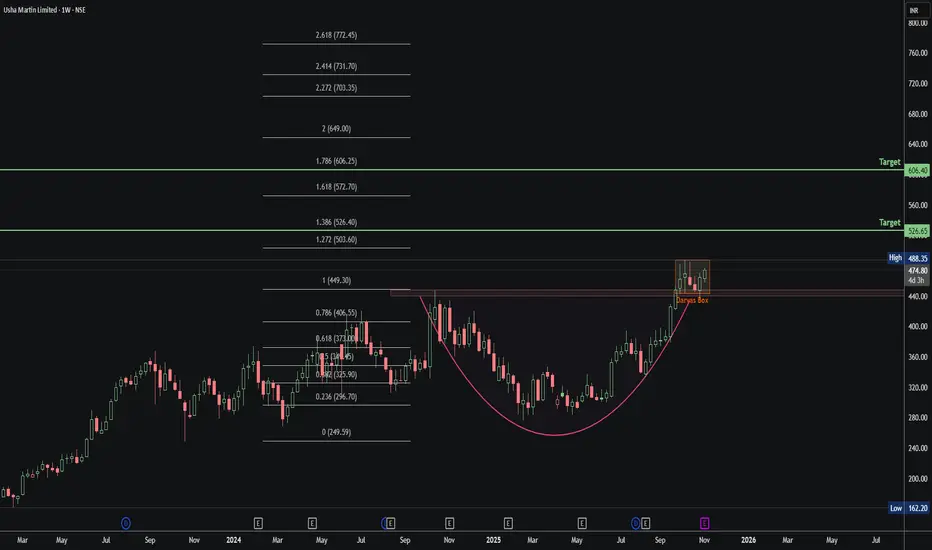
Usha Martin: Cup & Handle Breakout Loading!🧩 1. Cup & Handle Setup
Smooth U-shaped Cup with a tight Darvas Box Handle on top.
Classic bullish continuation structure — breakout confirmation above ₹488.
📈 2. Fibonacci Outlook
0.786 (₹406) → Neckline retest
1.0 (₹449) → Cup breakout
1.272 (₹503) / 1.386 (₹526) → 🎯 Short-term targets
1.61
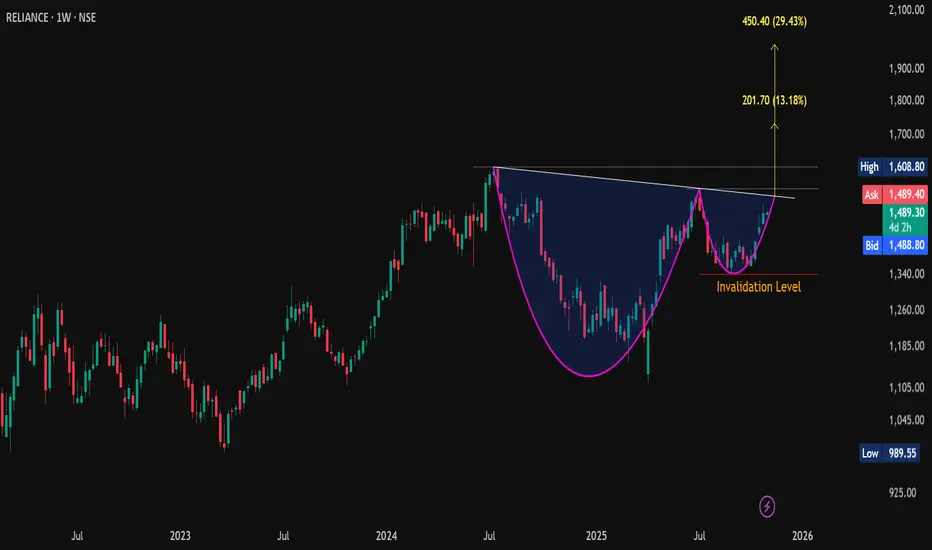
#Reliance | Cup & Handle Breakout Setup📊 CMP: 1489
💥 Breakout Level: WCB above Handle Neckline
🎯 Pattern Targets: 1730 / 1980+ (16 & 33% from CMP)
🛡 Support: 1456 / 1407-1409
🚧 Resistance: 1527-1551 / 1597-1609
❌ Invalidation Level: Below 1340.60 (WCB)
#CupnHandle #ChartPattern #PriceAction #SwingTrade
📌 Disclaimer: Thi
Privi Speciality Chemicals Ltd – Weekly Breakout SetupPrivi has shown a clean breakout from a long consolidation zone, backed by steady volume expansion. After months of range-bound action, the stock finally broke above ₹2,600 and is now sustaining well above its breakout zone — indicating the start of a new upward leg.
Price action shows strong bullis

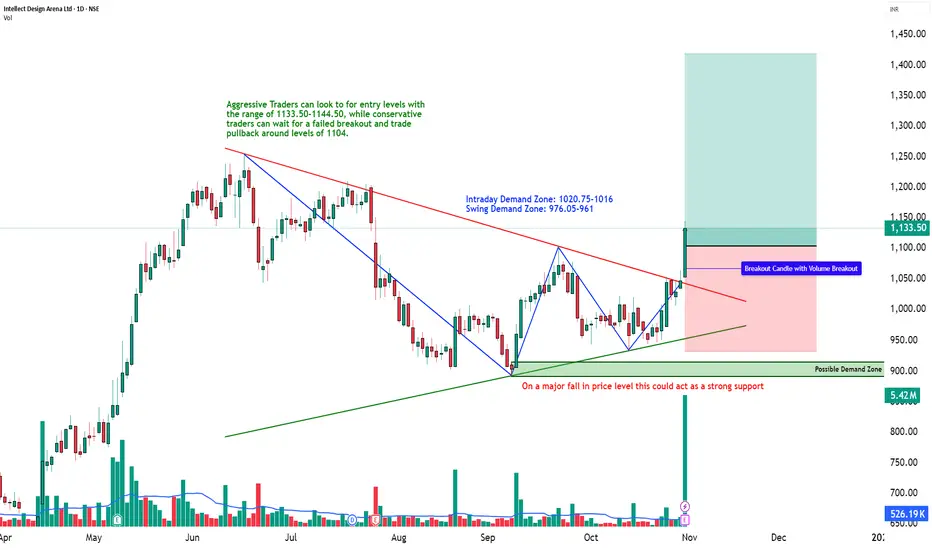
Descending Triangle Breakout with Institutional Volume | STWP💹 Intellect Design Arena Ltd (NSE: INTELLECT)
Sector: IT – FinTech Solutions | CMP: ₹1,133.50 | View: Bullish Momentum Breakout Setup
📊 Price Action:
Intellect Design Arena has delivered a strong bullish breakout from its multi-month descending trendline, marking a structural shift from a consolida
See all editors' picks ideas
PriceFormatLibrary for automatically converting price values to formatted strings
matching the same format that TradingView uses to display open/high/low/close prices on the chart.
█ OVERVIEW
This library is intended for Pine Coders who are authors of scripts that display numbers onto a user's charts. T

LogNormalLibrary "LogNormal"
A collection of functions used to model skewed distributions as log-normal.
Prices are commonly modeled using log-normal distributions (ie. Black-Scholes) because they exhibit multiplicative changes with long tails; skewed exponential growth and high variance. This approach i

Range Oscillator (Zeiierman)█ Overview
Range Oscillator (Zeiierman) is a dynamic market oscillator designed to visualize how far the price is trading relative to its equilibrium range. Instead of relying on traditional overbought/oversold thresholds, it uses adaptive range detection and heatmap coloring to reveal where pri

Volume Surprise [LuxAlgo]The Volume Surprise tool displays the trading volume alongside the expected volume at that time, allowing users to spot unexpected trading activity on the chart easily.
The tool includes an extrapolation of the estimated volume for future periods, allowing forecasting future trading activity.
🔶 U

Smooth Theil-SenI wanted to build a Theil-Sen estimator that could run on more than one bar and produce smoother output than the standard implementation. Theil-Sen regression is a non-parametric method that calculates the median slope between all pairs of points in your dataset, which makes it extremely robust to o

Fair Value Gaps by DGTFair Value Gaps
A refined, multi-timeframe Fair Value Gap (FVG) detection tool that brings institutional imbalance zones to life directly on your chart.
Designed for precision, it visualizes how price delivers into inefficiencies across chart, higher, and lower (intrabar) timeframes — offering a fl

TASC 2025.11 The Points and Line Chart█ OVERVIEW
This script implements the Points and Line Chart described by Mohamed Ashraf Mahfouz and Mohamed Meregy in the November 2025 edition of the TASC Traders' Tips , "Efficient Display of Irregular Time Series”. This novel chart type interprets regular time series chart data to create an ir

Simplified Percentile ClusteringSimplified Percentile Clustering (SPC) is a clustering system for trend regime analysis.
Instead of relying on heavy iterative algorithms such as k-means, SPC takes a deterministic approach: it uses percentiles and running averages to form cluster centers directly from the data, producing smoo

Adaptive Volume Delta Map---
📊 Adaptive Volume Delta Map (AVDM)
What is Adaptive Volume Delta Map (AVDM)?
The Adaptive Volume Delta Map (AVDM) is a smart, multi-timeframe indicator that visualizes buy and sell volume imbalances directly on the chart.
It adapts automatically to the best available data resolution

Dynamic Equity Allocation Model"Cash is Trash"? Not Always. Here's Why Science Beats Guesswork.
Every retail trader knows the frustration: you draw support and resistance lines, you spot patterns, you follow market gurus on social media—and still, when the next bear market hits, your portfolio bleeds red. Meanwhile, institution

See all indicators and strategies
Community trends
UPL Limited – Weekly Chart Analysis
📊 UPL Limited – Weekly Chart Analysis
Company Overview:
UPL Limited is a global leader in sustainable agricultural solutions, ranked among the top five agricultural solutions companies worldwide. The company operates across multiple countries, offering an integrated portfolio of patented and po
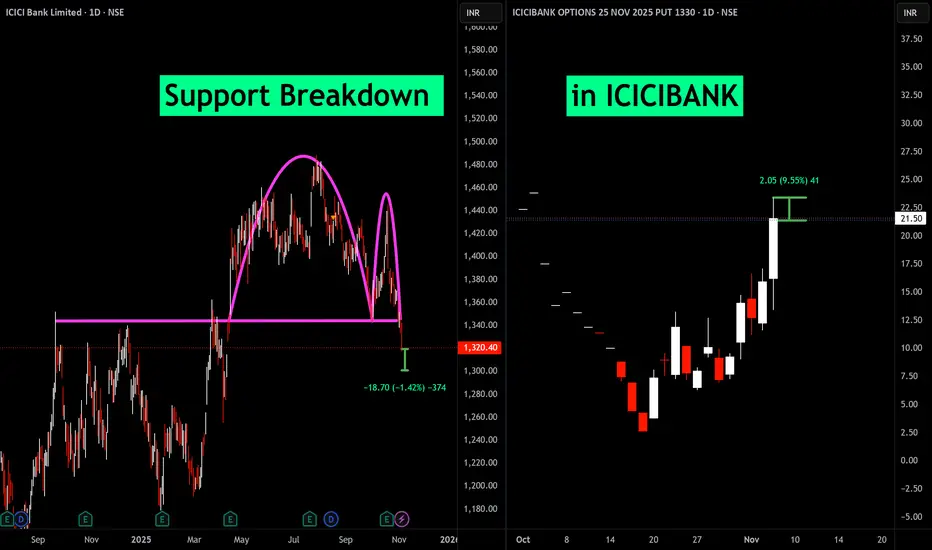
Support Breakdown in ICICIBANKThe breakdown of a key support level typically signals that sellers have gained control over the stock, which often leads to further declines.
The chart shows ICICI Bank's daily price slipping below strong support, which traders watch carefully to time short or protective put option trades.
Buying
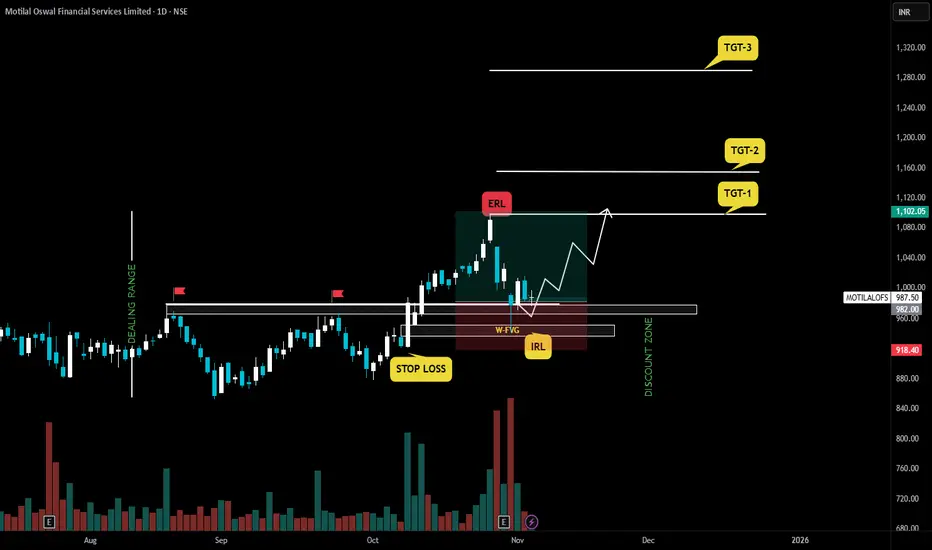
MOTILAL OSWAL FINANCIAL SERVICESBias: Bullish overall — structure is intact (higher highs, higher lows).
Where we are: Retracing into support (FVG/IRL area).
Plan: Wait for signs of reversal from this zone (bullish candle, volume pickup, or rejection wick).
Entry Zone: Around ₹960–₹980, ideally on confirmation.
Stop Loss: Belo
VCP Formation within Symmetrical Triangle above 200 EMAThis chart displays a Volatility Contraction Pattern (VCP) developing within a classic symmetrical triangle on the daily timeframe. Two sharply converging trendlines encapsulate the price action with the lower line connecting a series of higher lows (the trendline) and the upper line linking lower h
Suzlon Long1. The stock was in a downtrend phase.
2. A minor pullback or retest is possible, but it’s likely to find support at the trendline.
3. The target is set at 70, with a stop loss placed below the trendline on a closing basis.
4. Given strong fundamentals and assuming market conditions stay stable,

India Cement setupWeekly time frame setup entry when weekly close above 9ema and 9 ema below 50 sma and both above 200 ema
(9 EMA below 50 EMA) both above 200 EMA
risk:reward= 1:4
stoploss below 200 ema close weekly candle or weekly candle close below swing low.
India Cements latest financial update and key featu

CCL PEAD Setup: Gap Up Earning Reaction, Awaiting Post-Earnings This TradingView chart captures CCL’s daily price action leading up to and immediately following a significant earnings-driven gap up on November 6, 2025. The annotation highlights a gap up sparked by the latest earnings matrix, while the chart advises waiting for PEAD (Post-Earnings Announcement Dr

Suzlon Energy Ltd – EMA Crossover & Volume Confirmation (Daily CSuzlon Energy has shown a bullish EMA crossover on the daily chart, supported by a strong volume burst, signaling renewed buying interest after a corrective phase. The price has reclaimed the baseline resistance zone (₹59–₹61), and a sustained move above it could open the path toward the next major

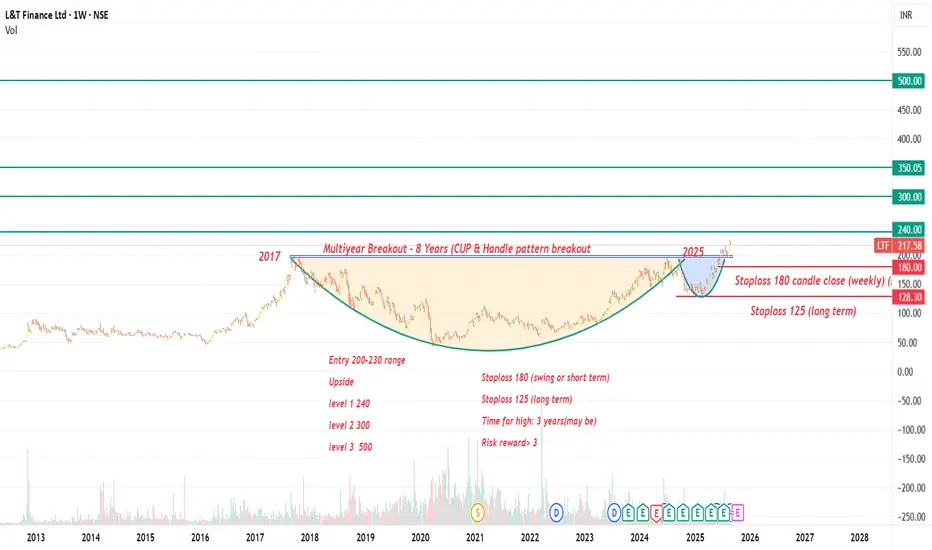
L&T Finance Multiyear breakout. good returns on card!!!After eight years of long consolidation LTF share price broke out, forming cup and handle pattern. This breakout could give good returns if it goes up
Entry- 200-230 range
Target 1 250
Target 2 300
Target 3 500
Stoploss 180 &125
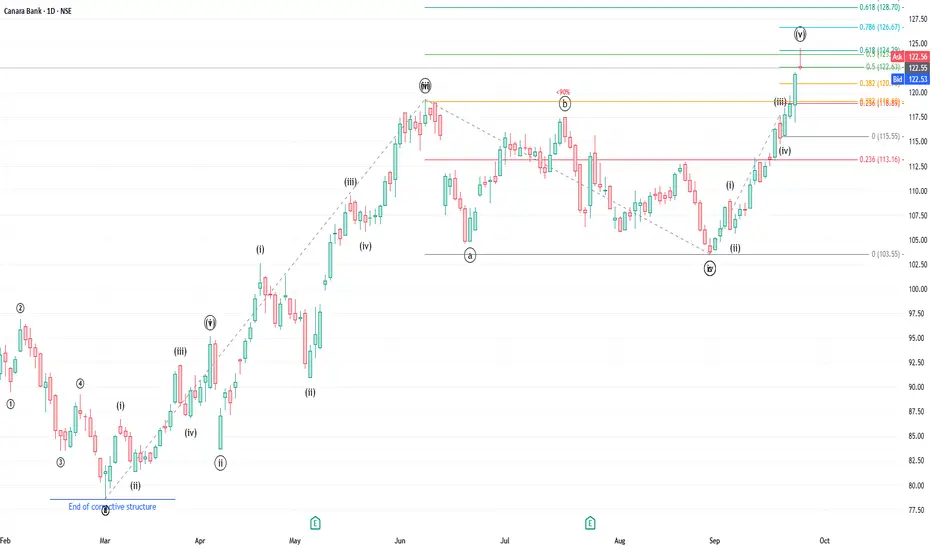
Canara Bank – Wave V Completed, Time to Exit
Canara Bank has been in a strong uptrend since 3 Mar 2025, forming a clear 5-wave impulse.
Wave 1 peaked on 3 Apr 2025, followed by a simple correction in Wave 2.
Wave 3 peaked on 9 Jun 2025 and extended to a little over 2x the length of Wave 1.
Wave 4 was a zigzag correction, in line with the
See all stocks ideas
Tomorrow
APEXApex Frozen Foods Ltd.
Actual
—
Estimate
—
Tomorrow
CRAFTSMANCraftsman Automation Ltd.
Actual
—
Estimate
34.00
INR
Tomorrow
GREENLAMGreenlam Industries Ltd
Actual
—
Estimate
0.50
INR
Tomorrow
LINCLinc Limited
Actual
—
Estimate
—
Tomorrow
NEOGENNeogen Chemicals Ltd.
Actual
—
Estimate
3.58
INR
Tomorrow
IFGLEXPORIFGL Refractories Ltd.
Actual
—
Estimate
—
Tomorrow
PENINDPennar Industries Limited
Actual
—
Estimate
2.40
INR
Tomorrow
LUXINDLux Industries Ltd.
Actual
—
Estimate
—
See more events
Community trends
ETH/USDT (4H) chartETH/USDT (4H) chart:
The price is currently trading near a support zone (around $3,250–3,300).
The chart shows a potential bullish setup with two marked target points above.
The Ichimoku Cloud suggests resistance around mid-levels before a full reversal.
Here’s the breakdown 👇
🔹 Key Levels:
S

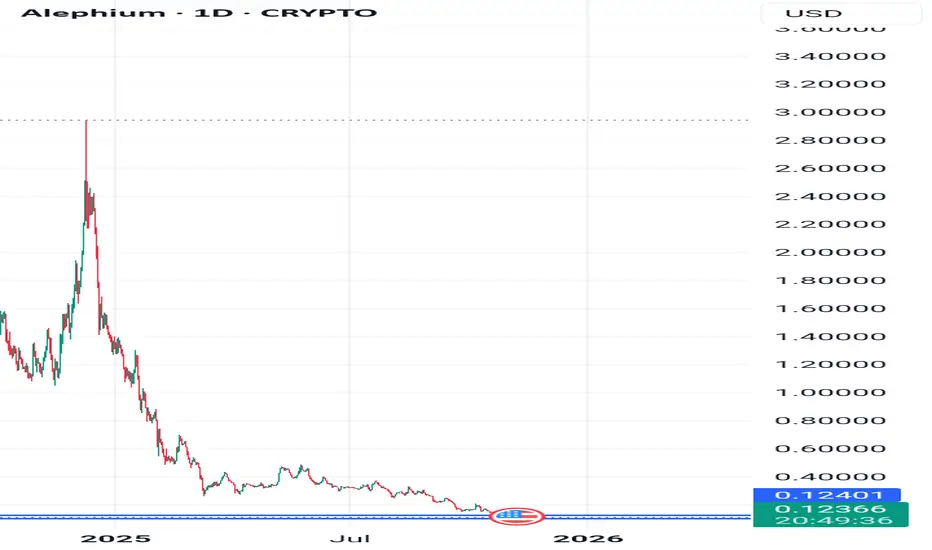
ALPH | Testing 2023 Accumulation Support – Big Reversal Ahead?While the chart shows a significant correction, the current price at the $0.12 critical horizontal support, which served as a robust 2023 accumulation zone, presents a highly positive outlook for a potential strong bullish reversal. The psychological $0.10 level offers additional support, and the as
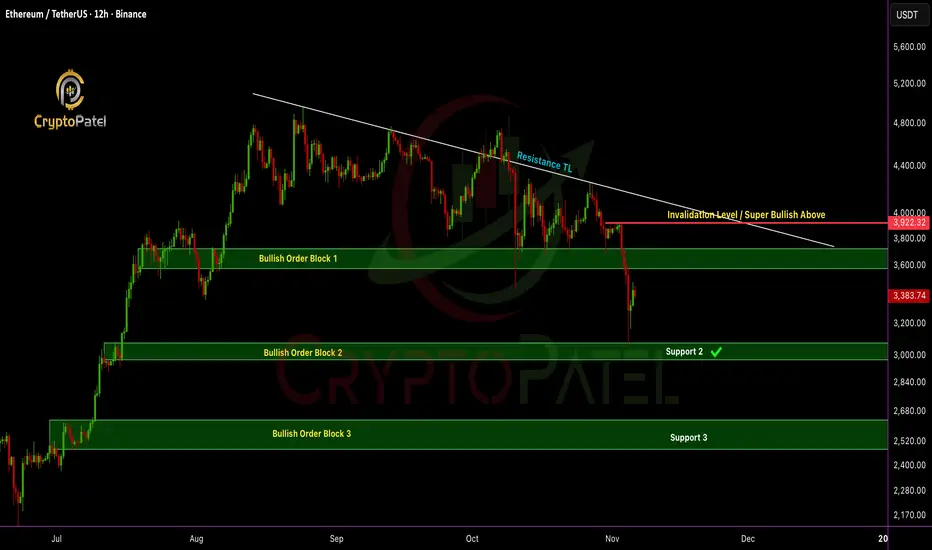
ETH/USDT dumped 20% after my analysisETHEREUM Update: Price just hit the bullish order block at $3,057 and bounced exactly as predicted ✅
Quick recap:
✅ Short-term: I’m bearish below $3,920, next potential leg down $2,500–$2,200 if $3,000 support breaks.
✅ Medium-term: Holding $3,000 support is key, could spark the next bullish wave.
BTCUSD Nice Price Action!!!!!!Patterns explain way more than words do....
Just look the chart....it explains!!!
Just my view!!!
Thank you!!!!

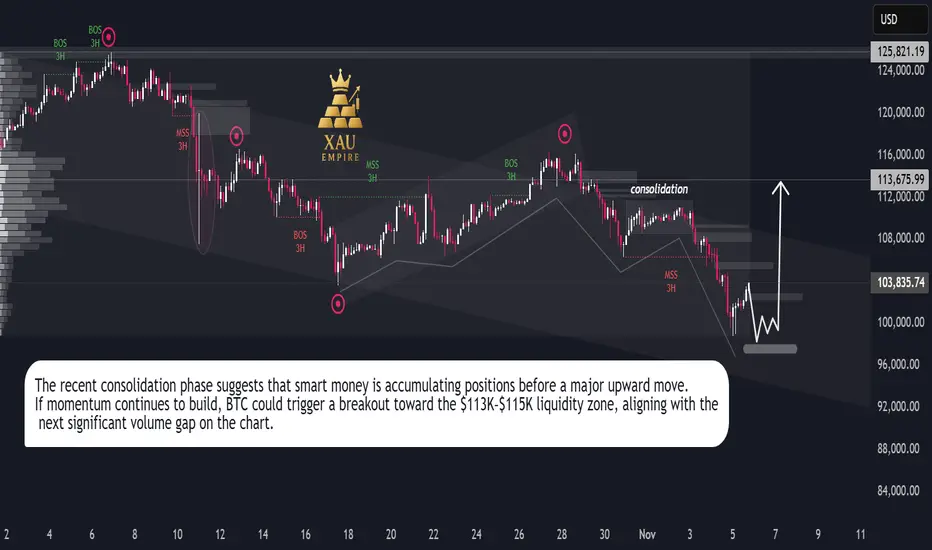
Bitcoin Bulls Target $113K**Bitcoin (BTC/USD) Analysis — November 2025**
Bitcoin has been moving within a controlled downtrend channel, facing continuous lower highs since late October. The market recently went through a **liquidity sweep**, followed by a minor **market structure shift (MSS)** on the 3-hour timeframe. This
BITCOIN SHORTlooking for short on BTC since higher time frame took the liquidity and made a LL on HTF. and LTF now aligns with HTF

BTC is showing bullish momentum and eyeing further upside.Hi traders! 👋
Wishing you a profitable trading day ahead 💪
Bitcoin is showing signs of recovery after a local pullback.
If the bullish momentum continues, the next targets are:
🎯 TP1: 107,000
🎯 TP2: 110,500
As long as the price stays above 103,000, the bullish scenario remains valid.
A break belo

15 MINUTES CANDLE CHART ANALYSIS$XAU/USD BUY NOW
ENTERY NOW 4006.00
TP 1 4030.00
TP 2 4050.00
TP 3 4070.00
TP 4 4100.00
SL 3964.00
Do not use more than 2X leverage.

BTC GOOD VOLUMES AT DOUBLE BOTTOM WITH A CLEAN REJCTION I AM SITTING IN BUY POSITION OF BTC RIGHT NOW AS YOU CAN SEE CLEAN REJECTION FROM SUPPORT ZONE WITH A BULLISH CANDLE
( 4 hour Swing trade )
LET SEE !!!! GOOD LUCK 🚀
TRUST THE PROCESS
✅ Disclaimer: This is not a buy or sell recommendation. Please do your own research before making any trading

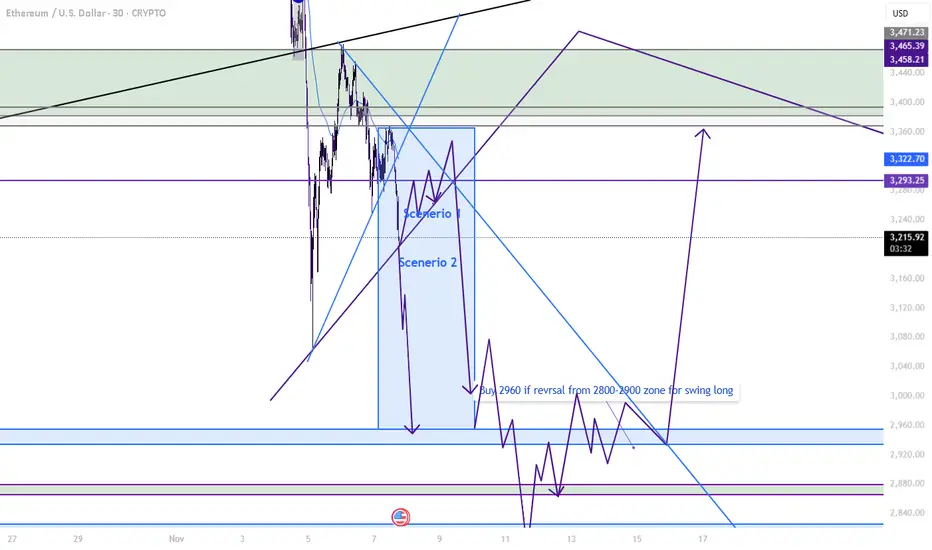
Eth path should be this for next few daysIn my mind the 1st scenerio could work if sudden fall may be scenerio 2 is work lets see guyz
See all crypto ideas
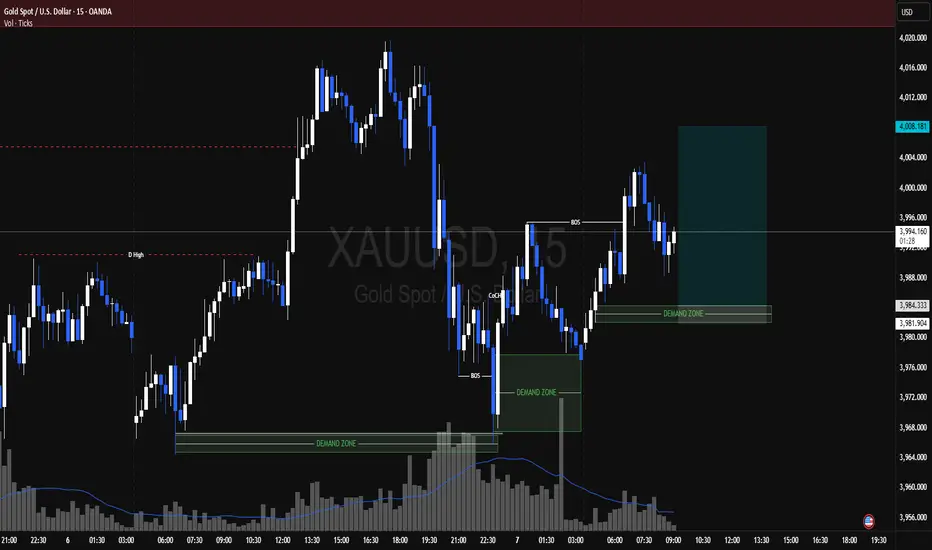
XAUUSD BUYGold is in a consolidation before pushing up. these are internal structure level for small trade.
if it comes down to Nearby small demand we can see a small buy orders pushing price to supply.
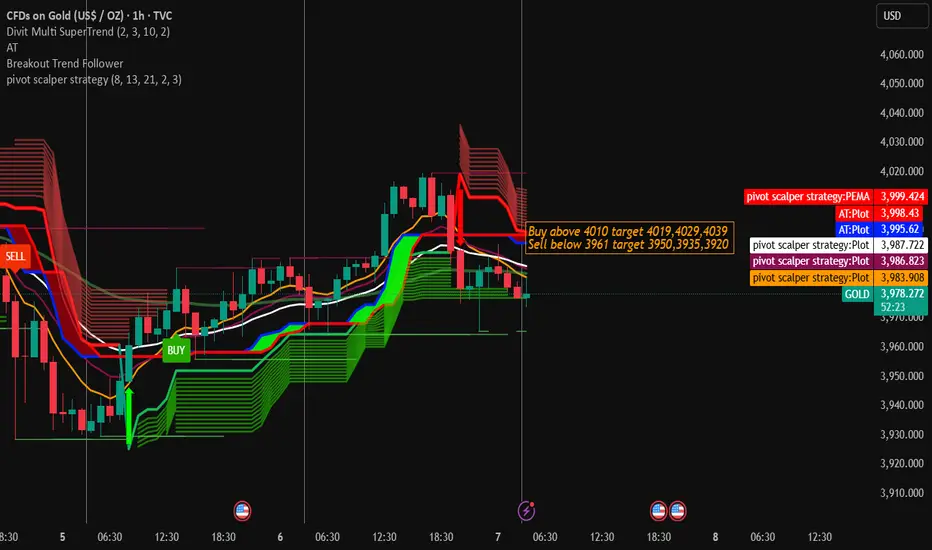
Gold Trading Strategy for 07th November 2025💰 GOLD TRADING PLAN (INTRADAY SETUP)
🟢 BUY SETUP (LONG TRADE)
📈 Entry Condition:
Wait for a 1-hour candle to close above ₹4010.
Once the candle closes, buy only if the price stays above ₹4010.
🎯 Targets:
🥇 Target 1: ₹4019
🥈 Target 2: ₹4029
🥉 Target 3: ₹4039
🛑 Stop Loss (SL):
Keep a stop los
Gold (XAUUSD) – Bears Eye the 4000 Wall! Short Setup AheadGold is currently trading within a tight range of 3990 – 3960, and price action is now approaching the crucial resistance zone at 3990 – 4000.
📈 This area has acted as a strong supply zone in recent sessions — and could once again attract sellers.
💡 Trading Plan:
🔸 Sell Zone: 4000 – 4003
🎯 Targets

StevenTrading – Gold M30 Plan | S/R – Trendline – POC/VAL ...⚡️ StevenTrading – Gold M30 Plan | S/R – Trendline – POC/VAL (Friday)
📰 Fundamental Analysis (Cash-flow & USD)
Gold remains above the $4,000 mark thanks to increased safe-haven demand and expectations of early Fed easing.
The market still bets on a rate cut in December, reinforcing gold's medium-te

XAUUSD – AWAITING CONFIRMATION OF UPTREND – TARGET 4050💛 XAUUSD – AWAITING CONFIRMATION OF UPTREND – TARGET 4050 🎯
🌤 1. Overview
Hello everyone 💬
Gold today remains in a phase of indecision – waiting for signals to confirm a new trend.
On the H2 chart, the price has broken the downtrend line and is retesting this line. The structure of “higher lows” in

XAUUSD TRADE SETUP @3996.480
stop at AR low 3985.600
tp 4046.615
Last trading day of the week, so caution makes sense. There are a few potential news catalysts that could create some volatility. My bias here is long, and I’m scaling into the position gradually as confluences develop.
Add this pair to your watchlist

USOIL SHORTpro bearish on ltf and gave 5m confirmations to short the setup.
please study at your own risk.

Gold Trading Strategy | November 6-7✅ From the 4-hour timeframe, gold experienced a significant pullback after touching 4019 and is currently in a consolidation phase following a short-term rebound failure. The candlesticks have fallen back below the short-term moving averages, while the MACD continues to weaken.
🔸 Moving Average Str

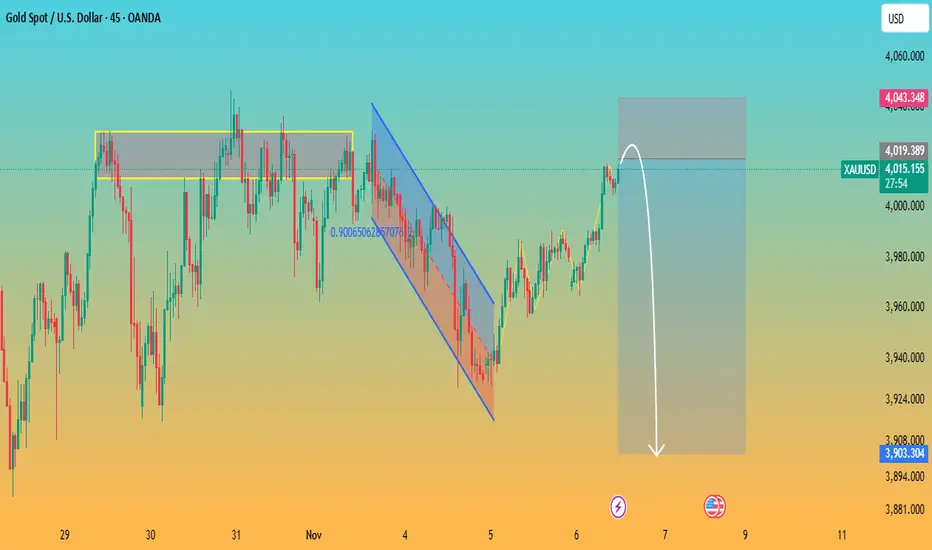
Gold Rejection at Resistance with Potential Bearish PullbackAnalysis:
The chart shows XAUUSD approaching a strong horizontal resistance zone around 4015–4020, a level where price has previously been rejected multiple times (highlighted in yellow). The market recently broke out of a falling channel, showing short-term bullish momentum, but now price is stalli
Silver Price Technical Analysis & Forecast November 2025 Get the latest Silver technical analysis and price forecast for November 2025. Discover critical support and resistance levels, bullish and bearish scenarios, and market momentum. Find out if Silver (XAG/USD) will break higher or see a pullback, with expert insights on trend direction and potential

See all futures ideas
AUD/JPY 4H chartAUD/JPY 4H chart:
The price was in an upward channel, then broke down sharply below both the Ichimoku cloud and the support trendline.
There’s a clearly marked resistance zone around 100.2–100.6, which the price rejected strongly.
The chart shows a target line drawn downward from the breakout are

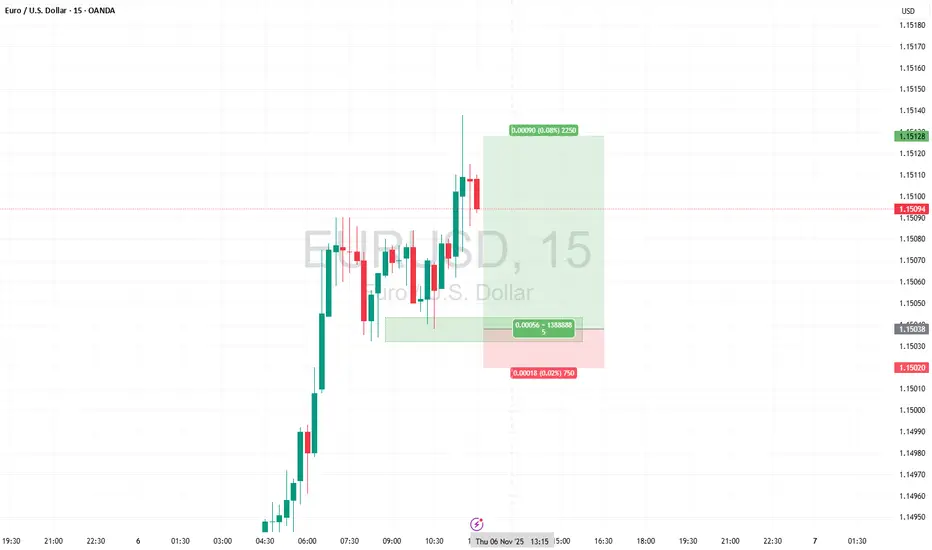
EURUSD Buying Scalp Level 15Min Level Buying
1 Min Good Green Candle Confirmation to Enter
Risk Free at 1:1
Hold for 1:3 Full Booked
AUDNZD - OVERBOUGHT CONDITIONS HINTING AT A POSSIBLE REVERSALSymbol - AUDNZD
CMP - 1.1485
AUDNZD continues to maintain its upward trajectory, supported by fundamental divergence between the two economies. The Australian dollar remains resilient and continues to outperform the New Zealand dollar after the RBNZ implemented an aggressive 50 basis point rate cu

GBPJPYAs you can see price is clearly in an downtrend. Nice push to the downside, and nice recovery back up. And with 4 points being made ( H,L,HL,LL) downtrend is confirmed. I marked 4H supply that aligns with 202.000 handle.
While on the 4H is a downtrend, on daily timeframe, price is in a bullish leg

EURUSD for next month.-> 7 NovPrice is reacting and seeing some `upward` moment before reaching to our `demand` zone.
Expecting a bull in next few week.

AUDUSD - SELLAUD/USD Sell Setup 🦘💵
📉 Primary Trade:
Sell @ 0.6502 — Previous day NY session high
Looking for rejection or liquidity grab around this level.
📉 Backup Trade:
Sell @ 0.6519 — Previous day London session high
Secondary zone if price breaks above NY high.

GBP AUD 0.01 LOT BUY 6/11/2025 23.35
📊 Forex Update (GBP/AUD)
मैंने 0.01 lot की Buy ली है, मार्केट सपोर्ट पर है।
2 दिन वेट करूंगा, अगला अपडेट जल्द दूंगा।
⚠️ Disclaimer: यह मेरी निजी राय है, निवेश सलाह नहीं।
👉 अपनी समझ से काम लें और पूरे भरोसे के साथ ट्रेड करें।
— Irshad Ali
---
📊 Forex Update (GBP/AUD)
Took Buy 0.01 lot, market n


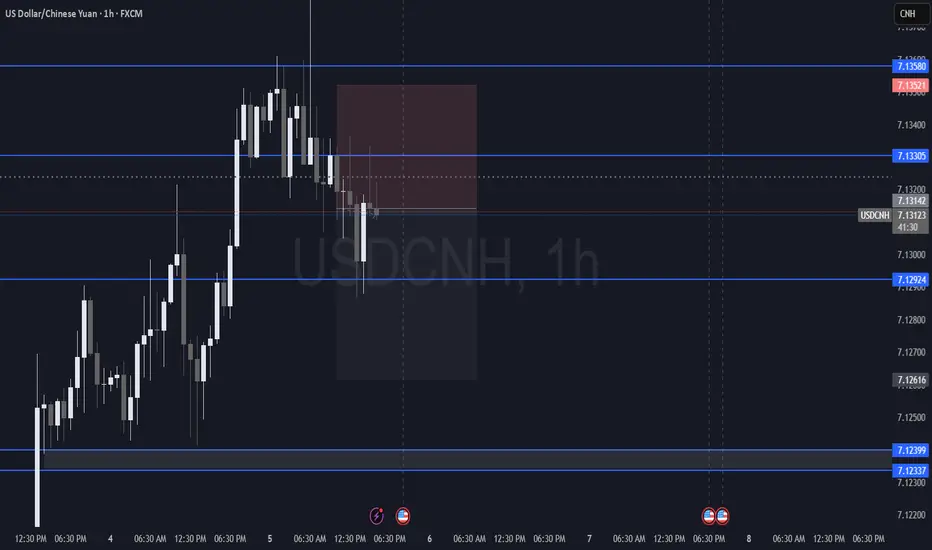
SHORT SELL IN USDCNH with SL AND TP I have Sold USDCNH with keeping in mind market structures current price at resistance showing sellers still in control, price bit choppy but will still hold it with tp and sl .
USD/JPY Rising Wedge Forming – Watch for Possible Reversal AheadUSD/JPY is trading around 153.42 on the 4-hour chart, forming a rising wedge pattern, a structure that often signals a potential bearish reversal after an extended uptrend.
The pair has been climbing within this narrowing channel since mid-October, creating higher highs and higher lows. However, re

See all forex ideas
| - | - | - | - | - | - | - | - | ||
| - | - | - | - | - | - | - | - | ||
| - | - | - | - | - | - | - | - | ||
| - | - | - | - | - | - | - | - | ||
| - | - | - | - | - | - | - | - | ||
| - | - | - | - | - | - | - | - | ||
| - | - | - | - | - | - | - | - | ||
| - | - | - | - | - | - | - | - | ||
| - | - | - | - | - | - | - | - |
Trade directly on the supercharts through our supported, fully-verified and user-reviewed brokers.


