BUY TODAY SELL TOMORROW for 5%DON’T HAVE TIME TO MANAGE YOUR TRADES?
- Take BTST trades at 3:25 pm every day
- Try to exit by taking 4-7% profit of each trade
- SL can also be maintained as closing below the low of the breakout candle
Now, why do I prefer BTST over swing trades? The primary reason is that I have observed that

The best trades require research, then commitment.
Get started for free$0 forever, no credit card needed

Scott "Kidd" PoteetThe unlikely astronaut

Where the world does markets
Join 100 million traders and investors taking the future into their own hands.

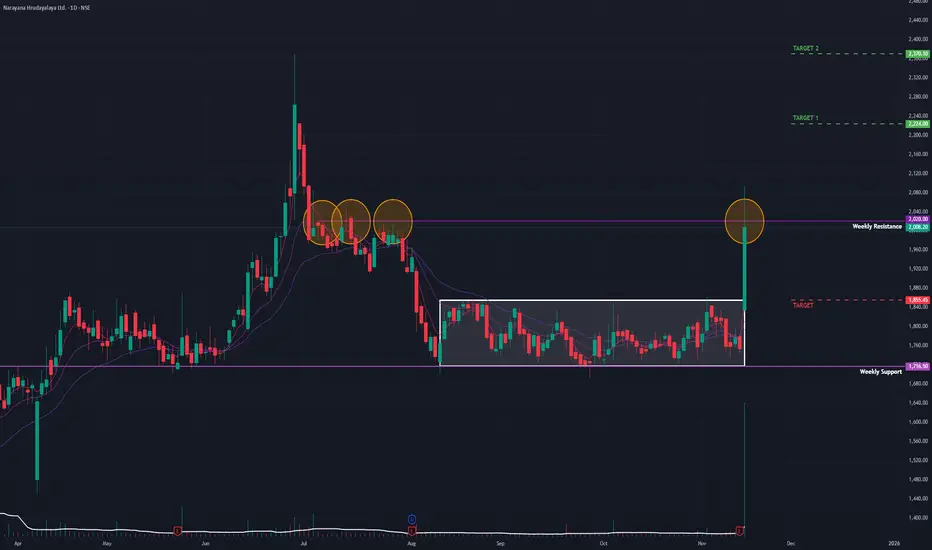
Narayana Hrudayalaya (D): Earnings-Driven BreakoutThe stock has decisively broken out of a 3-month consolidation phase. This technical breakout is powered by a strong fundamental catalyst (Q2 earnings), validating the surge and the high volume.
🚀 1. The Fundamental Catalyst (The "Why")
The breakout is a direct reaction to the company's Q2 FY26
Technical View: Engineers India Ltd (EIL)Pattern Formation
The stock is moving inside a sideways accumulation range between ₹188–₹200.
Multiple swing highs formed in the ₹212–₹220 region created a liquidity pool.
Price repeatedly wicked above these highs, indicating Buy-Side Liquidity Hunt.
Breakout Behaviour
A strong bullish

Money moves the market - Bank NiftyTraders say price moves the market. Bulls or bears move the market etc... But the fact is, money moves the market. You cannot ignore Bank Nifty when analyzing Nifty. When bank sector is supporting, Nifty gives a trending move.
Public sector bank stocks are on the move, while private sector bank stoc

L&T Multiyear BreakoutLarsen & Toubro Limited - Multi-Timeframe Breakout Analysis
Current Price:4,004.40
CRITICAL SETUP ALERT
L&T is at a pivotal moment with breakouts confirmed on weekly and monthly timeframes. The stock is now in a crucial period that will determine the validity of this range breakout.
KEY TECHNICAL

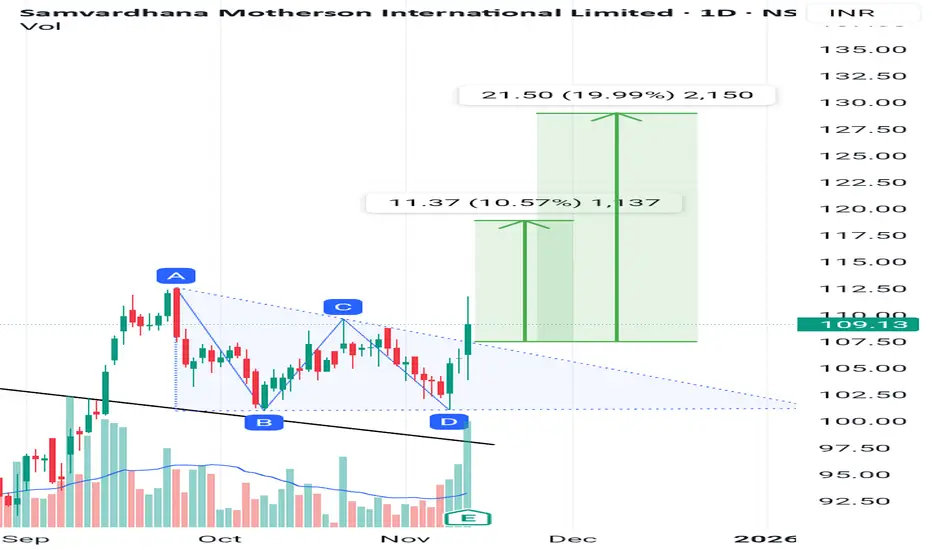
Samvardhana Motherson just made a triangle breakout.will it sustJust broke out of triangle pattern with good volume spike. Volumes are 3 times the average.
It brokeout of treandline on 12 September and gave a move of 10% before entring into consolidation of triangle pattern.
It just broke out of the pattern giving bullish signal.
Indicators
RSI is >60 which is
Asian Paints Turns Colorful Again!Hello Mates! Here’s a chart that really caught my attention this week Asian Paints showing strength after a long phase of quiet sideways movement. The structure is clean, the breakout is sharp, and the message from price action is clear momentum is shifting again.
After spending almost two years in

BANK NIFTY - Technical Analysis Bank Nifty is showing an interesting setup on the weekly chart.
After breaking out above its previous all-time high, the index has started contracting in a tight range, indicating healthy consolidation.
On the daily timeframe, it continues to take support near the 9 EMA, and during minor dips, it

DALMIA BHARATHello & welcome to this analysis
Technical Outlook:
In the monthly time frame its completing the formation of a Cup & Handle breakout suggesting upside levels for medium term 2800 - 3500, for long term 3800 - 5000
Accumulation can be done in the range of 1900 (on downside) 2300 (on the upside).
T

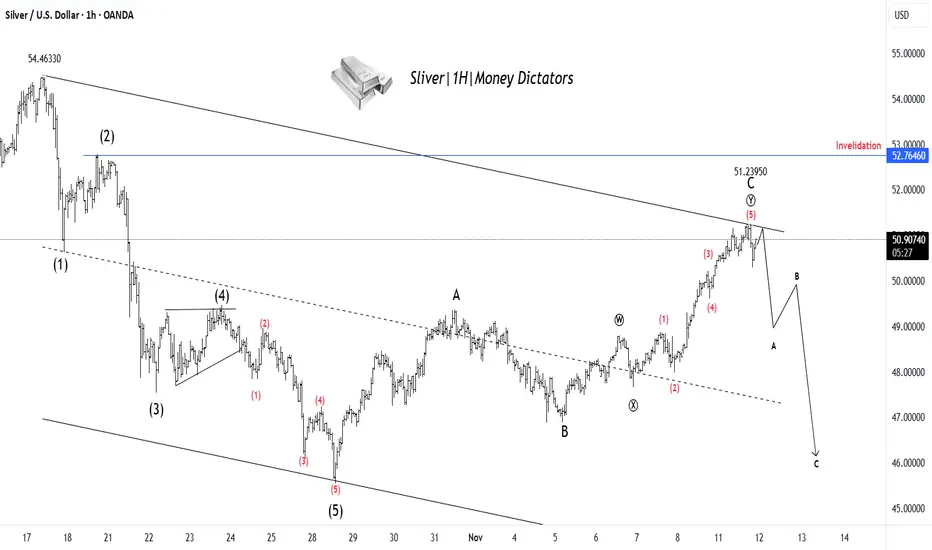
XAG/USD Set for Decline After Finishing Wave YSilver has completed a clear 5-wave upward move, ending near the 51.23 zone, which likely marks the completion of Wave C of the corrective structure. Price action shows rejection from the upper trendline, signaling that buying momentum is fading. This suggests the start of a new A–B–C corrective dec
See all editors' picks ideas
Holographic Market Microstructure | AlphaNattHolographic Market Microstructure | AlphaNatt
A multidimensional, holographically-rendered framework designed to expose the invisible forces shaping every candle — liquidity voids, smart money footprints, order flow imbalances, and structural evolution — in real time.
---
📘 Overview
The Hol

PriceFormatLibrary for automatically converting price values to formatted strings
matching the same format that TradingView uses to display open/high/low/close prices on the chart.
█ OVERVIEW
This library is intended for Pine Coders who are authors of scripts that display numbers onto a user's charts. T

LogNormalLibrary "LogNormal"
A collection of functions used to model skewed distributions as log-normal.
Prices are commonly modeled using log-normal distributions (ie. Black-Scholes) because they exhibit multiplicative changes with long tails; skewed exponential growth and high variance. This approach i

Range Oscillator (Zeiierman)█ Overview
Range Oscillator (Zeiierman) is a dynamic market oscillator designed to visualize how far the price is trading relative to its equilibrium range. Instead of relying on traditional overbought/oversold thresholds, it uses adaptive range detection and heatmap coloring to reveal where pri

Volume Surprise [LuxAlgo]The Volume Surprise tool displays the trading volume alongside the expected volume at that time, allowing users to spot unexpected trading activity on the chart easily.
The tool includes an extrapolation of the estimated volume for future periods, allowing forecasting future trading activity.
🔶 U

Smooth Theil-SenI wanted to build a Theil-Sen estimator that could run on more than one bar and produce smoother output than the standard implementation. Theil-Sen regression is a non-parametric method that calculates the median slope between all pairs of points in your dataset, which makes it extremely robust to o

Fair Value Gaps by DGTFair Value Gaps
A refined, multi-timeframe Fair Value Gap (FVG) detection tool that brings institutional imbalance zones to life directly on your chart.
Designed for precision, it visualizes how price delivers into inefficiencies across chart, higher, and lower (intrabar) timeframes — offering a fl

TASC 2025.11 The Points and Line Chart█ OVERVIEW
This script implements the Points and Line Chart described by Mohamed Ashraf Mahfouz and Mohamed Meregy in the November 2025 edition of the TASC Traders' Tips , "Efficient Display of Irregular Time Series”. This novel chart type interprets regular time series chart data to create an ir

Simplified Percentile ClusteringSimplified Percentile Clustering (SPC) is a clustering system for trend regime analysis.
Instead of relying on heavy iterative algorithms such as k-means, SPC takes a deterministic approach: it uses percentiles and running averages to form cluster centers directly from the data, producing smoo

Adaptive Volume Delta Map---
📊 Adaptive Volume Delta Map (AVDM)
What is Adaptive Volume Delta Map (AVDM)?
The Adaptive Volume Delta Map (AVDM) is a smart, multi-timeframe indicator that visualizes buy and sell volume imbalances directly on the chart.
It adapts automatically to the best available data resolution

See all indicators and strategies
Community trends
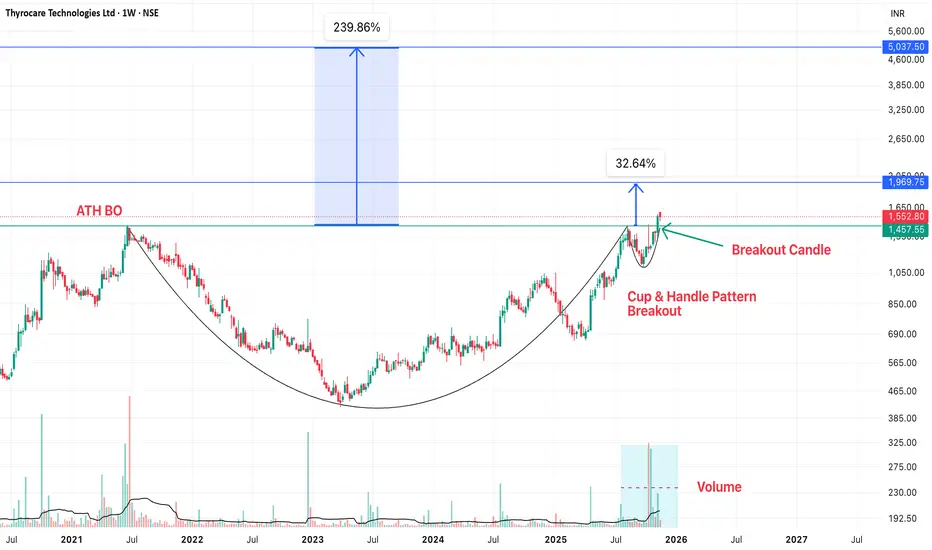
Thyrocare - Cup & Handle Breakout on Weekly Time FrameThyrocare has given a Cup & Handle Breakout on weekly time frame. Factors which will lead to 40%-200% return:
1. Cup & Handle breakout pattern
2. ATH Breakout
3. Volumes has picked up at Breakout
4. Fundamentally, super results in Q2 and best sales ever
Stock looks super fundamentally and technica
Narayana Hrudayalaya (D): Earnings-Driven BreakoutThe stock has decisively broken out of a 3-month consolidation phase. This technical breakout is powered by a strong fundamental catalyst (Q2 earnings), validating the surge and the high volume.
🚀 1. The Fundamental Catalyst (The "Why")
The breakout is a direct reaction to the company's Q2 FY26
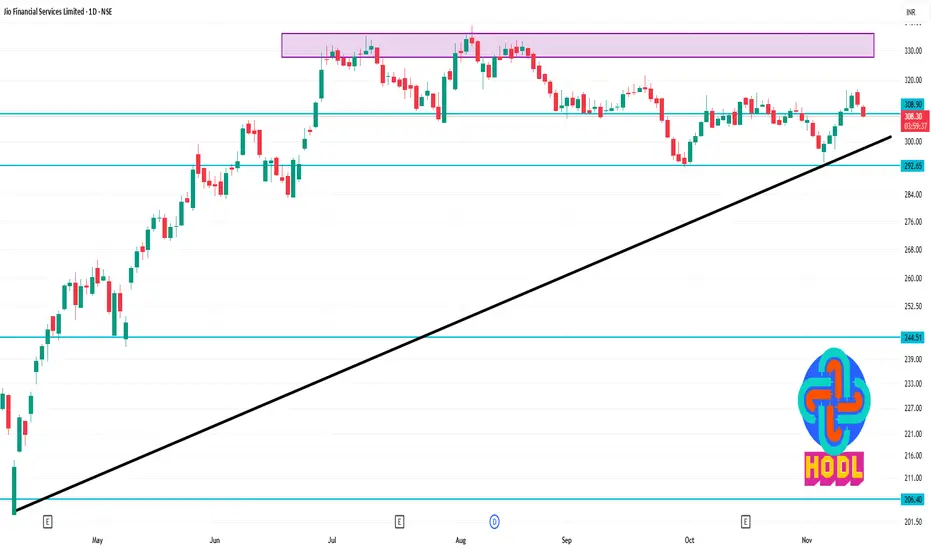
Jio Financial – Breakout Base Forming | Momentum Rebuilding
Structure
Price forming a clean ascending triangle with horizontal resistance near ₹285–289.
Higher lows forming consistently → accumulation behaviour visible.
Trend & Momentum
Trading above 21 EMA and 200 EMA, trend supportive.
RSI holding above 55, bull-range intact.
MACD flattening & att
BUY TODAY SELL TOMORROW for 5%DON’T HAVE TIME TO MANAGE YOUR TRADES?
- Take BTST trades at 3:25 pm every day
- Try to exit by taking 4-7% profit of each trade
- SL can also be maintained as closing below the low of the breakout candle
Now, why do I prefer BTST over swing trades? The primary reason is that I have observed that

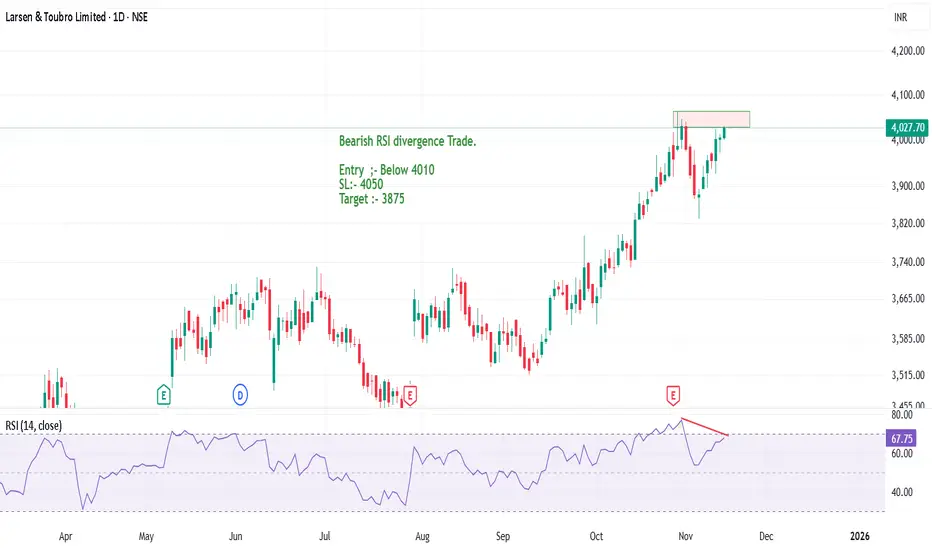
L&T forming a new high or Double Top pattern?Larsen & Toubro is showing a strong bearish RSI divergence on the daily charts. There can be an opportunity to sell the stock in coming trading sessions.
The stock has performed fabulously and good returns has been yeilded by the stock.
If there is a bearish price action, a double top pattern conf
Technical View: Engineers India Ltd (EIL)Pattern Formation
The stock is moving inside a sideways accumulation range between ₹188–₹200.
Multiple swing highs formed in the ₹212–₹220 region created a liquidity pool.
Price repeatedly wicked above these highs, indicating Buy-Side Liquidity Hunt.
Breakout Behaviour
A strong bullish
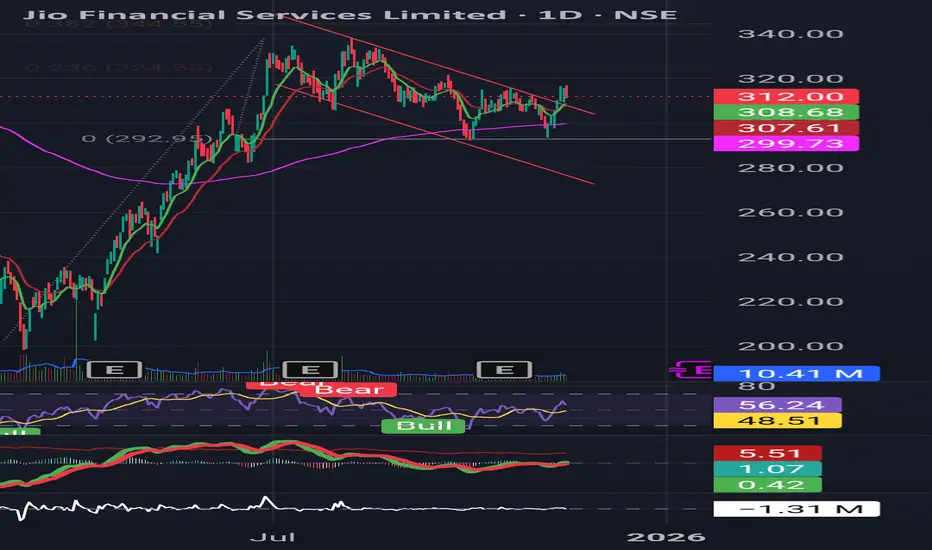
JIOFIN 1 Day Time Frame 📊 Key Daily Levels (1-Day Timeframe)
1. Support Levels
~ ₹309.8 — identified by Research360 as a support.
~ ₹307.6 — second support per Research360.
~ ₹304.1 — a lower support per pivot-point analysis.
Broader support zone (per some analysts) lies around ₹305–325, but for day trading, the
Mastering Breakouts, Patterns, Fair Value Gaps and Risk RatiosLearn how to spot breakout patterns, leverage fair value gaps, and enter trades with smart risk management for consistent swing trading success
Charts used are older than 3 months

ADANIENT - Eying 2700 on this corrective rise?
TF: Daily
CMP: 2462
From the lows at 1964, The swings are overlapping, making it a corrective move/structure overall.
This leg appears to be the Y wave up in the corrective WXY rise and could potentially reach 2700-2750 levels. Just so you know/observe, The zone also happens to be the confluence

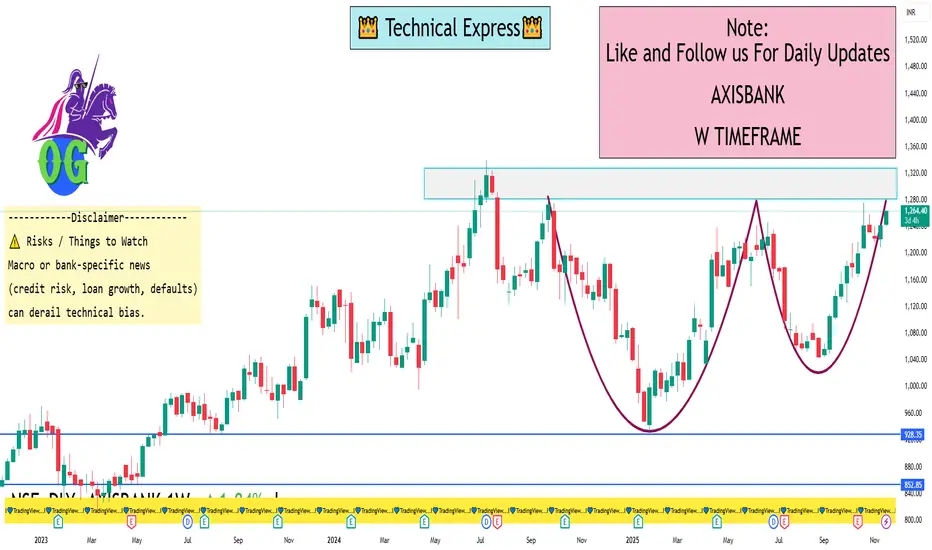
AXISBANK 1 Week View 📌 Key Levels & Data
Latest price roughly ₹1,250-₹1,260 per share.
52-week high ~ ₹1,276.10.
52-week low ~ ₹933.50.
Weekly (20-period) moving average ~ ₹1,143.27.
Weekly Bollinger Bands: Upper band ~ ₹1,285.22, Lower band ~ ₹1,001.32.
Weekly Pivot levels (Classic):
Pivot ~ ₹1,232.33
R1 ~
See all stocks ideas
No scheduled reports
Community trends
BTC at strong support levelBTC seems to have completed wave E of an expanding triangle.
-- EXPANDING TRIANGLE--
Wave E is generally equal to (101-161.8)% of Wave C.
In rare cases it could also be equal to 261.8% of Wave A or Wave C
---------------------------------
Wave E is already equal to twice of wave C and if it sust

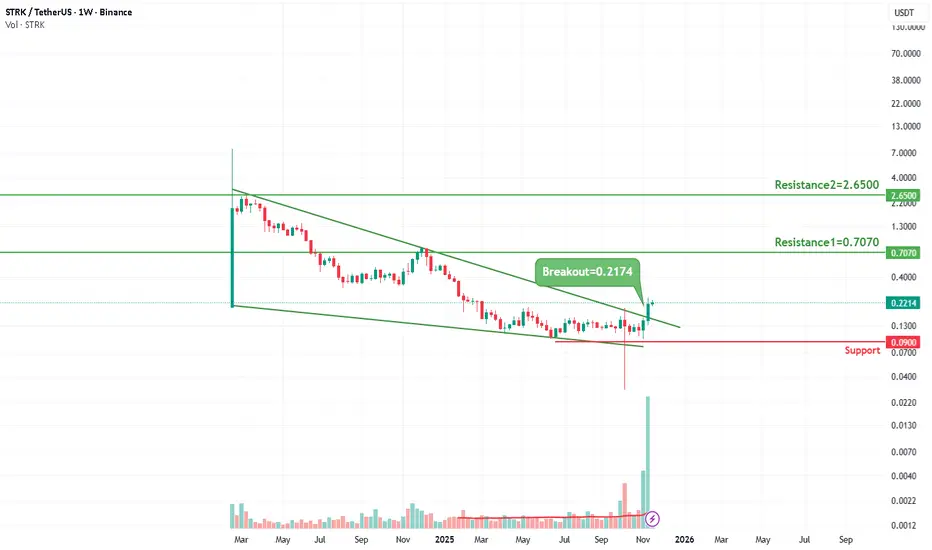
STRKUSDT - Breakout SetupBINANCE:STRKUSDT
Charts are self-explanatory. Levels of breakout, possible up-moves (where stock may find resistances) and support (close below which, setup will be invalidated) are clearly defined.
1. What Is STRK / Strike
- Strike is a decentralized lending / money-market protocol on Ethereum
CRYPTO MARKET JUST LOST $1.25 TRILLION🚨 CRYPTO MARKET JUST LOST $1.25 TRILLION: THIS IS NOT NORMAL 🚨
In just 42 days since the Oct 6 top, the market has wiped out a massive -$1.25T, A -28% collapse from the $4.27T peak → $3T zone.
This $3T level is the final line before a full liquidity vacuum.
If it breaks, volatility turns violent.


Technical Analysis of BTCUSD – Is a Correction Approaching?BINANCE:BTCUSD is currently moving within a clearly defined falling wedge pattern, with price now pressing against the lower boundary of the structure. This level may act as dynamic support, and if price shows a strong rejection, a corrective move toward the resistance zone near 102,000 could occu

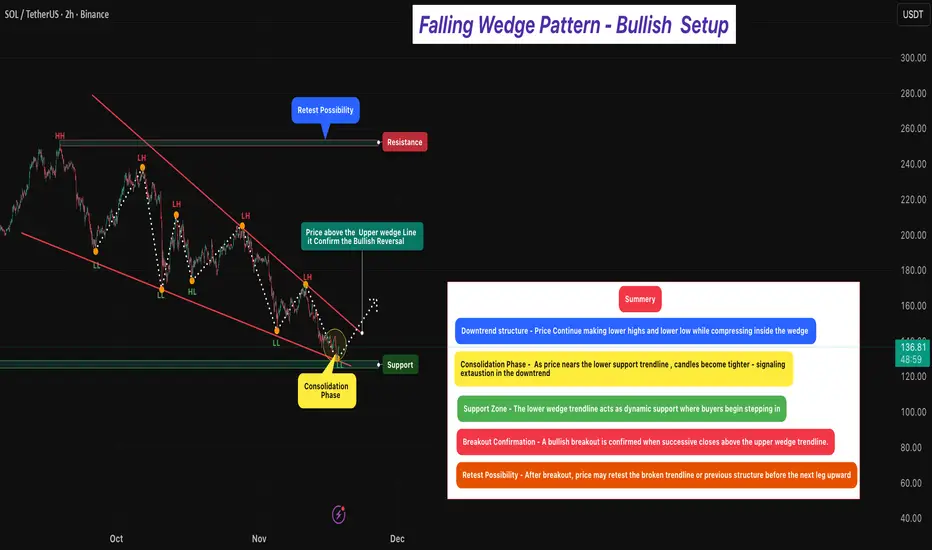
Falling Wedge Pattern - Bullish Setup 🔎 Overview [ /b]
The Falling Wedge Pattern is a bullish reversal setup that forms when price trades inside a narrowing downward channel — creating lower highs and lower lows that converge toward the bottom.
It typically appears after a downtrend, signaling that selling pressure is weakening and
BITCOIN looking for some pull backIt appears A,B,C, major correction is done.
However some concerns.
C wave is not touched the lower line of the channel.
and minor waves indicating still 5 th wave of C wave is pending
immediate target of Bitcoin 94700 tom94900
like this post if it helps ypu.
follow me to get up dates

BTCUSDBTC USD
* I want BTCUSD in 92000 range
* i need displacement
* i need good RR
* I need my setup
* Rest no trade

BTC/USD: Sell Pressure Building AgainBTC/USD: Sell Pressure Building Again
Market Summary
BTC/USD continues to operate within a declining market environment where sell-side pressure remains dominant. The recent recovery attempt has shown limited strength, forming only a temporary corrective phase within a broader downward cycle. Curr

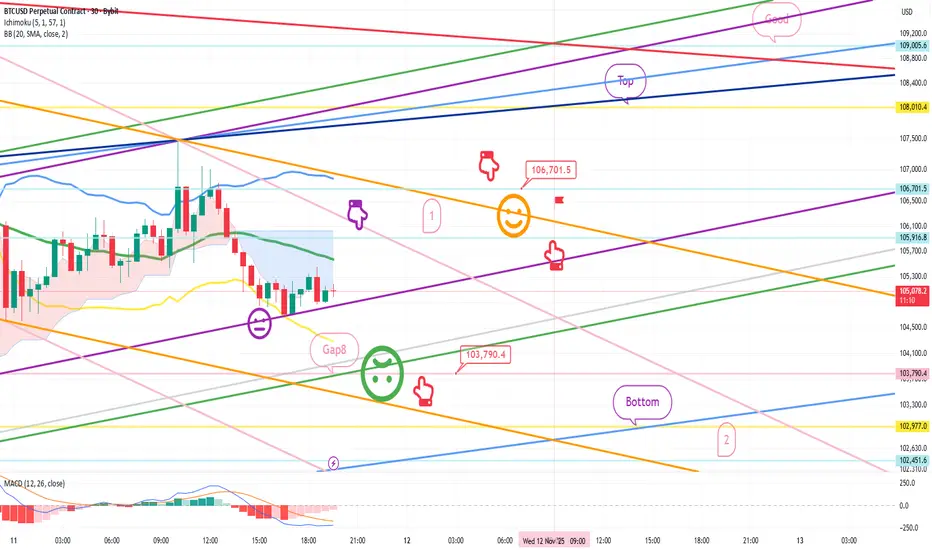
Bitcoin Bybit chart analysis November 11Hello
It's a Bitcoin Guide.
If you "follow"
You can receive real-time movement paths and comment notifications on major sections.
If my analysis was helpful,
Please click the booster button at the bottom.
This is a Bitcoin 30-minute chart.
There are no separate Nasdaq indicators.
I developed a
See all crypto ideas
OVERVIEW FOR TODAY - CHART H1 OVERVIEW
Price is currently sitting inside the POC zone – the area with the highest traded volume → the market usually consolidates here before choosing a direction.
Prior trend: Strong uptrend → distribution → correction.
The ascending trendline has been broken → short-term trend is bearish (downt

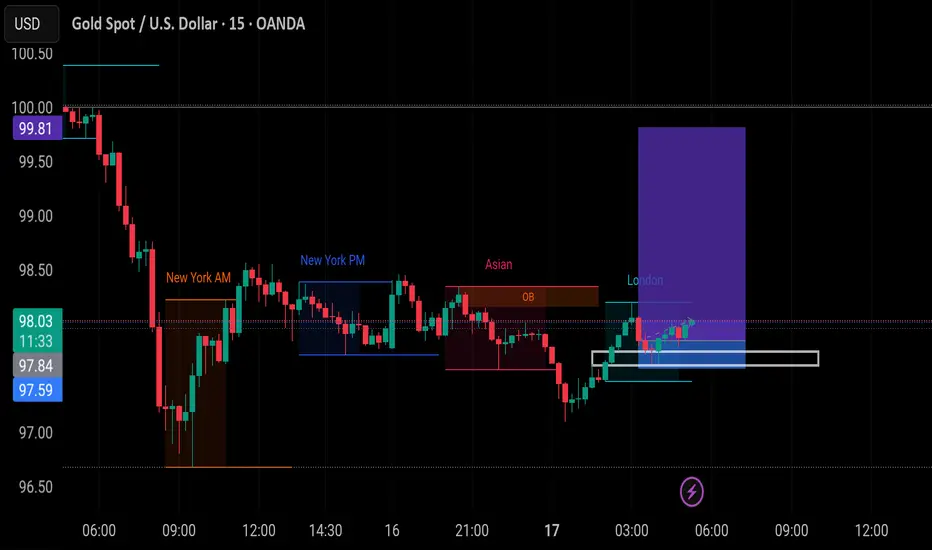
Bullish sentiments on goldWe're in an uptrend so today we're trading from an h1 fvg targeting the opposite external liquidity....since London session we expect to see a continuation to the target.
Gold Analysis & Trading Strategy | November 17-18✅ From the 4-hour chart, after gold topped at 4245, the price continued to break downward and is still trading below all short-term moving averages (MA5 / MA10 / MA20). This indicates that the larger-cycle bearish trend remains intact.
MA5 < MA10 < MA20 — the bearish alignment is clear, and every re

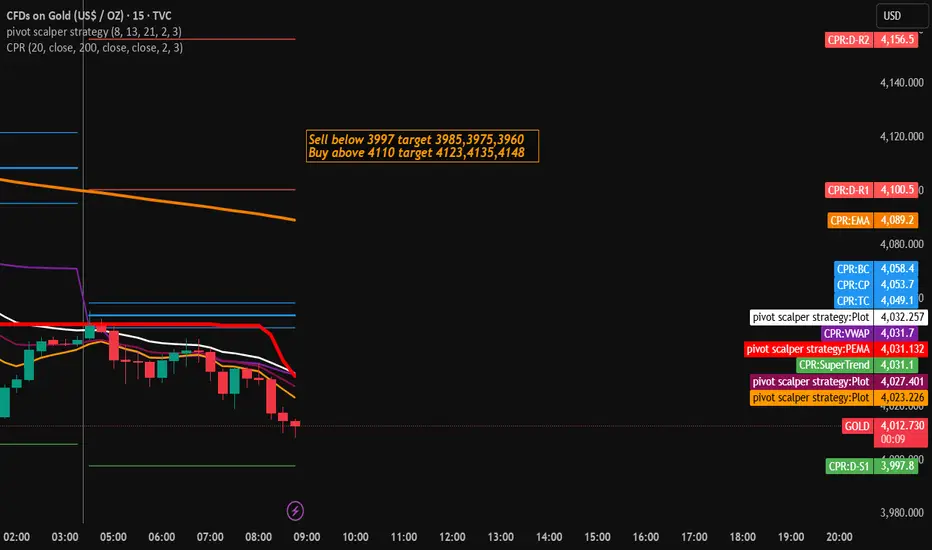
Gold Trading Strategy for 18th November 2025✨ XAUUSD (Gold) Intraday Trade Setup ✨
(Price levels based on your strategy plan)
🔻 SELL Setup (Below 5-min Candle Low)
📉 Sell Below: $3,997 (only if a 5-minute candle closes below this level)
🎯 Targets:
TP1: $3,985
TP2: $3,975
TP3: $3,960
🛡️ Suggested Stop-Loss: Above the breakdown candle h
XAUUSD MULTI TIMEFRAME ANALYSIS Hello traders , here is the full multi time frame analysis for this pair, let me know in the comment section below if you have any questions , the entry will be taken only if all rules of the strategies will be satisfied. wait for more price action to develop before taking any position. I suggest yo

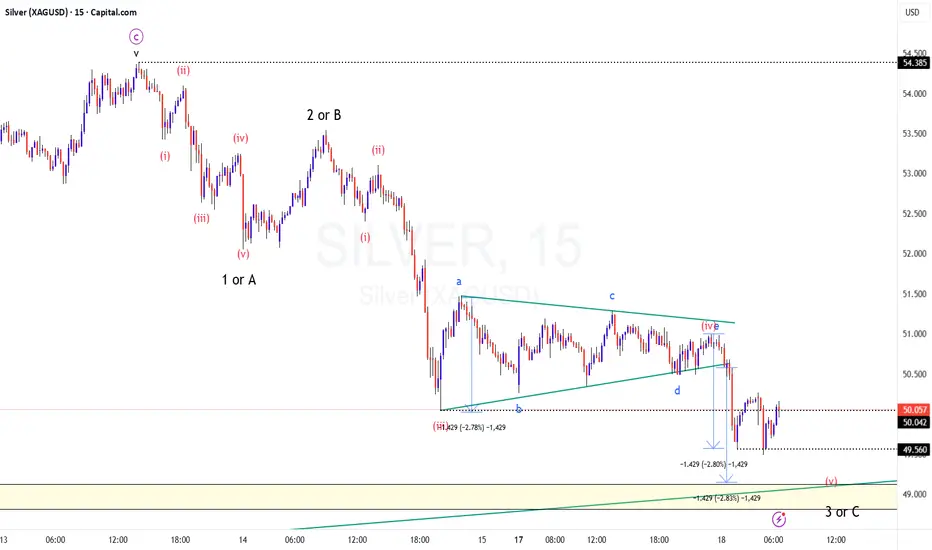
Time to TRIM your shorts in SILVER / XAGUSD?
TF: 15 Minutes
CMP: 49.941
The structure and counts suggests that we are in for a bounce on this counter anytime soon.
I have marked the internal counts of this fall from the recent swing high (54.385)
Whether it is an ABC decline or an impulse 5 wave decline, we are in for a bounce in the short
XAUUSD Double Bull Flag — Danger AheadHello my dear traders, Laura here.
This week, the market has been extremely tense, and the price action reflects it well.
As I mentioned before, we are currently seeing the formation of a large bull flag. Just above it, a smaller flag is developing, and this smaller structure is the key trigger for

Pressured Below 4050$ as Bears Target the 4,000$ Liquidity BreakGold continues to trade under heavy selling pressure, staying capped beneath 4,050$ and hovering just above the major liquidity floor at 4,000$.
With fading expectations for a December Fed cut and cautious global sentiment, buyers remain defensive while sellers maintain structural control.
📊 Techni

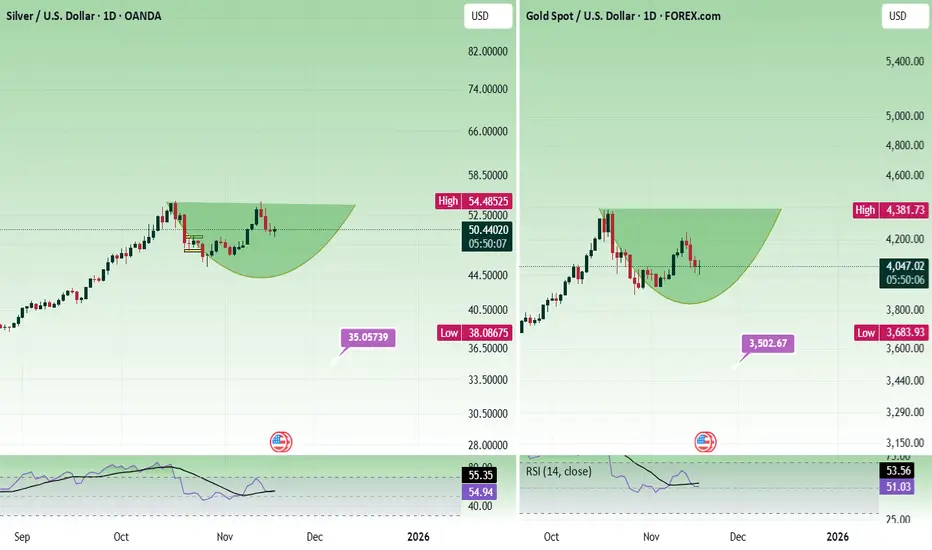
Trader's Queries - Gold & Silver - A reviewI rarely publish ideas about gold, and this is the first time I am writing about silver. This is not about where to buy or sell. Idea is about the structure of the price action.
Both gold and silver is forming a rounding bottom pattern. If it gives a breakout right away, then sustaining above these
XAUUSDTrading is easy, but trading with convection is only possible after you have 5-6 years of experience trading in every market.
It is this experience that can tell you how high the market can go, if you are tracking the stock correctly, and only then can you estimate how much profit booking can happen

See all futures ideas
USD/JPY – Weekly SMC Plan1. Weekly Bias
USD/JPY is showing signs of losing bullish momentum as multiple BMS (Break of Market Structure) events appear near the highs. The market keeps generating liquidity grabs, indicating potential distribution.
➡️ Weekly expectation: Bearish bias – priority is Sell from Premium zones.
2

GBPUSD MULTI TIMEFRAME ANALYSIS Hello traders , here is the full multi time frame analysis for this pair, let me know in the comment section below if you have any questions , the entry will be taken only if all rules of the strategies will be satisfied. wait for more price action to develop before taking any position. I suggest yo

AUD NZDTechnically, the AUD/NZD has shown a strong bullish trend, forming higher highs and higher lows, with recent price action bouncing from key support levels and an established ascending trendline, suggesting buyers remain in control. While short-term overbought conditions may suggest a minor pullback

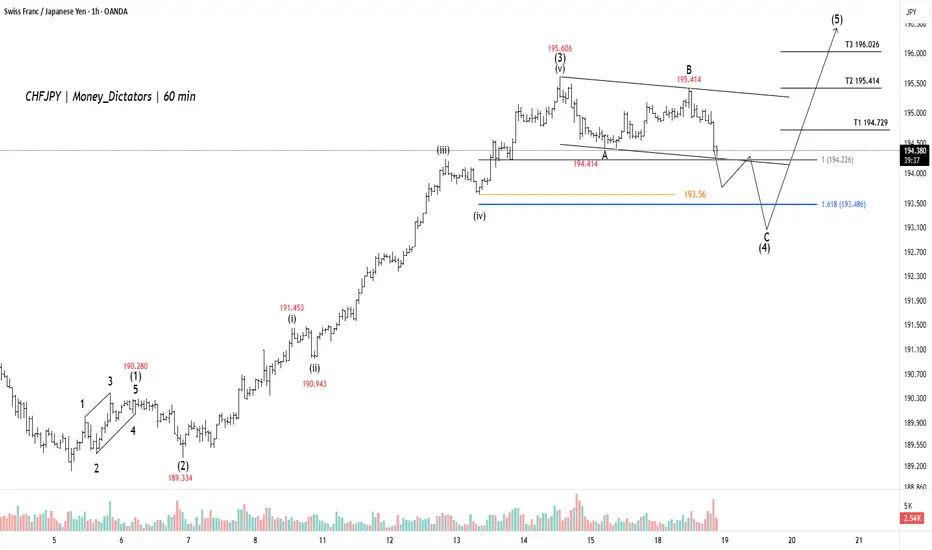
CHFJPY Is Escaping from Bulls, but...CHFJPY is currently completing a corrective pattern, labeled as wave (4).The price is expected to retest and potentially find support around the 193.56 level, or the 1.618 Fibonacci extension near 193.486.Once this correction is complete, the pair is projected to start the final impulse wave (5).The
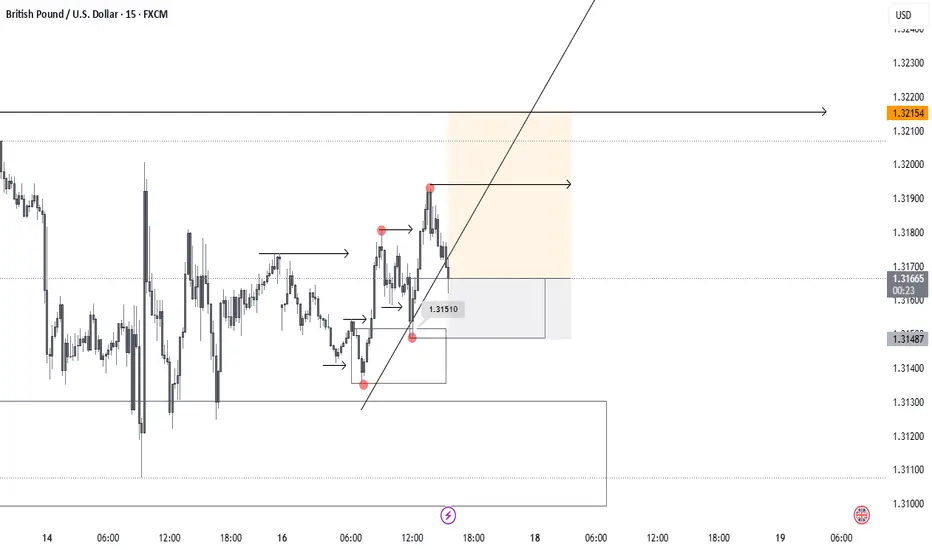
GU Intraday setup on GU
Going with the structure and bullish orderflow.
First target 4H high and will look to take some partials on 15min most recent high.
Zero DD Entry - Geometrical Analysis Self-similarity is a property where an object is partly or entirely similar to itself when viewed at different scales. This means that if you zoom in on a part of the object, it looks like the whole object, and this pattern can repeat infinitely for mathematical fractals. Many natural phenomena, suc
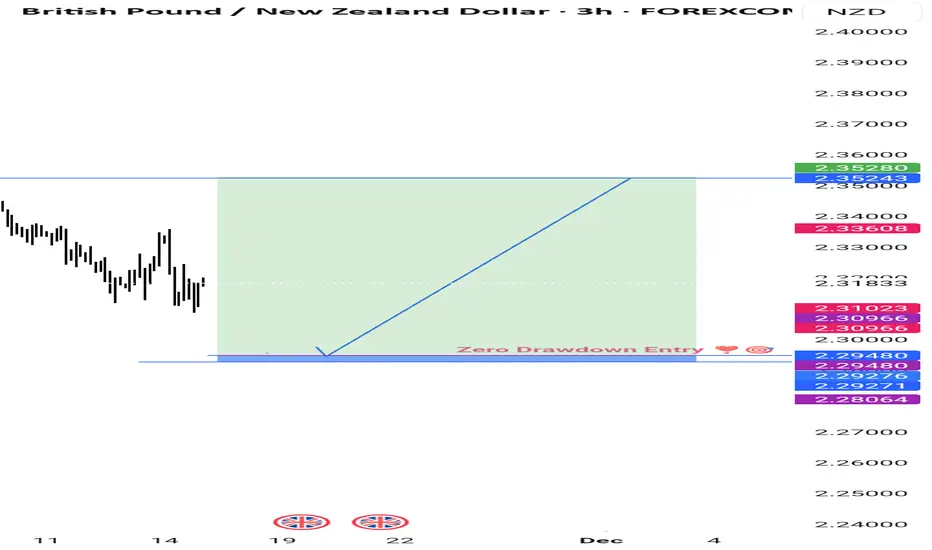
GBPNZD_Short Idea Elliot WaveI anticipate GBPNZD to decline below 2.3090, with a strict stop-loss set at 2.3450. Please conduct your own research before considering this trade.


GBP/USD something big is cooking. keep eye no gbp/usd. it is consolidating since a long time. a big move can come anytime in either side, wait for price action confirmation.

Usdchf bearish sell
💧USD/CHF – Bearish Bias News Summary
📍SNB cut rates to 0%, signaling more easing ahead → CHF stays fundamentally strong.
📍UBS forecasts USD/CHF lower, expecting continued franc strength.
📍Weak U.S. data increases Fed cut expectations → pressure on USD.
📍Swiss sentiment weak, but SNB still ready

See all forex ideas
| - | - | - | - | - | - | - | - | ||
| - | - | - | - | - | - | - | - | ||
| - | - | - | - | - | - | - | - | ||
| - | - | - | - | - | - | - | - | ||
| - | - | - | - | - | - | - | - | ||
| - | - | - | - | - | - | - | - | ||
| - | - | - | - | - | - | - | - | ||
| - | - | - | - | - | - | - | - | ||
| - | - | - | - | - | - | - | - |
Trade directly on the supercharts through our supported, fully-verified and user-reviewed brokers.


