BTC | 8H Technical Structure UpdateBTC | 8H Technical Structure Update
Price Is Printing A Clear Ascending Triangle With Consistent Higher Lows Pressing Into A Well-Defined Horizontal Supply Zone At $94,500
Key Technical Levels:
🔹 Range High / Supply: $94,500 → $107,000
🔹 Ascending Trendline (Dynamic Demand): ~$88,000
🔹 HTF Demand

The best trades require research, then commitment.
Get started for free$0 forever, no credit card needed

Scott "Kidd" PoteetThe unlikely astronaut

Where the world does markets
Join 100 million traders and investors taking the future into their own hands.

NIFTY 50 – Close Below 50 EMA & SMA | Downside Levels IdentifiedTechnical View:
Over the last two years, NIFTY has consistently shown that a daily close below both the 50 EMA and 50 SMA results in an average correction of 4–5%.
🔍 Current Structure:
Price has closed below 50 EMA & 50 SMA
Rising wedge structure near the top → breakdown risk
Weak follow-throug

Short term Analysis of RelianceWrap up:-
Reliance is making a wxy pattern in wave c and has completed its wave w at 1581 and wave x is expected to be completed near 1450. Thereafter, Reliance will head towards wave y.
What I’m Watching for 🔍
Buy Reliance in the range of 1460-1480 sl 1440 for a target of 1578-1687.
Disclaime

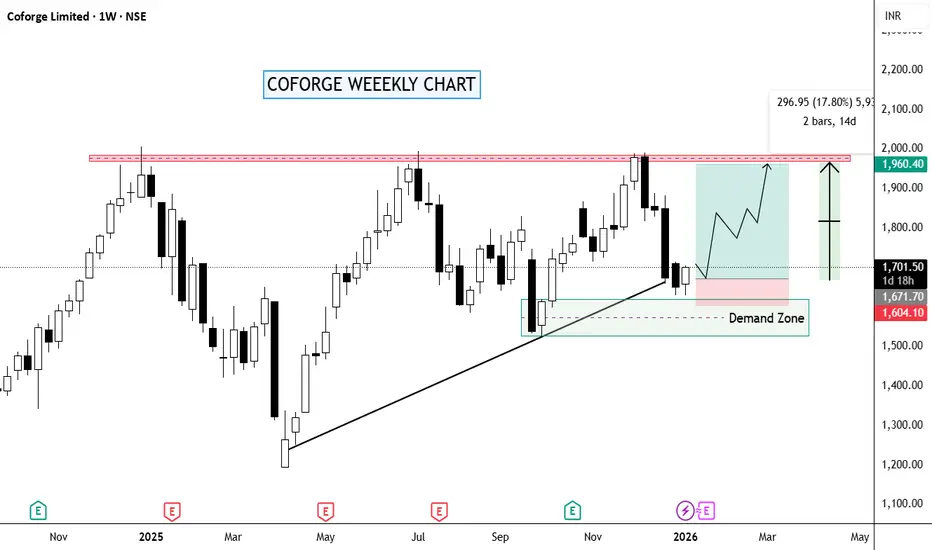
COFORGE – Weekly Chart | Clean Technical ViewNSE:COFORGE
🔹 Trendline + 50 EMA Support:
Price has pulled back into a rising weekly trendline, and the 50 EMA is sitting right there. This confluence is the key zone.
🔹 Price Action:
Rejection from 1950–2000 came with a controlled pullback, not panic selling. That tells me distribution isn’
SRF LTD: Price Compression at Key Resistance|Clean Breakout Play📌 Structure: Daily Timeframe
SRF has been consolidating inside a clean descending channel, printing lower highs while demand holds near the channel base.
Price is now pressing against well-tested channel resistance — a clear decision zone.
🔴 Key Reads
Descending resistance respected multiple times

VINCOFE history repeat? One more breakoutVINCOFE looks to be ready to form one more round of steps.. candle stick patter from 3 days are very tight to form a flag pattern and previous week green candle support should lift the stock above the trend line.

NAUKRI – Tight Range, Clear Structure, Price Under CompressionPrice has been moving inside a well-defined converging range, with lower highs pressing from the top and higher lows holding from the bottom.
Each rejection from the upper line and each response from the lower line shows that both buyers and sellers are active, but volatility is gradually compressin

SAIL - Weekly - LongThis is a weekly chart of the SAIL, so it is useful for positional or swing trading.
First, let’s understand the trend based on the markings.
Earlier on the left side, the stock was making lower highs and lower lows, which clearly shows a downtrend. This phase is marked with “lower low” arrows. Aft

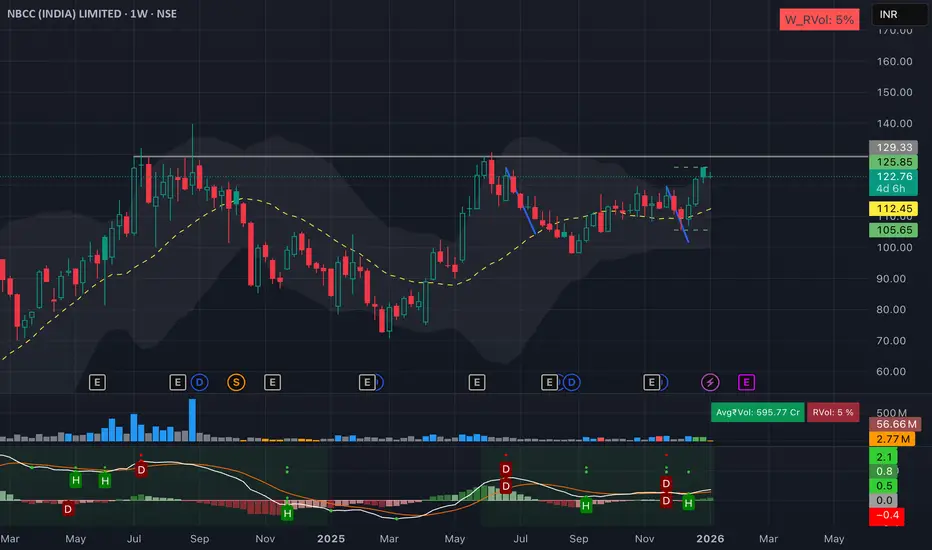
NBCC (India) Ltd | Weekly Consolidation Breakout SetupNBCC is showing a constructive weekly structure after a healthy pullback.
Price is holding above key moving averages
Higher lows indicate trend continuation
Tight consolidation near resistance suggests accumulation
Setup favors a range breakout on strength
Trade View:
Buy on strength above ₹125
Su
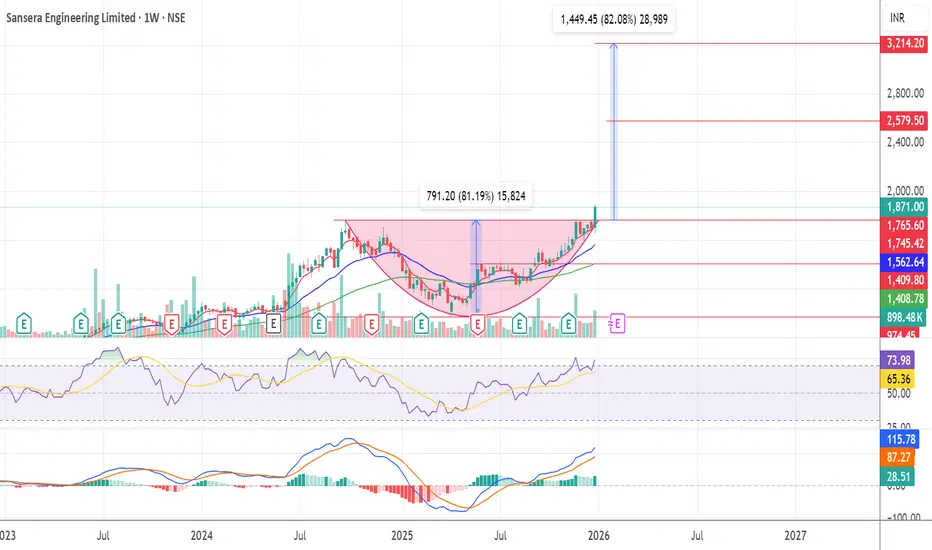
SANSERA ENGG@1871Not a SEBI registered, just sharing idea. On weekly time frame SANSERA @1871 gave breakout from rounding bottom @1767 with volume. Entry can be made 1871 and @1767, SL-1700 Target 1-2600 in 2-3 month, 2-3300 in 5-6 month. It is in Bull trend RSI on DAILY, WEEKLY >70 and MONTHLY>=70.
See all editors' picks ideas
Arbitrage Detector [LuxAlgo]The Arbitrage Detector unveils hidden spreads in the crypto and forex markets. It compares the same asset on the main crypto exchanges and forex brokers and displays both prices and volumes on a dashboard, as well as the maximum spread detected on a histogram divided by four user-selected percenti

Multi-Distribution Volume Profile (Zeiierman)█ Overview
Multi-Distribution Volume Profile (Zeiierman) is a flexible, structure-first volume profile tool that lets you reshape how volume is distributed across price, from classic uniform profiles to advanced statistical curves like Gaussian, Lognormal, Student-t, and more.
Instead of forcin

Multi-Ticker Anchored CandlesMulti-Ticker Anchored Candles (MTAC) is a simple tool for overlaying up to 3 tickers onto the same chart. This is achieved by interpreting each symbol's OHLC data as percentages, then plotting their candle points relative to the main chart's open. This allows for a simple comparison of tickers to tr

Vdubus Divergence Wave Pattern Generator V1The Vdubus Divergence Wave Theory
10 years in the making & now finally thanks to AI I have attempted to put my Trading strategy & logic into a visual representation of how I analyse and project market using Core price action & MacD. Enjoy :)
A Proprietary Structural & Momentum Confluence System

Per Bak Self-Organized CriticalityTL;DR: This indicator measures market fragility. It measures the system's vulnerability to cascade failures and phase transitions. I've added four independent stress vectors: tail risk, volatility regime, credit stress, and positioning extremes. This allows us to quantify how susceptible markets are

Volatility Risk PremiumTHE INSURANCE PREMIUM OF THE STOCK MARKET
Every day, millions of investors face a fundamental question that has puzzled economists for decades: how much should protection against market crashes cost? The answer lies in a phenomenon called the Volatility Risk Premium, and understanding it may fundam

Volume Gaps & Imbalances (Zeiierman)█ Overview
Volume Gaps & Imbalances (Zeiierman) is an advanced market-structure and order-flow visualizer that maps where the market traded, where it did not, and how buyer-vs-seller pressure accumulated across the entire price range.
The core of the indicator is a price-by-price volume prof

Match Finder [theUltimator5]Match Finder is the dating app of indicators. It takes your current ticker and finds the most compatible match over a recent time period. The match may not be Mr. right, but it is Mr. right now. It doesn't forecast future connection, but it tells you current compatibility for today.
Jokes aside,

Trend Line Methods (TLM)Trend Line Methods (TLM)
Overview
Trend Line Methods (TLM) is a visual study designed to help traders explore trend structure using two complementary, auto-drawn trend channels. The script focuses on how price interacts with rising or falling boundaries over time. It does not generate trade sign

Breakouts & Pullbacks [Trendoscope®]🎲 Breakouts & Pullbacks - All-Time High Breakout Analyzer
Probability-Based Post-Breakout Behavior Statistics | Real-Time Pullback & Runup Tracker
A professional-grade Pine Script v6 indicator designed specifically for analyzing the historical and real-time behavior of price after strong All-Ti

See all indicators and strategies
Community trends
What exactly you have to do when the Markets are REDI make educational content videos for swing trading basis
Charts used are older than 3 months in this video

National Aluminium Company Limited - Breakout Setup, Move is ON.#NATIONALUM trading above Resistance of 331
Next Resistance is at 443
Support is at 228
Here are previous charts:
Chart is self explanatory. Levels of breakout, possible up-moves (where stock may find resistances) and support (close below which, setup will be invalidated) are clearly d

How much Contraction is Enough? Naukri Support Buy NSE:NAUKRI
Many participants are Getting frustrated of this range'cause you see they are not able to make any money if they're holding this stock.
Day by day the contraction in this range is getting narrower, and every time It moves down to the support area, the range low it forms a very bullish

Short term Analysis of RelianceWrap up:-
Reliance is making a wxy pattern in wave c and has completed its wave w at 1581 and wave x is expected to be completed near 1450. Thereafter, Reliance will head towards wave y.
What I’m Watching for 🔍
Buy Reliance in the range of 1460-1480 sl 1440 for a target of 1578-1687.
Disclaime
PAGEIND: Monthly M Pattern+Lower High+RSI Divergence=BEARISHPAGEIND on Monthly Chart showing multiple bearish signals:
1. M Pattern Formation
- Classic double top (M) structure developing
- Failed to sustain above previous highs
2. First Lower High Confirmed
- Recent peak lower than prior monthly high
- Momentum weakening significantly
3. RSI Multiple D

Polycab Cmp 7750 Bearish Engulfing @ TopPolycab Cmp 7750 dated 8-1-2025
1. Bearish Engulfing Candle @ Top
2. RSI Divergence (downside)
Sell below 7720 SL 7950 target 7700-7675-7650-7625-7600-7580-7560-7540-7525-7500
7475-7450
It is just a view, please trade at your own risk.

SOLARINDS - STWP Equity Snapshot📊 STWP Equity Snapshot – SOLARINDS
(Educational | Chart-Based Interpretation)
Solar Industries India Ltd
________________________________________
📌 Intraday Reference Levels (Structure-based | Observational)
Reference Price Zone: 13,739
Risk Reference (Structure Invalidation): 13,089
Observed Upside

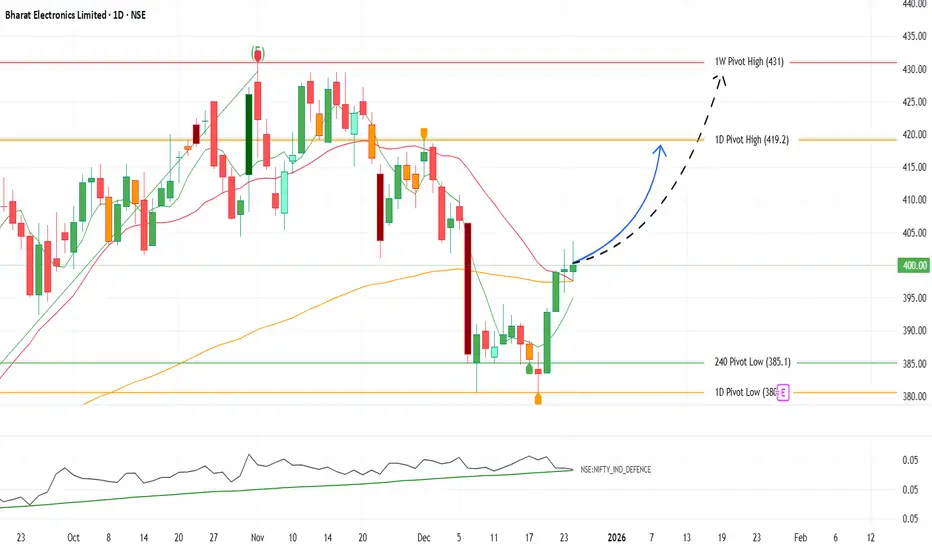
BEL – Setting Up for a 5% Move-Swing TradeBEL – Setting Up for a 5% Upside Move 🚀
BEL has taken strong support near ₹385–388 and is now reclaiming key moving averages with improving momentum. With the upcoming Union Budget expected to favor Defence spending, sentiment & flows remain supportive.
📌 Trade View
CMP: ~₹400
Targets: ₹420 (
JUNIPER HOTELS Ltd LongThe Elliott Wave Theory's description of the structure and pattern of price movements in financial markets is known as the Elliott Wave Structure.
The Elliott Wave analysis indicates that the stock has completed corrected waves 1,2,3,4 and 5, which are shown as red numbers on the daily chart.
Bul

ITC - WyckoffITC – Weekly Wyckoff Distribution (Schematic #2) in Play
ITC’s weekly structure appears to be unfolding as a Wyckoff Distribution – Schematic #2, suggesting a transition from demand dominance to supply control.
Key observations from the chart :
Preliminary Supply (PSY) marked the first sign of

See all stocks ideas
Today
DMARTAvenue Supermarts Ltd.
Actual
—
Estimate
11.88
INR
Jan 12
TCSTata Consultancy Services Limited
Actual
—
Estimate
35.97
INR
Jan 12
PURETROPPuretrop Fruits Ltd
Actual
—
Estimate
—
Jan 12
GNAGNA Axles Ltd
Actual
—
Estimate
—
Jan 12
GTPLGTPL Hathway Ltd
Actual
—
Estimate
—
Jan 12
ANANDRATHIAnand Rathi Wealth Ltd.
Actual
—
Estimate
—
Jan 12
HCLTECHHCL Technologies Limited
Actual
—
Estimate
17.43
INR
Jan 13
MAHABANKBank of Maharashtra
Actual
—
Estimate
—
See more events
Community trends
BTC | 8H Technical Structure UpdateBTC | 8H Technical Structure Update
Price Is Printing A Clear Ascending Triangle With Consistent Higher Lows Pressing Into A Well-Defined Horizontal Supply Zone At $94,500
Key Technical Levels:
🔹 Range High / Supply: $94,500 → $107,000
🔹 Ascending Trendline (Dynamic Demand): ~$88,000
🔹 HTF Demand
Inverted Cup pattern Possible on BTCThe Inverted Cup and Handle is a bearish continuation pattern used in technical analysis. It is the mirror image of the classic "Cup and Handle" and signals that a stock or asset is likely to resume a downward trend after a brief period of consolidation.
Here is a breakdown of how to identify and t

buy bitcoin for short term swingEntry Price (BUY): 90,330
This level indicates bullish intent. Price holding above this zone suggests buyers are in control and momentum is shifting upward.
⸻
🔻 Stop Loss: 89,670
• Placed 660 points below entry
• This level protects capital if the market moves against the trade
• A breakdown b

BTCUSD 1H Trend Shift Highlights Key Support and Recovery ZoneBitcoin on the 1H timeframe shows a complete cycle of trend development and correction based on clean price action. The market initially respected a bullish structure, forming higher highs and higher lows along an ascending trendline. Strong buying pressure pushed price above previous resistance, co

BTCUSDT – Elliott Wave Completion → Short Sell SetupPrice action on BTCUSDT appears to be completing a 5-wave Elliott impulse structure inside a rising wedge / channel. Waves (1)–(5) are clearly respected, with Wave (5) now testing a major trendline resistance zone around 91,800–92,000.
Momentum indicators are showing loss of strength near the top,

Bitcoin Bybit chart analysis JENUARY 8Hello
It's a Bitcoin Guide.
If you "follow"
You can receive real-time movement paths and comment notifications on major sections.
If my analysis was helpful,
Please click the booster button at the bottom.
This is Bitcoin's 30-minute chart.
The Nasdaq indicator will be released shortly at 10:30

BTCUSD (4H) – Consolidation Below Key Volume Node After PullbackMarket Structure: On the 4H timeframe, BTCUSD shows a strong impulsive rally followed by a corrective pullback and current sideways consolidation. Price is holding above prior higher lows, so the medium-term structure remains bullish, but momentum has clearly cooled.
Price Action: After topping nea

BTC/USD 1 Month Time Frame 📊 Current Price Snapshot (Latest Available)
$90,478.00
📊 1‑Month Key Levels — BTC / USD
🛑 Resistance Levels (Upside)
These are areas where price has struggled to break above recently:
1. Major Resistance: ~$108,000–$112,000
• Multiple tests and sellers here — strong supply zone.
2. Intermediate R

Bitcoin Update (10-01-2025)BTC/USD 1H Quick Update (Jan 10, 2026) – 🇮🇳
Current price ~$90,546 (+0.10%). BTC remains in ultra-tight consolidation around $90k–$91k, with candles compressing hard (volatility squeeze classic).
Key levels:
- Support: $89,289–$90,000 (holding strong after multiple tests)
- Resistance: $91,6

#ETH Just a pullback before the run!DELTAIN:ETHUSD.P
Just a pullback before the big run. The trend is bullish until it hold this.
Are you in the game already?
I'll update if the momentum changes.

See all crypto ideas
GOLD SHOWING A GOOD UP MOVE WITH 1:8 RISK REWARD GOLD SHOWING A GOOD UP MOVE WITH 1:8 RISK REWARD
DUE TO THESE REASON
A. its following a rectangle pattern that stocked the market
which preventing the market to move any one direction now it trying to break the strong resistant lable
B. after the break of this rectangle it will boost the market p

NatGas LongCurrent Price: 3.557, immediate support and SL 3.498 , long with a target of 3.75, and trailing it to 3.9 4.091 and so on. For short positions enter after support 3 break and take support 2 as SL , tgt would be kept at 3.25.

XAUUSD Beginning Big Elliot Wave 3based on elliot waves counting on the daily timeframe we are currently in wave 2 pullback.
if we have seen the bottom of wave 2 already, the next wave is going to be the big impulse wave 3, with target marked on the chart below.
TLD: Long

“Bullish Pullback → Trendline Support Holding for Next Rally🔍 Key Technical Analysis
Price previously formed a strong bearish breakout, followed by a price rebound from a high pivot demand zone (POI) 🔄
Market has established a clear upward channel, confirming a medium-term bullish structure 📈
Break of Structure (BOS) to the upside signals a shift from bea

XAUUSD #LOVE1) what a move point to point connected down , respact itl2 and liquidity swipe in key level 2 uffffff #love #lovetrading
my experience only 2 months ( RESPACT TO GUARDEER )
my target is first 1000$ IN 2026

XAUUSD 1H Recovery Consolidation Near Key Support ZonesXAUUSD on the 1-hour chart is showing a clear recovery after a sharp bearish move. Price found strong demand around 4,300–4,320, forming higher lows and higher highs, signaling a short-term recovery structure. Currently, price is consolidating near 4,430–4,400, which acts as near-term support.
Key

gold spot or silver spot update belowsilver spot abv 80$ sustain than u will see new high today till closing 83-85$ in spot gold stya abv 4520 u will see boom-mm new high 4600$++++ in mcx given already and see the positional report given
yes eyes on these level and sustain can see heavy short covering .mcx gold above 139150 will see 13

XAUUSD (H3) – Liam StrategyTrendline break confirms the uptrend ✅ | Buy the discount, scalp-sell at ATH
Quick overview
On the H3 chart, the story is clean: price has broken the bearish trendline and held structure after a clear BOS, which keeps the bias bullish for continuation.
But the best execution is still the same: no

CRUDE FUTURE VIEWCRUDE POSSIBLE MOVE
Resistance 5275 , 5315
Support 5160 , 5090
view is for study purpose only , we are not recommend any trade or investment
Always do your own analysis

Gold Trading Strategy for 09th January 2026🟡 GOLD (XAUUSD) – 30 MIN BREAKOUT TRADE SETUP 💰
📊 Timeframe: 30 Minutes
⚠️ Trade only after candle CLOSE, not on wick movement.
🟢 BUY SETUP (Bullish Breakout) 🚀
✅ Buy Above: 4503
✅ Condition:
30-minute candle closes ABOVE 4503
🎯 Targets:
🎯 Target 1: 4514 💵
🎯 Target 2: 4525 💵💵
🎯 Target 3: 4540 💵💵💵
📌

See all futures ideas
Gbpjpy Projecting in sellside delivery till weekly imbExpecting GBPJPY short term sell delivery,pric rejected from monthly Order block after taking previous monthly highs, expecting liquidity to take till weekly imbalance, onwards based on confirmation bullish move probably expected (the fundamental idea promotes buy from weekly imb where as GBP intere

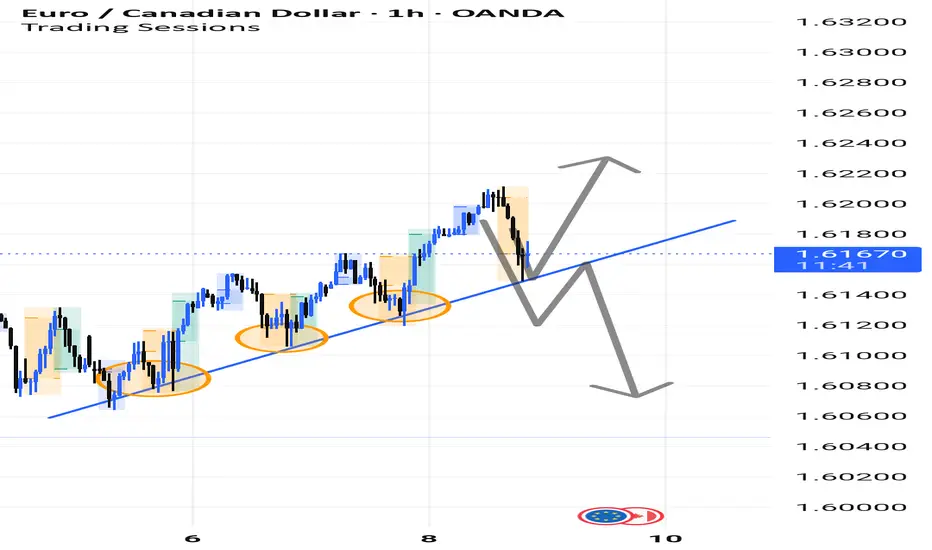
Market is following Trend line.As you can see EURCAD is following trend line if market break trend line we can sell and if give candelstick conformation in same direction we can take trade according to trend.
Plan your trade accordingly.
AUDUSD Buy Setup | Discount Zone Reaction + Trendline BreakBias: Bullish
Timeframe: 15M
Pair: AUDUSD
Market Structure & Context
AUDUSD has completed a corrective move within a descending channel after a strong impulsive rally. Price has now reached a higher-timeframe discount zone, aligning with a rising trendline support, where we see clear signs of sell

EUR/USD Complete PictureTechnically:
As per the Current Market Structure, EUR/USD looks weaker for an 1st Target of 1.15305 . Once Wave E is completed EUR/USD turns into buy side for an 2nd Target of 1.20300
Fundamentally: Change of Structure Possible on Jan23rd based on the data German and French Flash manufacturin

USDJPY MULTI TIMEFRAME ANALYSIS Hello traders , here is the full multi time frame analysis for this pair, let me know in the comment section below if you have any questions , the entry will be taken only if all rules of the strategies will be satisfied. wait for more price action to develop before taking any position. I suggest yo

EURUSD – 15M | Sell-Side Sweep → Demand Tap → Reversal PlayPrice just engineered a clean sell-side liquidity sweep into a well-defined HTF demand zone.
Downside expansion shows liquidity delivery, not continuation.
Context check:
Equal lows taken ✔️
Reaction from demand ✔️
No follow-through below value ✔️

USDJPY Sell TradePrice is currently in a downtrend on the 1Hour timeframe. Price retested the orderblock on the 15min Timeframe with was also between the 0.62 and 0.78 fibonacci level. Price is now rejecting the oredrblock and looking to continue to the down trend. We are targetting a 1:2 RR and Stoploss and takepro

EURUSD Analysis on (05 Jan 2026)#EURUSD UPDATEDE
Current price - 1.17144
If price stay above 1.16600 then next target 1.18000 and below that 1.16000

GBPJPY sell active setup GBPJPY as expected running check my previous idea 💡 I link to this, TP 🎯 missed still struggling possible TP let's see 📈📉

See all forex ideas
| - | - | - | - | - | - | - | - | ||
| - | - | - | - | - | - | - | - | ||
| - | - | - | - | - | - | - | - | ||
| - | - | - | - | - | - | - | - | ||
| - | - | - | - | - | - | - | - | ||
| - | - | - | - | - | - | - | - | ||
| - | - | - | - | - | - | - | - | ||
| - | - | - | - | - | - | - | - | ||
| - | - | - | - | - | - | - | - |
Trade directly on Supercharts through our supported, fully-verified, and user-reviewed brokers.


