Nifty50 and Overall Market analysisIn this video, we discuss Nifty50 and Overall Market analysis
Current market scenario
Long term vs Short term chart analysis
Major sector index analysis and my views on them
Long term vs Short term Investment approach

The best trades require research, then commitment.
Get started for free$0 forever, no credit card needed

Scott "Kidd" PoteetThe unlikely astronaut

Where the world does markets
Join 100 million traders and investors taking the future into their own hands.

Trading view, Mountains, Back testing strategy & New yearHappy new year to the Trading view Family, Wishing everyone a strong Year Ahead and in green .
Keep back testing and learning .

BPCL : Trading the Confluence of Price Action & Macro TailwindsThe stock has been consolidating within a defined range over the past few weeks and has recently started forming a solid base. While the breakout volume isn’t a classic “God-candle,” price action continues to hold firmly above key moving averages, which is a constructive sign. That said, the price i

GIFTNIFTY IntraSwing Levels For 02nd JAN 2026🚀Follow & Calculate Premium with NIFTY Post for NF Trading
💥Level Interpretation / description:
L#1: If the candle crossed & stays above the “Buy Gen”, it is treated / considered as Bullish bias.
L#2: Possibility / Probability of REVERSAL near RLB#1 & UBTgt
L#3: If the candle stays above “Sell

CONCOR – 1D | 10-Year Support & Trendline BreakoutCompany Intro:
Container Corporation of India Ltd (CONCOR) is a Navratna PSU and India’s largest integrated logistics company, operating inland container depots (ICDs), container freight stations (CFS), and rail-based logistics services. It plays a key role in India’s EXIM trade and domestic freight

LongKey Points About Your Breakout Strategy
Identify breakouts using recent pivot highs and lows.
Clear entry, stop-loss, and target levels from the indicator.
Trade only when price breaks support or resistance.
Targets set using risk-reward from recent highs/lows.
Capture momentum while managing risk

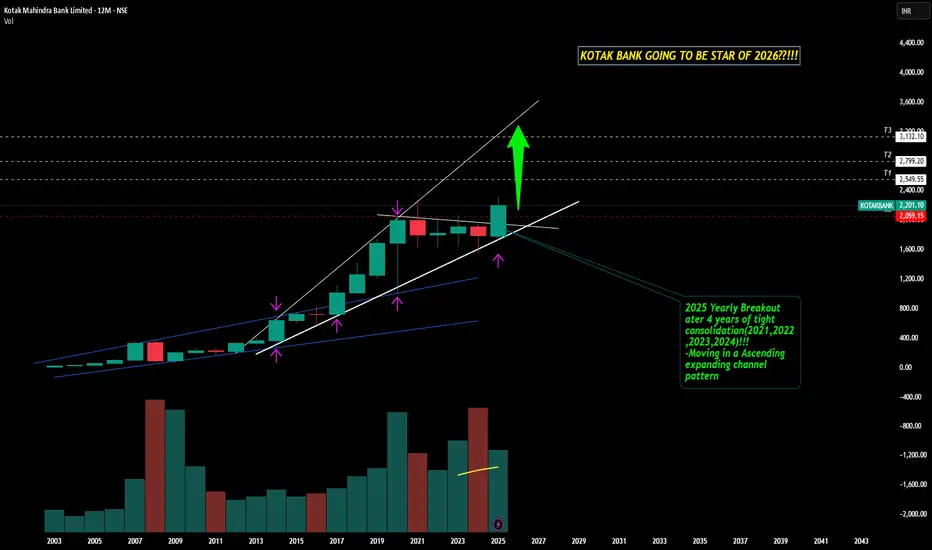
Kotak Mahindra Bank - Bulls Wish Happy 2026 Ahead!!!Kotak Mahindra Bank after 4 years of tight consolidation , has given a Beautiful 2025 Yearly Breakout!!!
It is trading inside a expanding ascending channel pattern from 2014 till now ....taking support and resistance at respective channel lines( shown below- 6month timeframe chart )
Chances ar
NIFTY Set to Sign Off 2025 Quietly—Could 2026 Bring a Rally?As we enter the last week of 2025 and approach the first week of 2026, Nifty is doing something familiar—consolidating in a tight range.
Everything looks calm at first glance: volatility is very low (India VIX at 9.15), trading volumes are light, and price changes are small. But history shows that

TATACONSUMStrong Breakout Candidates!
#TATACONSUM
1- Inverse head and shoulders pattern
2- Uptrend is Still Intact
3- Trading above all key moving averages
Keep on Radar.
Potential Upside Stocks!
#Disclaimer: View shared it for educational purposes only.
Follow for more upcoming charts.

Volume building to go longTimeframe: Daily
Trend: Uptrend
Structure:
• Support: 560
• Resistance: 625,645
• Key Level: 607
View:
If Price holding above 607 level. both targets are achievable
Target1: 625
Target 2: 645
Risk Note:
Invalidation below 560.
⚠️ Educational & analytical view only. No investment advice.

See all editors' picks ideas
Arbitrage Detector [LuxAlgo]The Arbitrage Detector unveils hidden spreads in the crypto and forex markets. It compares the same asset on the main crypto exchanges and forex brokers and displays both prices and volumes on a dashboard, as well as the maximum spread detected on a histogram divided by four user-selected percenti

Multi-Distribution Volume Profile (Zeiierman)█ Overview
Multi-Distribution Volume Profile (Zeiierman) is a flexible, structure-first volume profile tool that lets you reshape how volume is distributed across price, from classic uniform profiles to advanced statistical curves like Gaussian, Lognormal, Student-t, and more.
Instead of forcin

Multi-Ticker Anchored CandlesMulti-Ticker Anchored Candles (MTAC) is a simple tool for overlaying up to 3 tickers onto the same chart. This is achieved by interpreting each symbol's OHLC data as percentages, then plotting their candle points relative to the main chart's open. This allows for a simple comparison of tickers to tr

Vdubus Divergence Wave Pattern Generator V1The Vdubus Divergence Wave Theory
10 years in the making & now finally thanks to AI I have attempted to put my Trading strategy & logic into a visual representation of how I analyse and project market using Core price action & MacD. Enjoy :)
A Proprietary Structural & Momentum Confluence System

Per Bak Self-Organized CriticalityTL;DR: This indicator measures market fragility. It measures the system's vulnerability to cascade failures and phase transitions. I've added four independent stress vectors: tail risk, volatility regime, credit stress, and positioning extremes. This allows us to quantify how susceptible markets are

Volatility Risk PremiumTHE INSURANCE PREMIUM OF THE STOCK MARKET
Every day, millions of investors face a fundamental question that has puzzled economists for decades: how much should protection against market crashes cost? The answer lies in a phenomenon called the Volatility Risk Premium, and understanding it may fundam

Volume Gaps & Imbalances (Zeiierman)█ Overview
Volume Gaps & Imbalances (Zeiierman) is an advanced market-structure and order-flow visualizer that maps where the market traded, where it did not, and how buyer-vs-seller pressure accumulated across the entire price range.
The core of the indicator is a price-by-price volume prof

Match Finder [theUltimator5]Match Finder is the dating app of indicators. It takes your current ticker and finds the most compatible match over a recent time period. The match may not be Mr. right, but it is Mr. right now. It doesn't forecast future connection, but it tells you current compatibility for today.
Jokes aside,

Trend Line Methods (TLM)Trend Line Methods (TLM)
Overview
Trend Line Methods (TLM) is a visual study designed to help traders explore trend structure using two complementary, auto-drawn trend channels. The script focuses on how price interacts with rising or falling boundaries over time. It does not generate trade sign

Breakouts & Pullbacks [Trendoscope®]🎲 Breakouts & Pullbacks - All-Time High Breakout Analyzer
Probability-Based Post-Breakout Behavior Statistics | Real-Time Pullback & Runup Tracker
A professional-grade Pine Script v6 indicator designed specifically for analyzing the historical and real-time behavior of price after strong All-Ti

See all indicators and strategies
Community trends
BPCL : Trading the Confluence of Price Action & Macro TailwindsThe stock has been consolidating within a defined range over the past few weeks and has recently started forming a solid base. While the breakout volume isn’t a classic “God-candle,” price action continues to hold firmly above key moving averages, which is a constructive sign. That said, the price i
PolycabPolycab is looking good.
Key EMAs have aligned, a breakout from here may give a good upside move.
Keep it in your watchlist for paper trading.
✅ If you like my analysis, please follow me here as a token of appreciation :)
in.tradingview.com/u/SatpalS/
📌 For learning and educational purposes o

Trading view, Mountains, Back testing strategy & New yearHappy new year to the Trading view Family, Wishing everyone a strong Year Ahead and in green .
Keep back testing and learning .
DLF LONGDLF is moving in sideways (As per long term chart), I see it is consolidated for few days after downside. Now it will move to upside from cmp 698.70 to 727 in short term.
I have shown downward and consolidation in chart. If it close below 698 (Hourly basis) will be considered still as consolidation

CONCOR – 1D | 10-Year Support & Trendline BreakoutCompany Intro:
Container Corporation of India Ltd (CONCOR) is a Navratna PSU and India’s largest integrated logistics company, operating inland container depots (ICDs), container freight stations (CFS), and rail-based logistics services. It plays a key role in India’s EXIM trade and domestic freight
Supreme Industries Cmp 3354 Flag PatternSupreme Industries Cmp 3354 dated 31-12-2025
1. Flag Pattern after a long correction
2. RSI BO
Buy @Cmp SL 3260 target 3400-3420-3450-3475-3500-
3525-3550-3575-3600-3650
It is just a view, please trade at your own risk.

Kotak Mahindra Bank - Bulls Wish Happy 2026 Ahead!!!Kotak Mahindra Bank after 4 years of tight consolidation , has given a Beautiful 2025 Yearly Breakout!!!
It is trading inside a expanding ascending channel pattern from 2014 till now ....taking support and resistance at respective channel lines( shown below- 6month timeframe chart )
Chances ar
Coal India. Small Trade.Coal India.. Trading inside a channel..
One can look for a small trade from here and look for first target of 410.
Second target is 417..
If enters again inside channel then 387-388..
Seeing the volume building, there are good chances of upward move..

UPL - Multi time frame analysis...Happy New Year, my dear followers!!! 🎉
The price in the lower time frame(15 minutes) and higher time frame(daily) is forming a bull flag breakout pattern, which is bullish.
We can use the lower time frame for trade entry.
Support zones are 780 and 800.
Buy above 801 - 804 with the stop loss of 796 f

LTTS : Near Key Support | Trend Continuation WatchTimeframe: Daily
Trend Context: Corrective phase nearing completion
Current Price Zone: ~4,380
🔍 Market Structure & Technical Observations
Elliott Wave Perspective (Educational View):
The stock appears to be completing a corrective Wave-C near the 4,360–4,390 zone.
This zone aligns with prior de

See all stocks ideas
Jan 6
GMBREWG.M. Breweries Ltd.
Actual
—
Estimate
—
Jan 8
JTLINDJTL Industries Limited
Actual
—
Estimate
—
Jan 8
EIMCOELECOEimco Elecon (India) Ltd.
Actual
—
Estimate
—
Jan 8
GTPLGTPL Hathway Ltd
Actual
—
Estimate
—
Jan 8
ELECONElecon Engineering Co. Ltd.
Actual
—
Estimate
—
Jan 9
BIRLAMONEYAditya Birla Money Limited
Actual
—
Estimate
—
Jan 9
GLOBUSSPRGlobus Spirits Limited
Actual
—
Estimate
—
Jan 9
JUSTDIALJust Dial Ltd.
Actual
—
Estimate
13.95
INR
See more events
Community trends
Why Bitcoin Broke Out After Weeks of Boring Price Action?Hello guy's let's analyse Bitcoin because for weeks, Bitcoin stayed inside a tight compression range while most traders lost interest. Price looked slow, directionless, and boring, exactly the phase where liquidity gets built quietly.
This breakout matters because it didn’t come after a spike.
It c

Alephium Enters Strong Support ZonePrice has inside a key rectangle support zone, making this an important level to watch.
Historically, this zone has acted as strong support price has tested this area twice before and recovered both times, indicating buyer interest.
The daily candle close is the key factor:
If price closes within

BTC at Major Resistance | Short Opportunity Near 90K ZoneBitcoin (BTCUSD) is approaching a key resistance zone between 89,900 – 90,600, an area where price has a higher probability of facing selling pressure.
📌 Trade Idea (Short Setup):
Instrument: BTCUSD
Sell Zone: 89,900 – 90,600
Target Area: 88,500 – 88,000
This zone may act as a supply area, wher

Leg Down on Bearish Div Micro TF leg down on BTC around 87.5K
If BTC creates a divergence, we might see a leg down again probability 60%

BTCUSD 1H Showing Correction after Strong SupplyBTCUSD on the 1H chart is moving in a corrective range after facing a well-defined supply zone. The previous bullish trend, with higher highs, higher lows, and an upward trendline, weakened near 90,000–90,200 due to repeated seller activity. Breaking below the trendline confirmed a short-term struct

Will Bitcoin Hit $50,000 or $500K In Next Cycle ?Most People Still Don’t Understand What This #Bitcoin Chart Is Saying.
This Is The 12-Month CRYPTOCAP:BTC Structure.
It Has Been Respected For 15 Years.
Every Cycle:
Excess → Reset → Higher Floor → Expansion.
All Called “The End.”
All Were Structural Resets.
Here’s The Part Retail Misses:
Bitcoi

AVNT Why This Zone Matters?📌 1. Pattern Overview
AVNT is trading inside a descending channel after a strong selloff.
This structure shows sellers still control the trend with lower highs, but the range is compressing which often leads to a sharp expansion once price leaves the channel.
Price is sitting in the decision zone o

Bitcoin (BTCUSD) Daily Chart – Potential Bullish Reversal Above Market Structure
BTC experienced a strong downtrend from the October high, followed by a base formation in December.
Price is now forming higher lows, suggesting a potential trend reversal or early-stage uptrend.
The ascending trendline (dashed blue) indicates growing bullish structure if respect

Coiled Spring Bitcoin is holding structure on the high time frames, currently reclaiming the $90k level after testing the lows. I’ve got my weighted average bands on the chart and price is respecting them so far. You can see on the daily chart how we’ve just poked back above the latest FOMC anchor (the blue line)

Bitcoin weekly chart observations Bitcoing on weekly charts is now undergoing a corrective to the big fall from 124000 levels
. The corrective to upside will likely face resistance in the zone marked by horizontal rays
Eventually price is likely to turn lower again and reach the green support zone

See all crypto ideas
GIFTNIFTY IntraSwing Levels For 02nd JAN 2026🚀Follow & Calculate Premium with NIFTY Post for NF Trading
💥Level Interpretation / description:
L#1: If the candle crossed & stays above the “Buy Gen”, it is treated / considered as Bullish bias.
L#2: Possibility / Probability of REVERSAL near RLB#1 & UBTgt
L#3: If the candle stays above “Sell
Gold Trading Strategy for 02nd January 2026🟡 GOLD (XAUUSD) – 1 HOUR CANDLE STRATEGY ⏳
📈 BUY SETUP
🟢 Buy only if price breaks & 1-Hour candle CLOSES ABOVE:
➡️ 4374
🎯 Buy Targets:
🎯 4385
🎯 4396
🎯 4408
📌 Confirmation is mandatory: wait for full 1-hour candle close above 4374.
📉 SELL SETUP
🔴 Sell only if price breaks & 1-Hour candle CLOSES BELO

XAU/USD: Retrace to Supply, Await Next Move Reaction◆ Market Context (M30)
After the previous sharp decline, gold has formed an upward CHoCH and upward BOS, confirming a short-term recovery. The price is currently approaching the upper Supply zone, where strong selling pressure was previously observed.
◆ Structure & Flow (SMC)
• The nearest bottom i

Elliott Wave Analysis XAUUSD – January 2, 2026
🎉 Happy New Year 2026
Wishing everyone a disciplined, consistent, and profitable trading year ahead.
1. Momentum Analysis
Daily (D1)
Daily momentum is currently approaching the oversold zone and preparing for a bullish reversal. This suggests that in the coming period, the market is likely to se

Natural Gas : Bullish with the key level 2.600Earlier I posted but it this post I changed the count of motive waves instead of impulse wave!
i:e: taking this whole upside move as an expanding diagonal structure
which suggest wave 3 of higher degree can take the prices up to 6.500
key level for this scenario is 2.600

Gold Update: Watching Channel Support for ContinuationGuys last trade of the year haha, let's see if we got something in this trade. Gold is trading inside a rising channel, and the overall structure remains positive. After the recent move up, price has pulled back toward the lower side of the channel, which is a normal and healthy behavior in an uptre

CRUDE OIL VIEWCrude View
support 5220 5160 up move possible
target 5350 5550
sl 5040 below sustain strongly
view is for study purpose only , we are not recommend any trade or investment
Always do your own analysis

trend reversal ?looks like tsemperary high made , so wait for supply zone for short, & take conformation in lower tf before entering trade,

Entry Setup 1 for 2026Entry Setup 1 for 2026
If you are new to Forex Trade, first you will need to open a trading account .
Open a Trading Account Now:- ☛
Before Trade Entry Follow the Step:-
Step 1:- Identify the Trend
Step 2:- Bullish Trend Wait for Support Price & Reversal Candlestick(Take Buy)
Step 3:- Bearish

Bollinger Bands: Timing Your Short Sell EntriesThis trade is a short (sell) taken after price moved and closed below the Bollinger middle band, confirming downside momentum and continuation within a strong intraday downtrend.
Bollinger band context.
Price is riding the lower Bollinger band, showing strong volatility expansion to the downside a

See all futures ideas
NZDJPY – Imbalance + Liquidity Sweep + Mean Reversion SetupNZDJPY recently took out a major liquidity level around 90.907, sweeping the equal lows resting below that zone. This sweep created a fake breakout of structure, indicating that the downside move was engineered to capture liquidity rather than continue lower.
After the liquidity grab, price immedia

Usd jpy idea correction in terms of higher Timeframe The previous idea posted about usd jpy should hit 172$ in terms of lower timeframe but 12 month or 1 year timeframe shows target is done....

GBPUSD broke level of 1.34820As you can see GBPUSD broke level of 1.34820 and massive fall already happened so I give you next expected move.
Plan your trade accordingly.

USDINR — Controlled Structural TrendUSDINR continues to trade within a long-term rising channel on the yearly timeframe.
The move reflects gradual structural INR depreciation , driven by macro differentials rather than stress or disorderly conditions.
No currency regime shift is visible at cycle degree.
Invalidation: Only a sust

EURCAD Elliot Wave_LongI’m anticipating an upside move in EURCAD around the 1.62200 level. It’s a low-risk, high-reward setup. Please do your own research before making any trading decisions.

GBP/USD - Short - 15 MInIn this trade, the 4-hour timeframe supply order block was mitigated, followed by a clear Market Structure Shift (MSS). After confirming the MSS, we shifted to the lower timeframe to identify a valid order block. Price respected the LTF order block, providing a high-probability entry, with the marke

#USDJPY #FOREX #USDJPY
According to recent analysis, the pair has reached a local target of 157.77$ and is currently consolidating. There's a possibility of a corrective move towards 154.90$ before resuming the uptrend, with potential targets at 158.00$ and 161.00$
However, expecting a big breakout below 140$,

EUR/USD – Accumulation After Sell-Off, Structure-Based Long IdeaEUR/USD has seen a strong sell-off, followed by a sharp reaction from a well-defined support zone. This area has already proven its strength by absorbing selling pressure and pushing price higher.
After the bounce, price is now consolidating near support instead of breaking down further, indicatin


Aud Cad Short-Term Downtrend: The short-term trend has been identified as being "DOWN" since December 10, 2025, indicating that minor, temporary corrections might occur within the larger bullish trend.
Resistance Zones: The price is testing strong resistance or supply zones around the 0.9140–0.9150 area, wh

See all forex ideas
| - | - | - | - | - | - | - | - | ||
| - | - | - | - | - | - | - | - | ||
| - | - | - | - | - | - | - | - | ||
| - | - | - | - | - | - | - | - | ||
| - | - | - | - | - | - | - | - | ||
| - | - | - | - | - | - | - | - | ||
| - | - | - | - | - | - | - | - | ||
| - | - | - | - | - | - | - | - | ||
| - | - | - | - | - | - | - | - |
Trade directly on Supercharts through our supported, fully-verified, and user-reviewed brokers.


