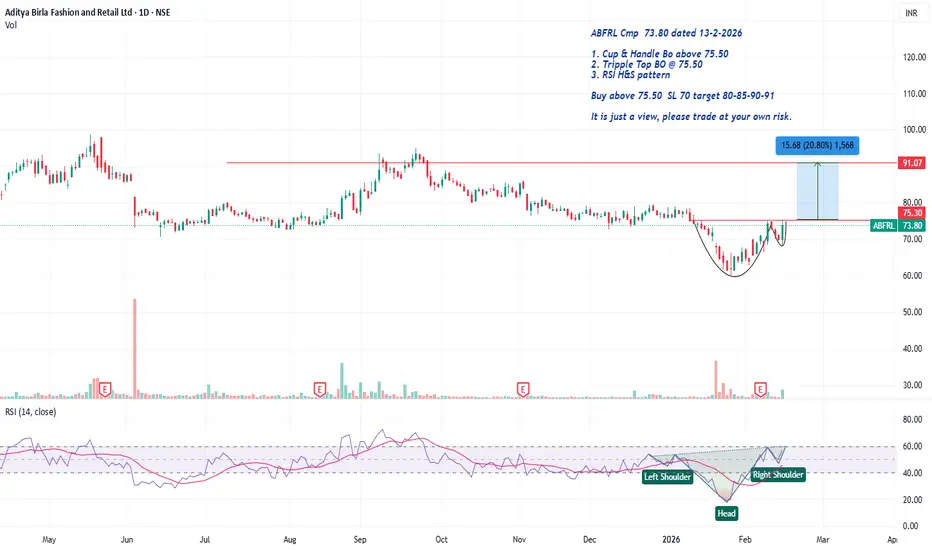
ABFRL Cmp 73.80 Cup & Handle BoABFRL Cmp 73.80 dated 13-2-2026
1. Cup & Handle Bo above 75.50
2. Tripple Top BO @ 75.50
3. RSI H&S pattern
Buy above 75.50 SL 70 target 80-85-90-91
It is just a view, please trade at your own risk.

The best trades require research, then commitment.
Get started for free$0 forever, no credit card needed

Scott "Kidd" PoteetPolaris Dawn astronaut

Where the world does markets
Join 100 million traders and investors taking the future into their own hands.
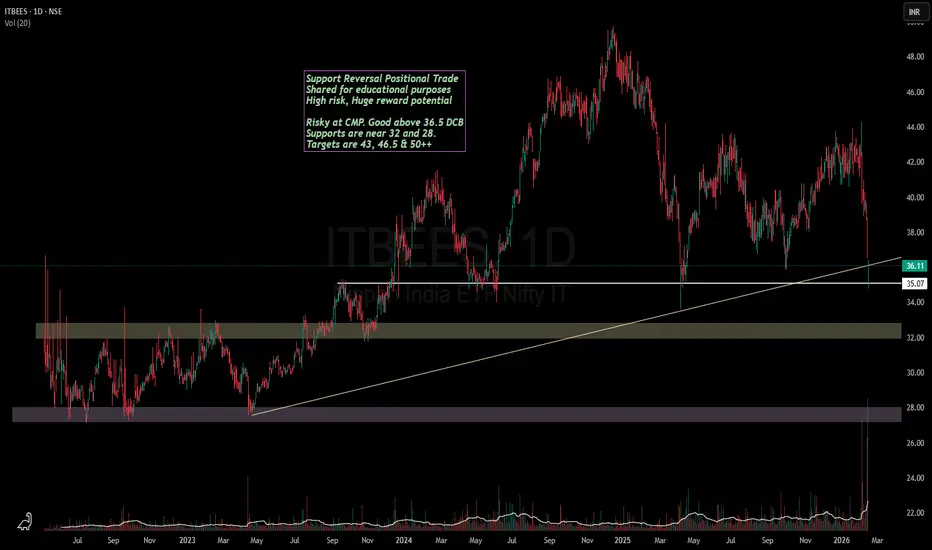
Investing:Nifty IT is looking good for long term accumulation!If you have been following the tech related news lately, it has been about the new AI "revolutionary" tool named Anthropic.
And the same is visible on charts of Nifty IT.
TCS is available at a price at which it was trading in December 2020.
Infy has just broke a crucial support.
Wipro has always b
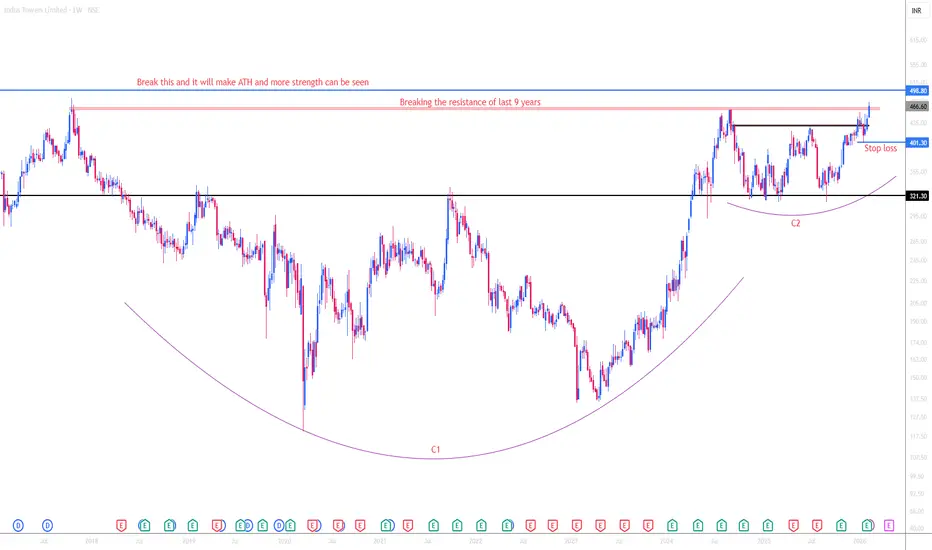
INDUS TOWER ANALYSISTHIS IS MY CHART OF THE WEEK PICK
FOR LEARNING PURPOSE
INDUS TOWER- The current price of INDUS TOWER is 466.60 rupees
I am going to buy this stock because of the reasons as follows-
1. It is making a new high by breaking the resistance of last 9 years ( we often call this Multi year brea
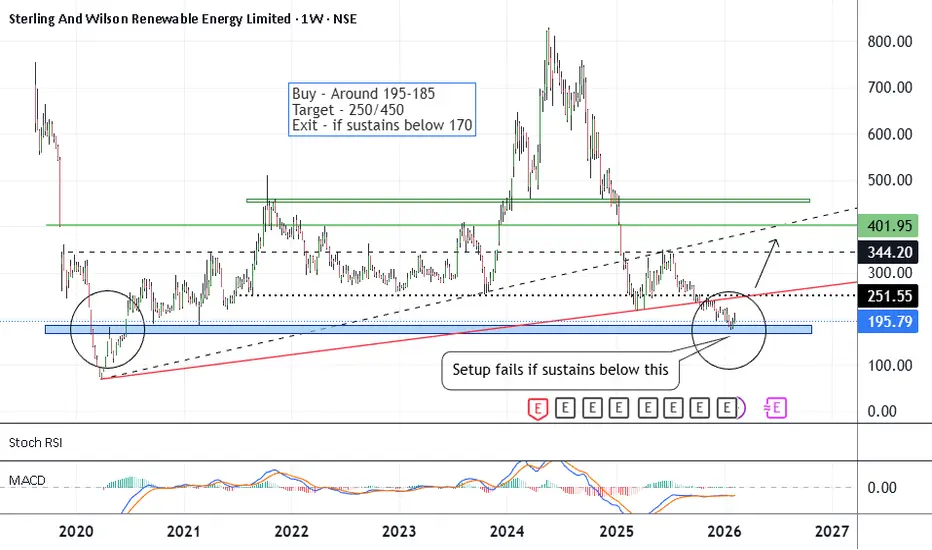
SW Solar - Bottom FishingCMP 195 on 14.02.26
As can be seen on the chart. There has been a big correction in the stock price in the past months. Presently trading near the lowest prices. If a reversal takes place, may go into a bullish phase ahead.
Possible targets may be 250/450.
The setup fails if it sustains below 170.
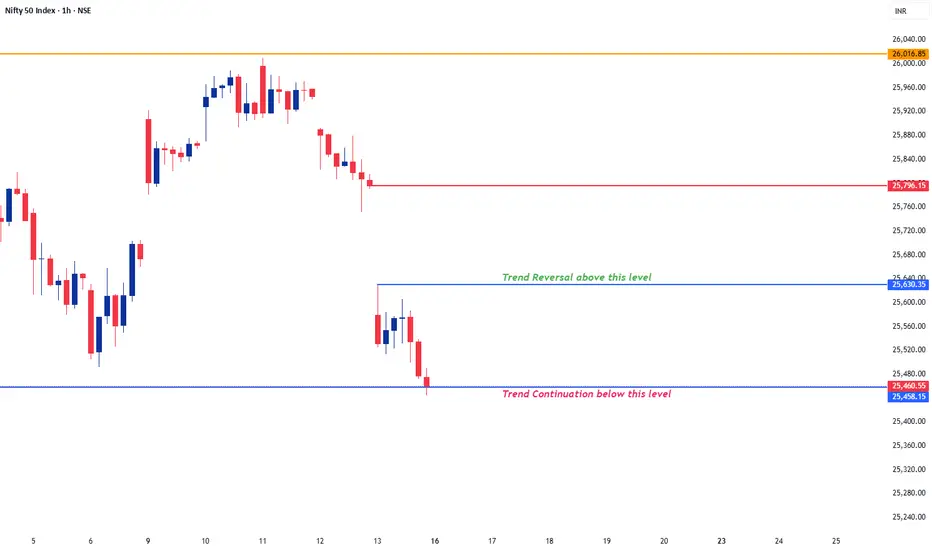
#Nifty Weekly 16-02-26 to 20-02-26#Nifty Weekly 16-02-26 to 20-02-26
25450-25650 is the sideways range for next week.
25800 will act as Resistance for next week.
Wait for above range to break on either side for a trending move.
Long level is above 25650 for the targets of 25780/25900.
Short level is below 25450 for the targets of 25
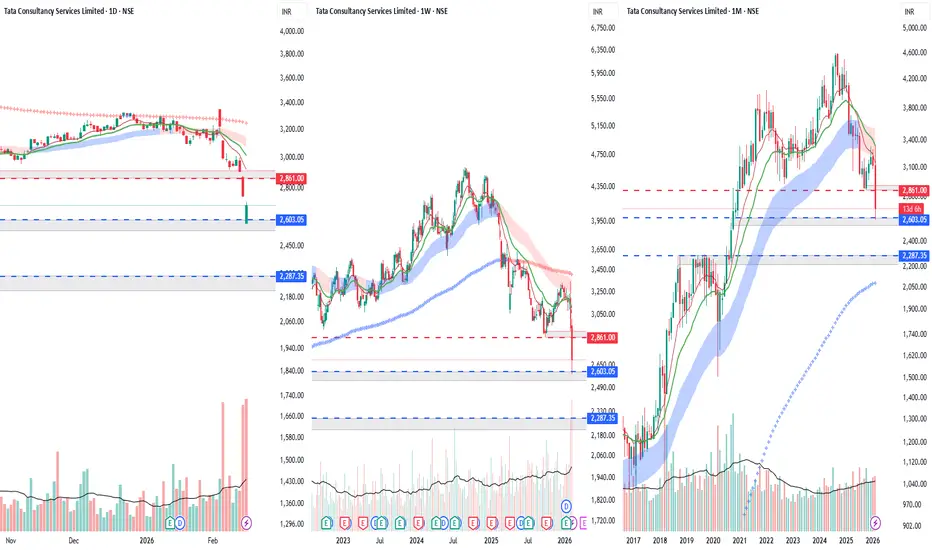
What to do in TCS if we are Holding?What to do in TCS if we are Holding?
Market Sentiment :
- Extremely week: Due to AI disruption Theory
Technical:
- Extremely Week: Daily, Weekly, Monthly Lower Lows formation
Should We Enter at this Level?
- No New Entry suggested unless we see Daily close above 20EMA
But I am already Hold
SILVER 1HRSWING TRADE
SILVER (XAGUSD) Looking good for Downside..
When it break level 73.77 and sustain.. it will go Downside...
SELL @ 73.77
Target
1st 63.89
2nd 56.48
Enjoy trading traders.. Keep add this STOCK in your watch list..
Big Investor are welcome..
Like this Post??? Hit like button..!!!
Foll

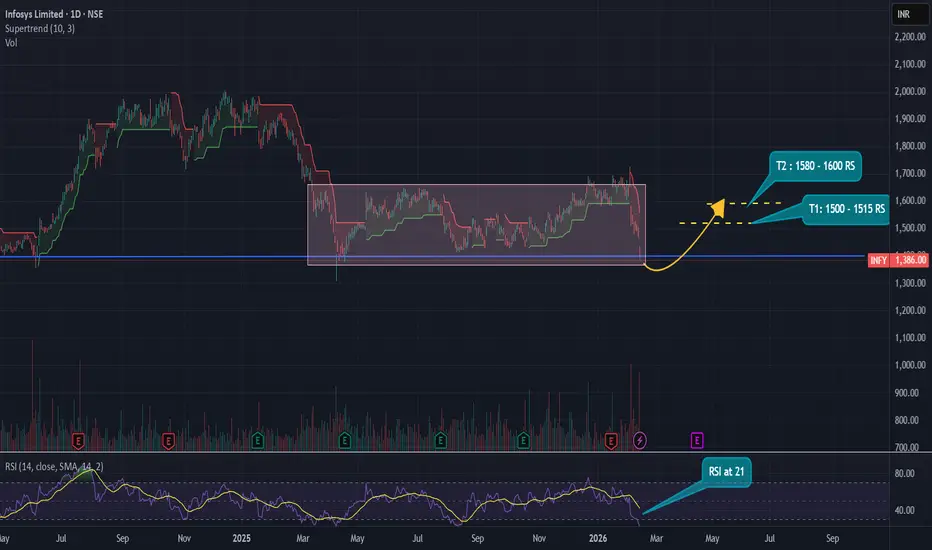
Infosys LimitedInfosys Technical Outlook :
Infosys has been consolidating within the ₹1400–₹1700 range over the past year. Currently, the stock is in the oversold zone, with the RSI at 21, and is testing a strong support level around ₹1400.
From a mid-term perspective, the setup looks attractive:
- Target 1: ₹1500
$ETH has officially lost the 2000–2020 base CRYPTOCAP:ETH has officially lost the 2000–2020 base we highlighted on the 1H chart.
Triple-top rejection (Top 1 → Top 2 → Top 3) played out perfectly — buyers failed at the 2140–2160 supply zone, and breakdown followed.
📍 First reaction target (1980–1950) ✅ Hit
That’s roughly a 2.6–3% move from

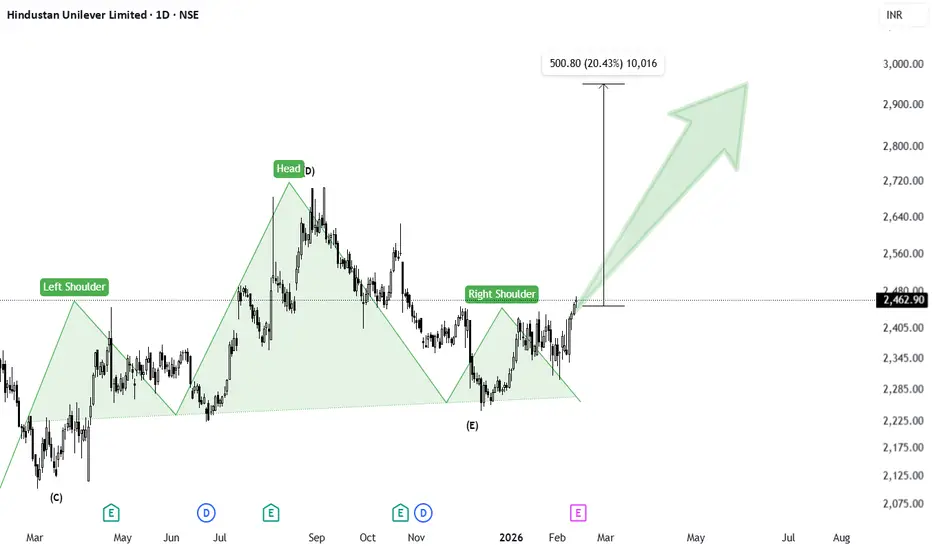
Hindustan Unilever : Prepared for Upside Hindustan Unilever – Failed Head & Shoulders Turning Bullish (Daily Chart)
On the daily timeframe, Hindustan Unilever was forming a well-structured Head & Shoulders pattern. The left shoulder, head, and right shoulder were clearly visible, with a defined neckline acting as support.
However, instea
See all editors' picks ideas
MovingAveragesLibrary "MovingAverages"
A collection of O(1) numerically stable moving averages that support anchors and fractional lengths up to 100k bars.
Pine Script has a robust set of moving averages suitable for a majority of cases, making these alternatives useful only if you need anchoring, fractional
Pine Script® library

Clusters Volume Profile [LuxAlgo]The Clusters Volume Profile indicator utilizes K-Means clustering to categorize historical price action into distinct groups and generates individual volume profiles for each detected cluster. This tool provides a unique perspective on volume distribution by isolating price behaviors based on prox
Pine Script® indicator

Central Bank Liquidity Gap IndicatorThis indicator measures the gap between global liquidity growth and stock market growth to identify potential buying opportunities.
Liquidity drives markets. When central banks print money, that liquidity eventually flows into stocks and other assets. If we spot when liquidity growth is outpacing
Pine Script® indicator

Peak Trading Activity Graphs [LuxAlgo]The Peak Trading Activity Graphs displays four graphs that allow traders to see at a glance the times of the highest and lowest volume and volatility for any month, day of the month, day of the week, or hour of the day. By default, it plots the median values of the selected data for each period. T
Pine Script® indicator

Smart Trader, Episode 03, by Ata Sabanci, Candles and TradelinesA volume-based multi-block analysis system designed for educational purposes. This indicator helps traders understand their current market situation through aggregated block analysis, volumetric calculations, trend detection, and an AI-style narrative engine.
━━━━━━━━━━━━━━━━━━━━━━━━━━━━━━━━━━━━━━━
Pine Script® indicator

Asset Drift ModelThis Asset Drift Model is a statistical tool designed to detect whether an asset exhibits a systematic directional tendency in its historical returns. Unlike traditional momentum indicators that react to price movements, this indicator performs a formal hypothesis test to determine if the observed d
Pine Script® indicator

Hyperfork Matrix🔱 Hyperfork Matrix 🔱 A manual Andrews Pitchfork tool with action/reaction propagation lines and lattice matrix functionality. This indicator extends Dr. Alan Andrews' and Patrick Mikula's median line methodology by automating the projection of reaction and action lines at equidistant intervals, cr
Pine Script® indicator

Arbitrage Matrix [LuxAlgo]The Arbitrage Matrix is a follow-up to our Arbitrage Detector that compares the spreads in price and volume between all the major crypto exchanges and forex brokers for any given asset.
It provides traders with a comprehensive view of the entire marketplace, revealing hidden relationships among d
Pine Script® indicator

Wyckoff Schematic by Kingshuk GhoshThe "Wyckoff Schematic" is a Pine Script indicator that automatically detects and visualizes Wyckoff Method accumulation and distribution patterns in real-time. This professional tool helps traders identify smart money movements, phase transitions, and critical market structure points.
Key Features
Pine Script® indicator

Volume Cluster Profile [VCP] (Zeiierman)█ Overview
Volume Cluster Profile (Zeiierman) is a volume profile tool that builds cluster-enhanced volume-by-price maps for both the current market window and prior swing segments.
Instead of treating the profile as a raw histogram only, VCP detects the dominant volume peaks (clusters) insid
Pine Script® indicator

See all indicators and strategies
Community trends
BUY TODAY SELL TOMORROW for 5% DON’T HAVE TIME TO MANAGE YOUR TRADES?
- Take BTST trades at 3:25 pm every day
- Try to exit by taking 4-7% profit of each trade
- SL can also be maintained as closing below the low of the breakout candle
Now, why do I prefer BTST over swing trades? The primary reason is that I have observed t

ABFRL Cmp 73.80 Cup & Handle BoABFRL Cmp 73.80 dated 13-2-2026
1. Cup & Handle Bo above 75.50
2. Tripple Top BO @ 75.50
3. RSI H&S pattern
Buy above 75.50 SL 70 target 80-85-90-91
It is just a view, please trade at your own risk.
ZEEL RSI DIVERGENCEZEE Enterprises Limited is showing a strong Bullish RSI Divergence on the monthly chart.
Neither am I SEBI registered nor it's a trade recommendation. For educational purpose only.

Stock set for a correctionONGC CMP 270.65
Exit this counter.
Trendline- stock taking resistance from under the trendline is very negative. Its a good reason to sell the counter. Since it is on the monthly chart. The impact will be big.
Volume - huge volume near the highs is capitulation.
Oscillator- Composite is givin

Long or Short ? BSEDuring the recent past, we have observed that BSE has remained highly volatile, yet the price action continues to move within a well-defined range.
Today, the stock is approaching the lower end of this range, which opens a potential opportunity to consider Long positions based on the current struct

#ASTRAL strong Base support#ASTRAL strong Base on Monthly breakout
initial level for 1875(14%)
long term levels 2150/2454
investor can HOLD for decent return
traders can play swing

RECLTD : Entry at the Deep Retracement Zone — Bulls Loading?📝 The Technical Breakdown (Educational Guide)
This chart is a textbook example of how to identify a trend reversal by combining Price Action structures with Volume analysis. Here are 4 key educational points:
1. Demand Zone at Deep Retracement 🛡️
The price has returned to the Demand zone at deep re

Divgi TorqTransfer Systems cmp 744.55 Weekly Chart since listedDivgi TorqTransfer Systems cmp 744.55 by Weekly Chart view since listed
- Support Zone 475 to 575 Price Band
- Resistance Zone 760 to 860 Price Band
- Falling Resistance Trendline Breakout well sustained
- Bullish Head & Shoulders formed under the Resistance Zone
- Heavy Volumes spike plus good syn

TVSSCS: Trendline Breakout Post Strong Q3FY26, Chart of the WeekTVS Supply Chain Solutions Just Broke Out on 12x Volume After Hitting Rock Bottom; Technical Reversal Meets a ₹6,300 Crore Order Pipeline. This Breakout Could Define TVS Supply's Next 12 Months. Let's Understand in "Chart of the Week"
As per the Latest SEBI Mandate, this isn't a Trading/Investm

Tata Power at Decision Zone — Breakdown or Breakout Loading?Price has been trading inside a clear descending channel, respecting both resistance and support trendlines with precision.
Recently, the stock bounced from lower channel support with strong buying interest and is now approaching the upper supply trendline, which historically acted as rejection zone

See all stocks ideas
Today
AGSTRAAGS Transact Technologies Ltd.
Actual
—
Estimate
—
Feb 19
VESUVIUSVesuvius India Ltd
Actual
—
Estimate
—
Feb 19
SANOFICONRSanofi Consumer Healthcare India Limited
Actual
—
Estimate
—
Feb 19
ABBABB India Limited
Actual
—
Estimate
20.78
INR
Feb 19
CIEINDIACIE Automotive India Ltd
Actual
—
Estimate
5.40
INR
Feb 24
SCHAEFFLERSchaeffler India Ltd
Actual
—
Estimate
19.40
INR
Feb 25
FLFLFuture Lifestyle Fashions Ltd.
Actual
—
Estimate
—
Feb 26
KSBKSB Ltd.
Actual
—
Estimate
4.40
INR
See more events
Community trends
$BTC printed a clean double bottom around 68.1k–68.2k.After that sharp sell-off from the 70.8k region, CRYPTOCAP:BTC printed a clean double bottom around 68.1k–68.2k.
We’re not trending. We’re rotating.
Price is now hovering near 68.3k–68.4k, right inside an intraday range.
Here’s what matters:
🔹 68.1k–68.2k → Strong intraday demand (defended twi

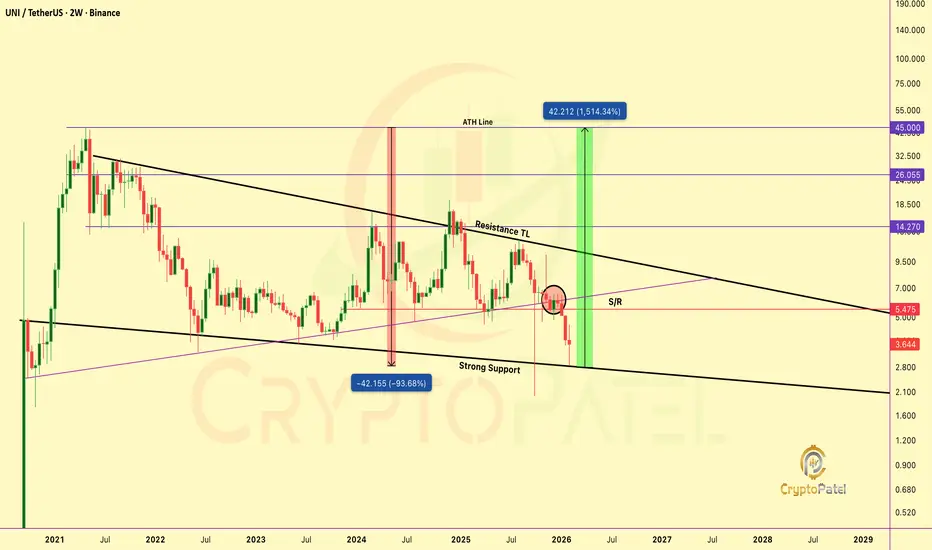
IS UNI/USDT THE GENERATIONAL BUY BEFORE 1,500% RALLY?BME:UNI DROPPED -93% FROM ATH: IS THIS THE GENERATIONAL BUY BEFORE 1,500% RALLY?
#UNI Is Currently Testing A Multi-Year Descending Channel Support That Has Held Since 2022, A Rare, High-Timeframe, Cycle-Level Structure.
The Last Time This Setup Formed, UNI Delivered:
2020: +2,400% (24x From Oct 2
Range Accumulation After Sell-Off, Bullish Breakout in ProgressMarket Overview
On the 1H timeframe, BTCUSD shows a clear transition from a strong bearish impulse into a structured accumulation phase, followed by an early-stage bullish breakout attempt.
Phase 1: Distribution & Breakdown
Price formed a distribution range near the 76,000–78,000 zone.
Multiple

The could be possible tradeNow here is the why it can happen - so far in the history of bitcoin there has been no low break of a red candle but this time it happened.

Analysis – Demand Zone Bounce Toward Key Resistance🔎 Market Overview
On the 1-hour timeframe, BTCUSDT (Bybit) shows a strong bullish reaction after forming a short-term bottom near the 65,000 area. Price has broken structure to the upside and is now consolidating above a marked demand zone, suggesting buyers are in control for the short term.
🟢 Key


Weekly Analysis with buy/Sell scenarios in BTC👋👋👋 Friends, What's your view on BTC???
Last week, Bitcoin (BTC) traded with high volatility and a corrective bias, briefly dropping toward the critical $60,000 support zone before staging a sharp rebound toward $68,000–$70,000, but failing to sustain above $70K and closing the week slightly negat

Will Bitcoin Recover or continue to perishBTC/USD Analysis (Weekly Chart)
- Bitcoin's primary trend is bullish, although on a weekly chart, the prices, which were trending with a rising wedge, gave a bearish breakout.
- However, the prices are retracing higher after testing the lower order block (black zone).
- Currently, prices are rest

What Are Reserves and Why Are They Important?1. Financial Security and Stability
One of the most important reasons reserves are necessary is to provide financial security. Businesses and individuals face uncertainties such as economic downturns, sudden expenses, or unexpected losses. Having reserves ensures that operations can continue even d

Bitcoin’s Corrective Wave in Action 🚀 Bitcoin’s Corrective Wave in Action 📈💡
After touching a low near 60K, Bitcoin has begun rising within its Corrective ABC formation.
🔹 Wave A:
• Rose in 3 sub-waves, signaling a flat correction 🔄
• Hit a high of 72,271 📊
• Duration: 21 bars — a Fibonacci number ✨
🔹 Wave B (ongoing):
• Current

See all crypto ideas
Weekly Analysis with buy/Sell scenarios in Gold/XAUUSD👋👋👋 Friends, What's your view on Gold???
Last week, global gold prices showed a volatile but upward bias, with spot gold recovering after a dip and ending the week with gains of roughly 1–2%, holding near the $5,000–$5,050 zone;
As per the current scenario we may further expect consolidation in t

GIFTNIFTY Intra-Swing Level Analysis for 16th FEB 2026GIFTNIFTY Intra-Swing Level Analysis for 16th FEB 2026
🚀Follow & Compare NIFTY spot Post for Taking Trade
━━━━━━━━━₹₹₹₹₹₹₹₹₹₹₹₹━━━━━━━━
⚪Weekly PCR Analysis:
17 Feb 2026 EXP. Weekly Basis =>
PCR: 0.66 Trend Strength: 🛑 Bearish.
Intraday Change in Weekly Basis Data =>
Change OI PCR: 2.2

Gold Trading Strategy for 16th February 2026📊 Intraday Trading Setup
🟢 BUY Setup – Breakout Strategy
👉 Condition:
Buy only if the 30-minute candle closes above $5050
🔹 Entry: Above the high of the 30-min candle close above $5050
🔹 Confirmation: Strong bullish candle close with good volume
🎯 Targets:
Target 1: $5065 💰
Target 2: $5078 💰💰
Ta

Gold Pullback Into Structure Support – Trend Continuation SetupGold has pulled back into a rising structure support zone after completing a strong upside move. Price is now retesting the trendline while holding above previous higher lows.
This type of setup is important because strong trends usually offer pullbacks before continuation. As long as price holds a

NIFTY LOOKS UPToday was quite a turnaround session for the Indian markets. After a weak opening that saw the Nifty slip below 25,400, a strong late-day rally led by the banking and energy sectors helped indices snap a losing streak.
## Market Performance (Feb 16, 2026)
Nifty 50: Ended at 25,682.75, up 211.65 po

XAUUSD – Weekly Outlook: ConsolidationXAUUSD – Weekly Outlook: Consolidation Before Expansion? | Lana ✨
Gold is entering the new week in a clear consolidation phase around the 4,960–5,000 region after defending the mid-range support and completing a corrective pullback from previous highs. On the 3H structure, price continues to respec

XAUUSD (H1) – Weekly Analysis | Geopolitical FactorsXAUUSD (H1) – Weekly Outlook | Geopolitics Back in Focus
Gold opens the week holding above short-term support after last week’s sharp sell-off and recovery. Price is now rotating beneath the 5,100 supply zone while geopolitical risk re-enters the narrative.
Netanyahu’s firm stance on Iran’s nuclea

Short Setup From Resistance to Support Overview
Timeframe: 45-minute
Instrument: Gold vs USD (XAU/USD)
The chart shows a recent strong bearish impulse (large red candle drop), followed by a rebound.
Price is now retracing upward into a previously established resistance zone.
2️⃣ Key Levels Identified
🟢 Resistance Zone: ~5,040 – 5,0

Gold Trading Strategy for Next Monday✅ The gold market is currently showing signs of short-term bullish momentum recovery. On the 4-hour chart, price has rebounded to the 5050 area, breaking above MA10 and MA20, which confirms the restoration of the short-term bullish structure. The Bollinger Bands’ middle and upper bands are turning u

Chart Analysis – Bullish Reversal Toward Resistance
The 1-hour chart of Gold vs US Dollar (XAU/USD) shows a strong bullish recovery after a sharp sell-off. Price has reclaimed a key demand zone and is now pushing toward a major resistance level.
🟢 1. Demand Zone Holding (Bullish Structure Intact)
Price sharply dropped into the 4,880–4,920 support

See all futures ideas
Expecting sell delivery in GBPUSDThe first and foremost which promotes my idea is "Daily and weekly structure where all Buyside liquidity is taken above , then price faile to make a high and close below the daily inversion (I-fvg) which indicates the bearish flow , and then made structure shift in 4H TF , afterwards it retested the

USDJPY ANALYSIS OVER H1 CHART.USDJPY is reacting well from the demand zone highlighted on my TradingView chart. Price is holding above support and starting to build a base, which keeps the bullish bias intact as long as this level holds.
I’m staying long from 153.500, targeting 154.700 → 156.200 → 157.650, with risk clearly pro


AUD- USD Analysis on 4Hr TFThe AUDUSD is in Up Trend . The Elliot Wave Impulse pattern I have mentioned may be treated as the retest and completion of Second Impulse Pattern of 2-3 for minimum Fib - 1.68 Level as the Target has been mentioned

EURUSD Looks Weak on Monthly ChartEURUSD Analysis (Monthly Chart)
* The pair is trending within a descending wedge pattern, and prices have failed to breach its upper trendline multiple times in recent months.
* During Jan, the pair breached the wedge, tested the supply order block, then retraced lower.
* The month of Feb also fai

FOREX "PAIRS IN PLAY" Session 33 15 02 26Scanning multiple forex pairs to filter high-quality trade setups. No trades are forced—only structure-based opportunities.
Note: There may be a delay in this video due to upload processing time.
Disclaimer: FX trading involves high leverage and substantial risk, and losses can exceed your initial

EURUSD BUY Breakout + Retest Entry
➡️ Break & Buy Above: 1.18956
When price decisively breaks above key resistance and holds, this signals bullish continuation.
📌 Stop-Loss: 1.1372
📌 Targets:
• TP1: 1.20888
• TP2: 1.21500
Why this works: Breakouts that retest previous resistance as support can unleash strong up moves.

AUDJPY – Bullish Reversal From Trendline SupportAUDJPY is reacting strongly from a major ascending trendline support on the 1H timeframe. Price swept liquidity below the structure, tapped into the demand zone, and immediately rejected — signaling buyer strength.
we entered long around 108.180, which aligns perfectly with the technicals.
📈 Why T


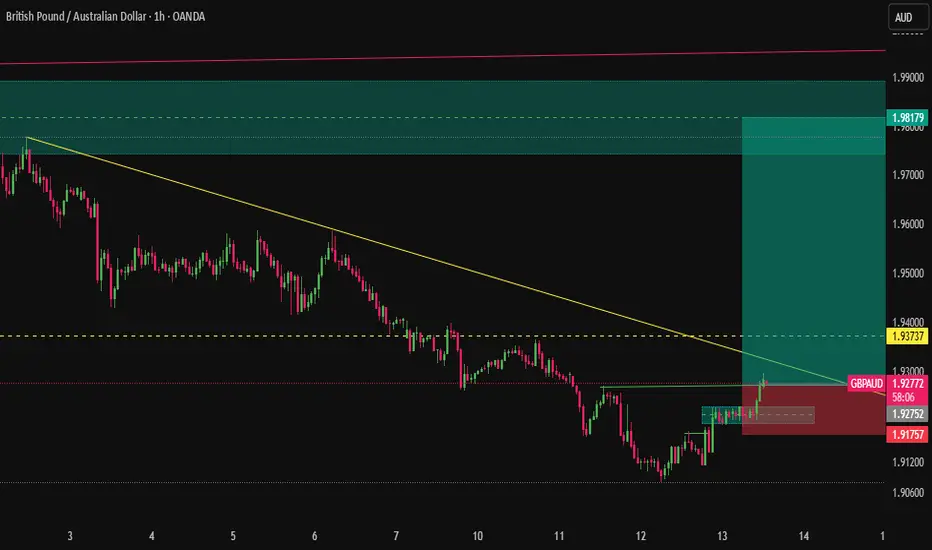
The "High R:R" Power PlayThe tides are turning for GBPAUD. After a prolonged bearish slide, we are witnessing a textbook structural shift on the 1H timeframe.
See all forex ideas
Trade directly on Supercharts through our supported, fully-verified, and user-reviewed brokers.


