$ETH has officially lost the 2000–2020 base CRYPTOCAP:ETH has officially lost the 2000–2020 base we highlighted on the 1H chart.
Triple-top rejection (Top 1 → Top 2 → Top 3) played out perfectly — buyers failed at the 2140–2160 supply zone, and breakdown followed.
📍 First reaction target (1980–1950) ✅ Hit
That’s roughly a 2.6–3% move from

The best trades require research, then commitment.
Get started for free$0 forever, no credit card needed

Scott "Kidd" PoteetPolaris Dawn astronaut

Where the world does markets
Join 100 million traders and investors taking the future into their own hands.
Hindustan Unilever : Prepared for Upside Hindustan Unilever – Failed Head & Shoulders Turning Bullish (Daily Chart)
On the daily timeframe, Hindustan Unilever was forming a well-structured Head & Shoulders pattern. The left shoulder, head, and right shoulder were clearly visible, with a defined neckline acting as support.
However, instea
SBILIFE: "Change of Character" Signaling somethingThe Technical Breakdown (Educational Guide)
The chart displays a beautiful confluence of Smart Money Concepts (SMC) and Fibonacci retracement. If you’ve been looking for a textbook "Buy the Dip" setup, this is it! Here are 4 key educational points from this chart:
1. The Choch (Change of Character)
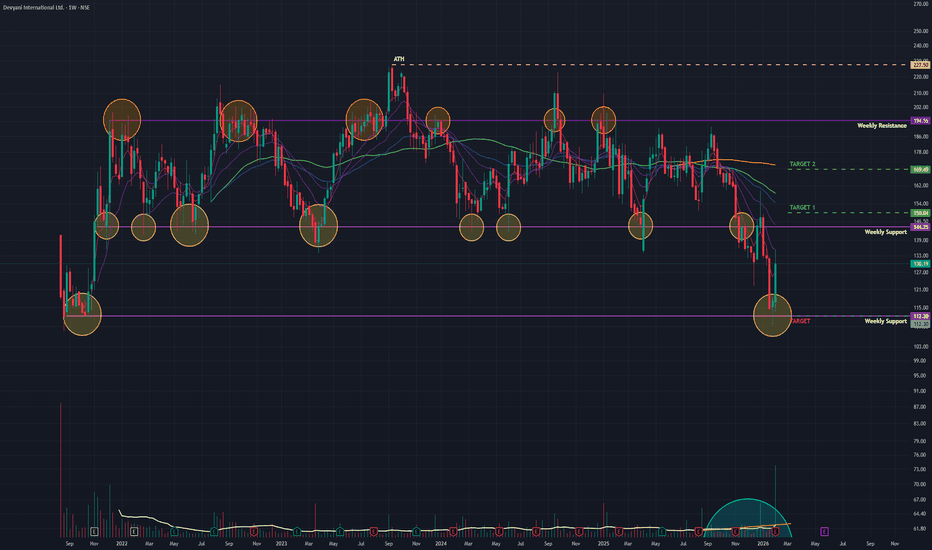
Devyani Int (W): Aggressive Bullish, Turnaround at Major Support(Timeframe: Weekly | Scale: Logarithmic)
The stock has confirmed a major "V-Shape Reversal" from its long-term support zone of ₹110. The surge is backed by "Climax Volume" and a positive reception to its Q3 operational updates, signaling that the 2-year correction might be over.
🚀 1. The Fund
Nykaa: Descending Trendline BreakoutNykaa respected the rising structure even during the correction and never lost its trend strength.
Price held the sloping support, absorbed selling pressure, and then gave a clean breakout above the key horizontal resistance around 277 with strong volume.
This move shows acceptance above resistanc
The crypto has found its supportBitcoin CMP $70690
The beauty of looking at various asset classes is that they rise and fall together. In my view the correction in the crypto is over.
Elliott- The v waves within the C wave is done. Hence to me this correction is over.
Fib- The crypto reversed just shy away from the 59K whic
NTPC.. Moved outside the channel..NTPC.. Trying its level best to move.
Selling pressure in market pulled it back and retested the support.
Now things can be interesting..
Moved above this channel then first target can be somewhere around 370, the exact level from where it faced resistance today..
Second can be somewhere around
Nifty Energy: Final Bounce Before the Deeper CorrectionThe Nifty Energy Index continues to trade within a higher-degree corrective structure rather than a fresh impulsive uptrend.
The decline from the highs appears to have completed Wave W, followed by an ongoing recovery in Wave X.
In the near term, the structure allows for one more upside phase . A
Dead Cat Bounce in Nifty? Heavyweights to Deliver The VerdictDead Cat Bounce in Nifty? Index Heavyweights to Deliver the Verdict Soon…
Both index heavyweights remain structurally weak despite the recent bounce.
On the daily timeframe, Reliance Industries and HDFC Bank have transitioned out of bullish Ichimoku regimes. Crucially, the second daily Kumo
Long term analysis of Tanla Platforms Ltd.Wrap up:-
As per chart of Tanla Platforms Ltd., it seems that correction in Tanla is over with a wxy pattern in major wave 2 and also, after breakout it has retested the support. Now, major wave 3 is about to start/started.
What I’m Watching for 🔍
As initial breakout is confirmed for a probabl
See all editors' picks ideas
Peak Trading Activity Graphs [LuxAlgo]The Peak Trading Activity Graphs displays four graphs that allow traders to see at a glance the times of the highest and lowest volume and volatility for any month, day of the month, day of the week, or hour of the day. By default, it plots the median values of the selected data for each period. T
Smart Trader, Episode 03, by Ata Sabanci, Candles and TradelinesA volume-based multi-block analysis system designed for educational purposes. This indicator helps traders understand their current market situation through aggregated block analysis, volumetric calculations, trend detection, and an AI-style narrative engine.
━━━━━━━━━━━━━━━━━━━━━━━━━━━━━━━━━━━━━━━
Asset Drift ModelThis Asset Drift Model is a statistical tool designed to detect whether an asset exhibits a systematic directional tendency in its historical returns. Unlike traditional momentum indicators that react to price movements, this indicator performs a formal hypothesis test to determine if the observed d
Hyperfork Matrix🔱 Hyperfork Matrix 🔱 A manual Andrews Pitchfork tool with action/reaction propagation lines and lattice matrix functionality. This indicator extends Dr. Alan Andrews' and Patrick Mikula's median line methodology by automating the projection of reaction and action lines at equidistant intervals, cr
Arbitrage Matrix [LuxAlgo]The Arbitrage Matrix is a follow-up to our Arbitrage Detector that compares the spreads in price and volume between all the major crypto exchanges and forex brokers for any given asset.
It provides traders with a comprehensive view of the entire marketplace, revealing hidden relationships among d
Wyckoff Schematic by Kingshuk GhoshThe "Wyckoff Schematic" is a Pine Script indicator that automatically detects and visualizes Wyckoff Method accumulation and distribution patterns in real-time. This professional tool helps traders identify smart money movements, phase transitions, and critical market structure points.
Key Features
Volume Cluster Profile [VCP] (Zeiierman)█ Overview
Volume Cluster Profile (Zeiierman) is a volume profile tool that builds cluster-enhanced volume-by-price maps for both the current market window and prior swing segments.
Instead of treating the profile as a raw histogram only, VCP detects the dominant volume peaks (clusters) insid
DeeptestDeeptest: Quantitative Backtesting Library for Pine Script
━━━━━━━━━━━━━━━━━━━━━━━━━━━━━━━━━━
█ OVERVIEW
Deeptest is a Pine Script library that provides quantitative analysis tools for strategy backtesting. It calculates over 100 statistical metrics including risk-adjusted return ratios (Sharpe
Arbitrage Detector [LuxAlgo]The Arbitrage Detector unveils hidden spreads in the crypto and forex markets. It compares the same asset on the main crypto exchanges and forex brokers and displays both prices and volumes on a dashboard, as well as the maximum spread detected on a histogram divided by four user-selected percenti
Multi-Distribution Volume Profile (Zeiierman)█ Overview
Multi-Distribution Volume Profile (Zeiierman) is a flexible, structure-first volume profile tool that lets you reshape how volume is distributed across price, from classic uniform profiles to advanced statistical curves like Gaussian, Lognormal, Student-t, and more.
Instead of forcin
See all indicators and strategies
Community trends
Hindustan Unilever : Prepared for Upside Hindustan Unilever – Failed Head & Shoulders Turning Bullish (Daily Chart)
On the daily timeframe, Hindustan Unilever was forming a well-structured Head & Shoulders pattern. The left shoulder, head, and right shoulder were clearly visible, with a defined neckline acting as support.
However, instea
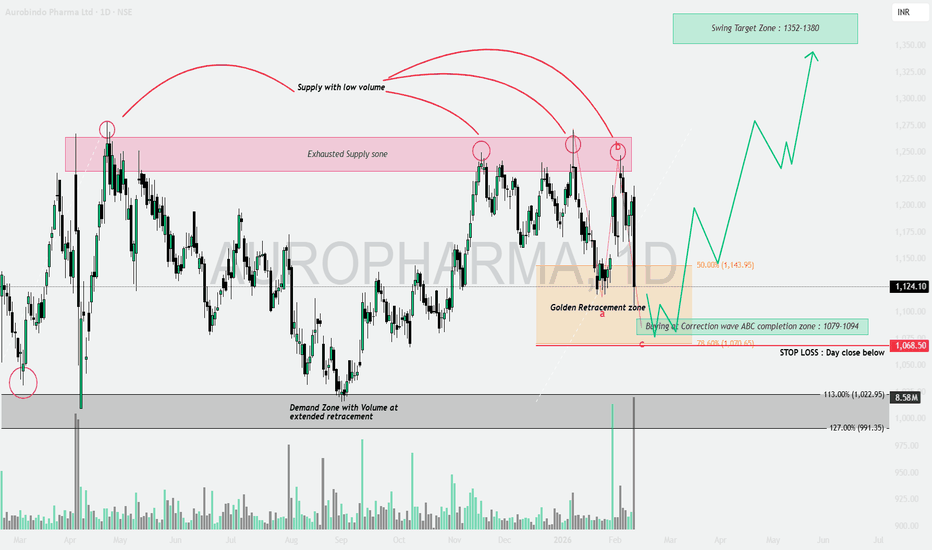
AUROPHARMA: Supply Exhaustion & The Golden Retracement📝 The Technical Breakdown (Educational Guide)
This chart is a masterclass in understanding Volume Price Analysis + Fibonacci Confluence. Let’s decode the setup through 4 key educational pillars:
1️⃣ Supply Exhaustion Zone 🔴
Observe the pink box marked as “Exhausted Supply Zone.”
Price has tested
M&M is looking good for 21% upside in next 5-6 MonthsM&M is looking good for 21% upside in next 5-6 Months
LTP - 3528
SL - 3280
Targets - 4300+
timeframe - 5-6 Months
Fundamentals:
Mahindra & Mahindra operates diverse businesses including Auto, Farm, Financial Services. It holds market leadership in SUVs and LCVs, is the #1 tractor manufacturer
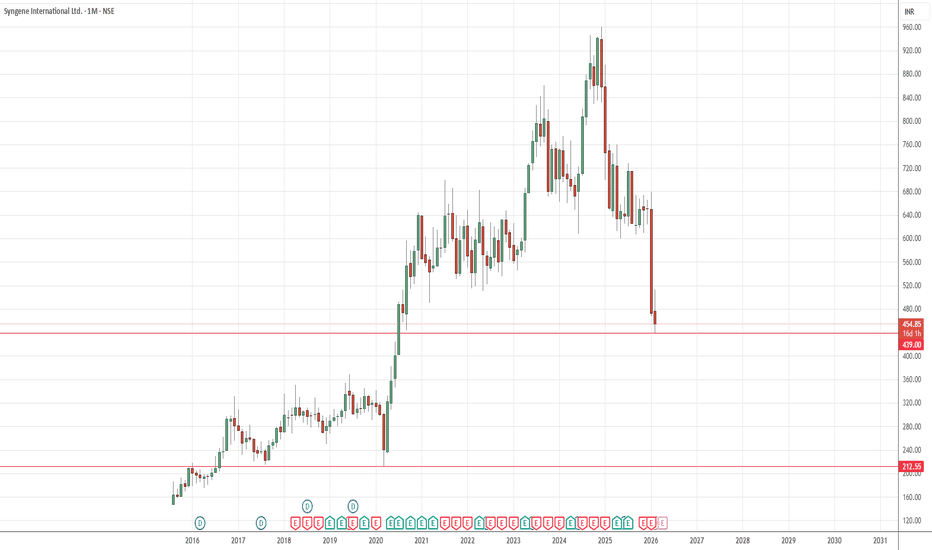
Syngene International Ltd not looks good below 439Below 439 target 212.55
Weak Q3 Results (Jan 2026): The company reported a sharp decline in profits, with margins squeezed due to biologics destocking. This disappointed investors and triggered a sell-off.
Revenue Guidance Miss: Analysts had expected ~15% revenue growth for FY26, but Syngene guide
BUY TODAY SELL TOMORROW for 5% DON’T HAVE TIME TO MANAGE YOUR TRADES?
- Take BTST trades at 3:25 pm every day
- Try to exit by taking 4-7% profit of each trade
- SL can also be maintained as closing below the low of the breakout candle
Now, why do I prefer BTST over swing trades? The primary reason is that I have observed t
DIVISLAB : This Is Why Pattern Reading MattersThis is a hidden Inverse Head & Shoulders (IHNS) pattern forming near structure.
Price has already respected the neckline and higher lows are visible.
Such patterns usually appear before the crowd notices.
This is an early sign of strength, not a breakout chase.
Read the chart carefully — structur
BSE: Short-Term Consolidation Breakout Confirmed!Technical Analysis:
BSE has been trading within a defined range for an extended period, and the chart now indicates a clear short-term breakout, suggesting a shift in momentum.
Key Highlights:
• Breakout Zone: The price has started sustaining above the 2,800–2,850 consolidation zone, highlighted in
JSW STEEL - Cup and Handle - Daily The price formed a rounded bottom from November to early January, which is the cup. This shows gradual accumulation and exhaustion of selling pressure rather than panic selling.
After reaching the previous resistance zone near 1,240–1,250, the stock moved into a short, shallow pullback, forming the
Titan 1H: Wave (iv) Pullback Before One More Push?Titan appears to have completed a strong impulsive move into wave (iii), followed by early signs of a corrective pullback. The recent decline looks corrective so far, suggesting wave (iv) may be unfolding.
The ideal retracement zone lies between ₹4,193–₹4,135 (0.382–0.5 Fibonacci zone) . If price
See all stocks ideas
Today
PURVAPuravankara Limited
Actual
—
Estimate
—
Today
UFLEXUFlex Limited
Actual
—
Estimate
—
Today
HCCHindustan Construction Co. Ltd.
Actual
—
Estimate
—
Today
SENCOSenco Gold Limited
Actual
—
Estimate
7.30
INR
Today
TVSSRICHAKTVS Srichakra Limited
Actual
—
Estimate
—
Today
COHANCECohance Lifesciences Ltd
Actual
—
Estimate
2.69
INR
Today
CHEMCONChemcon Speciality Chemicals Ltd
Actual
—
Estimate
—
Today
HONASAHonasa Consumer Limited
Actual
—
Estimate
1.22
INR
See more events
Community trends
BTC 1H🧠 Market Context
Bitcoin has just completed a liquidity sweep after an extended move, tapping into a high-timeframe supply/demand reaction zone. Price action is currently compressing, signaling that we’re approaching a decision point where momentum traders and HTF participants collide.
The recent
$ETH has officially lost the 2000–2020 base CRYPTOCAP:ETH has officially lost the 2000–2020 base we highlighted on the 1H chart.
Triple-top rejection (Top 1 → Top 2 → Top 3) played out perfectly — buyers failed at the 2140–2160 supply zone, and breakdown followed.
📍 First reaction target (1980–1950) ✅ Hit
That’s roughly a 2.6–3% move from
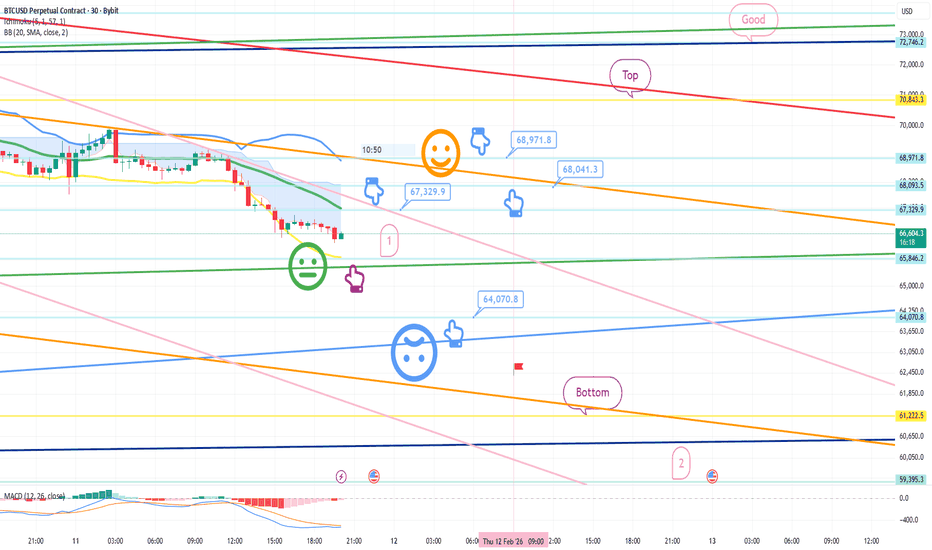
Bitcoin Bybit chart analysis FEBURARY 11Hello
It's a Bitcoin Guide.
If you "follow"
You can receive real-time movement paths and comment notifications on major sections.
If my analysis was helpful,
Please click the booster button at the bottom.
This is Bitcoin's 30-minute chart.
The Nasdaq indicators will be released shortly at 10:30
XAUUSD GOLD Analysis on (11 Feb 2026)#XAUUSD UPDATEDE
Current price - 5054
If price stay above 5015,then next target 5080 and 5110 and below that 4970
Plan1;If price break 5040-5050 area,and stay above 5050 we will placed buy order in gold with target of 5080 and 5110 & stop loss should be placed at 5115
BTCUSDT.P – Elliott Wave AnalysisSHORT-TERM TRADE PLAN AS PER ELLIOTT WAVE ANALYSIS:
💰 Current Price: ~67230
🔻 Scenario 1 (Downside):
- 🛒 Buying interest may emerge at Intermediate Wave 2/B Support Zone → 62127 – 63890
- 📉 If deeper correction → Major Wave C Support Zone → 48412 – 53325
🔺 Scenario 2 (Upside):
- ⚠️ Selling p
Analysis BTCUSD (1H Chart): Analysis BTCUSD (1H Chart):
- Prices have breached the bearish flag pattern on the downside, confirming weakness in the structure.
- Although the prices are testing iFVG (strong support) and the market has entered the oversold zone, which may trigger a minor pullback, the broader trend remains b
See all crypto ideas
Gold Price Update: Trendline Breakout with Clear Risk DefindGold has broken above the falling trendline, and this move is important not because of one candle, but because of the change in structure. After a prolonged corrective phase, price is now holding above the breakout level, which signals that buyers are starting to step in.
What I like about this set
XAUUSD Price View with Supply, Demand and Risk ZonesGold price action shows a controlled recovery after a strong bearish move. Earlier, price found solid buying support in the demand zone around 4,650–4,700, where selling pressure reduced and the market stabilised. This zone remains an important support and a key area to watch if price moves lower ag
We’re looking at Gold vs USD on the 1-hour chartPrice recently completed a deep pullback after a strong bullish leg.
That pullback formed a rounded / cyclical bottom (purple curve), which often signals trend continuation, not reversal.
🧠 Structure & Price Action
What stands out:
Higher low formed after the sell-off → bullish market structure
Pullback Into Resistance, Sell-the-Rally Setup
Market Structure
Overall structure is bearish-to-range after a strong selloff.
Price made a rounded bottom from the Feb lows, then transitioned into a corrective rally.
The rally is retracing into a prior supply / resistance zone, not breaking structure yet.
Key Zones
Major Resistance / Supply
XAUUSD/GOLD 1H BUY PROJECTION 10.02.26First, look at the market structure.
We can clearly see a Head and Shoulders pattern forming on the one-hour timeframe.
This is the left shoulder,
this is the head,
and now price is forming the right shoulder.
At the same time, the market has printed an Evening Star candlestick pattern near the to
XAGUSD - Parallel ChannelThe price of silver has already borken out from this parallel channel that it was trading inside for the past few days. If the Bullish momentum continues, expect to have quick pullback to approx $74-$75 before continuing the next leg up. Also the RSI has now returned to neutral territoriy, which wou
Gold Trading Strategy for 10th February 2026📊 Intraday Trading Plan – Breakout Strategy (1-Hour Candle)
This strategy is based on 1-hour candle confirmation. Trades should be taken only after candle close, not during formation.
🔼 BUY SETUP (Bullish Breakout)
🟢 Condition:
Buy ABOVE the HIGH of the 1-hour candle
Candle must close above 510
XAGUSD 1H Bearish Trendline Rejection📉 Market Structure
Primary trend: Bearish
Price is making lower highs & lower lows
Clear descending channel visible
The recent rally looks like a corrective pullback, not a trend reversal
🔴 Key Rejection Zone
Resistance: 83.50 – 84.20
Price has been rejected exactly at the descending tr
See all futures ideas
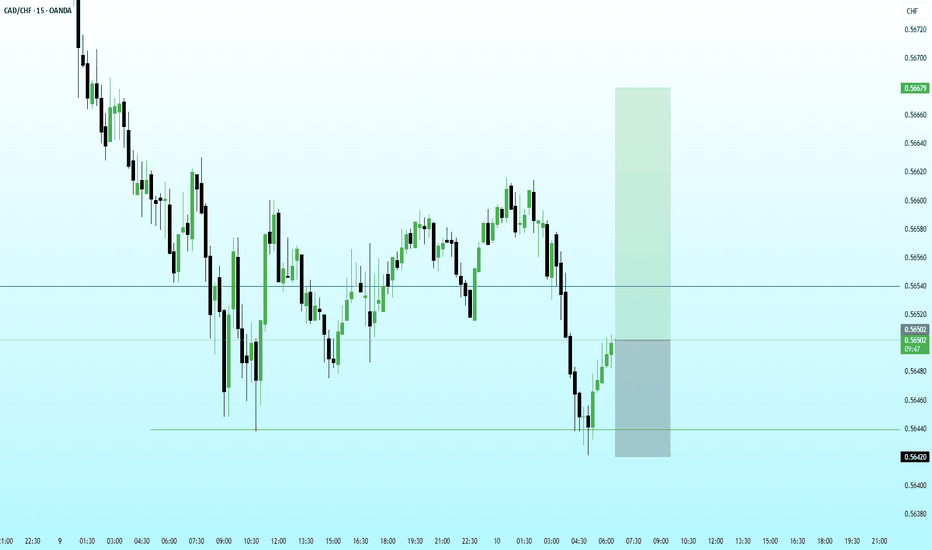
CADCHF-M15CAD/CHF has delivered a textbook sell-side liquidity raid beneath the Asian range, purging weak longs before staging an aggressive displacement higher. The reaction from the discount array suggests deliberate smart money activity, with price repricing toward equilibrium after leaving a clear imbalan
EURUSD Weekly Outlook (SMC + HTF Resistance Confluence)📊 Market Structure Overview
EURUSD is currently trading into a major weekly supply / resistance zone while respecting a long-term descending trendline connecting multiple swing highs. Price has approached this area several times historically and reacted with strong bearish momentum — making it a hi
Usdjpy expecting Buyside delivery Price clean up the current Feb monthly liquidity, and reached at Major price from where the buyside delivery begins, expecting some reactions from here ....
Incase if it fails to give reaction then I will be looking later once it came back to structure again at same zone area !! I will only execute
GBPUSD Analysis on (11 Feb 2026)GBPUSD UPDATEDE
Current price - 1.36450
If price stay above 1.36150,then next target 1.36800 and 1.37000 and below that 1.36000
Plan; if price break 1.36400-1.36450 area and above that 1.36450 area,we will place buy oder in GBPUSD with target of 1.36800 and 1.37000 & stop loss should be placed at
AUDJPY Hourly 1:4 RRAs AUDJPY is in Uptrend
my idea to trade is mentioned in Chart
entry point OB rest at equilibrium of Dealing range
i will only enter after conformation of lower time frame (Upside Choch) in either one or five minutes
if it played well will get 1:4 RR Trade
#Forex #AUDJPY #FXtrade
See all forex ideas
Trade directly on Supercharts through our supported, fully-verified, and user-reviewed brokers.


