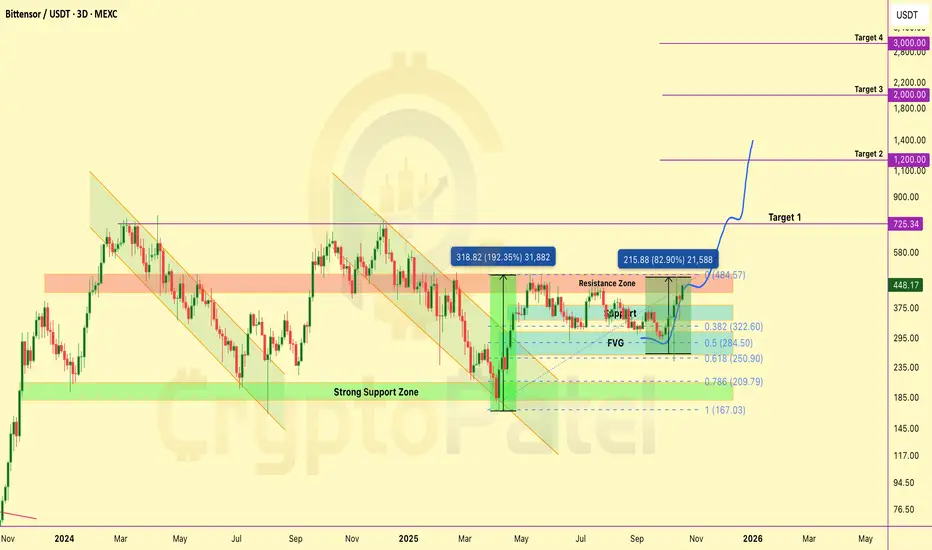
$TAO: +80% IN 14 DAYS - INSTITUTIONAL ACCUMULATION PLAYGETTEX:TAO : +80% IN 14 DAYS - INSTITUTIONAL ACCUMULATION PLAY
Performance Update:
Entry execution: +80% unrealized gains
Institutional bid confirmed (Grayscale allocation)
Position Framework:
Entry Zones:
Primary: $180-$200 ✅
Secondary: $250-$300 ✅
Profit Targets: → $750 → $1,200 → $2,000 (6.6x →

The best trades require research, then commitment.
Get started for free$0 forever, no credit card needed

Scott "Kidd" PoteetThe unlikely astronaut

Where the world does markets
Join 100 million traders and investors taking the future into their own hands.
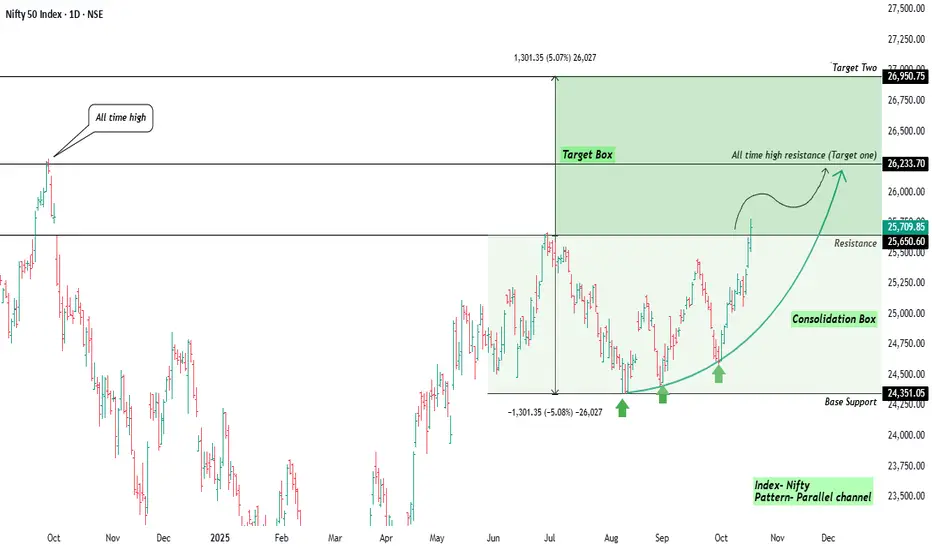
Nifty From Consolidation to Momentum🪔Wishing everyone in the TradingView community a prosperous and bright Diwali 🎇
May this festival bring you clarity like a clean chart, and profits that trend higher with discipline and peace of mind.
Description / Post Body (Technical Analysis View)-:
After a few months of sideways movement, Nifty
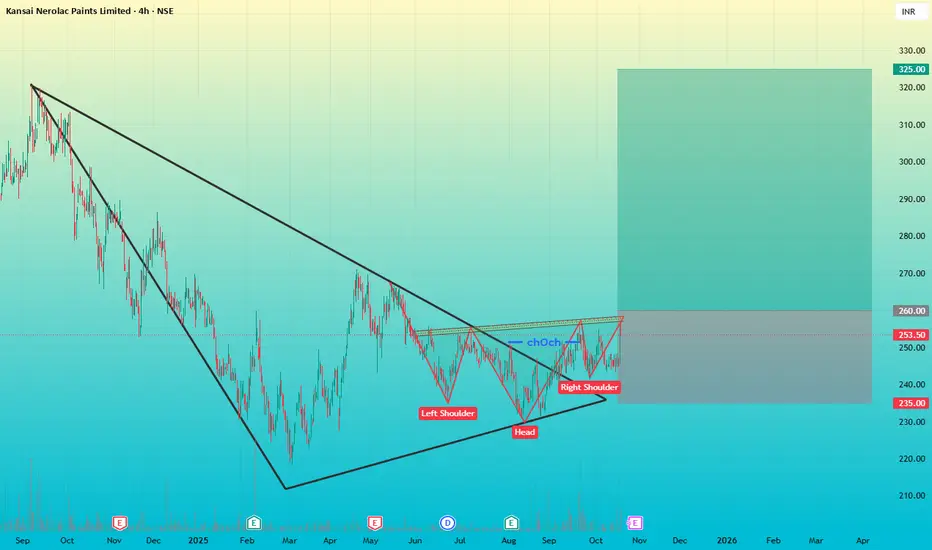
Kansai Nerolac – Triangle + Inverse H&S | Bullish Move loadingKansai Nerolac Paints – Symmetrical Triangle + Inverse Head & Shoulders Breakout Setup
Timeframe: 4H
Trend: Bullish Reversal in Progress
Price has been consolidating for months within a symmetrical triangle structure.
Inside the triangle, an Inverse Head & Shoulders pattern has formed — a classic
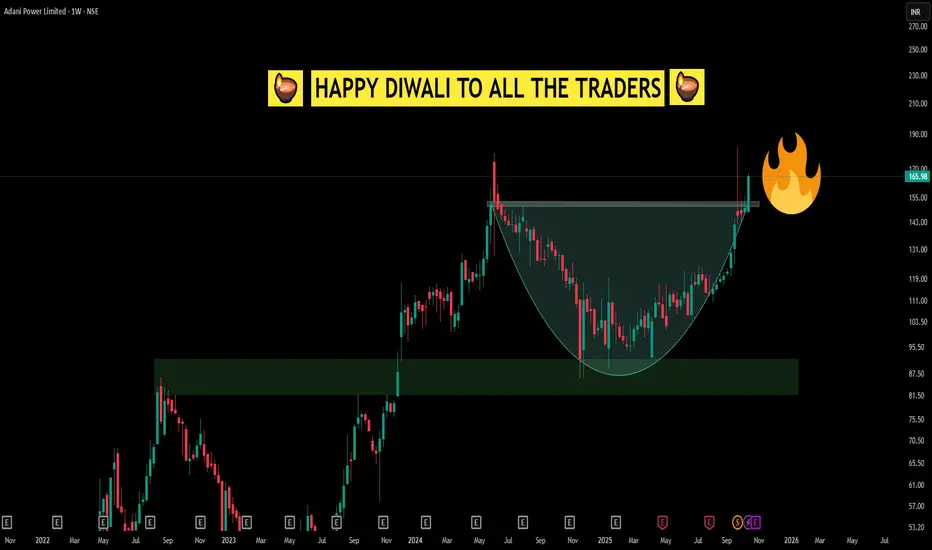
Simple CUP Pattern looking like a Diwali Diya Happy Diwali to All Traders!
This Diwali, the chart tells a special story—a classic cup breakout, but look closely and you'll notice it also resembles a beautifully lit diya. Just like Diwali celebrates the light conquering darkness, this breakout is a reminder of the power of patience, conviction,
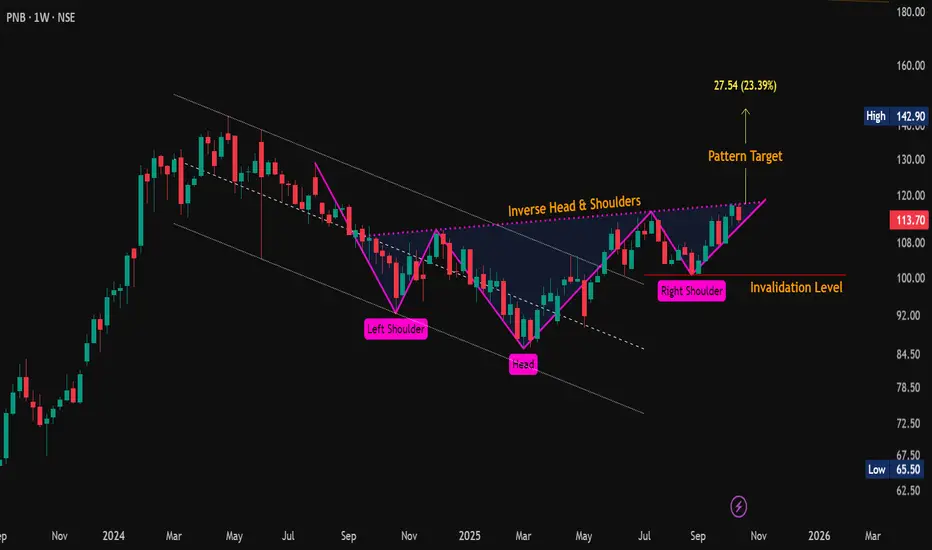
#PNB | Inverse Head & Shoulders Bullish SetupCMP: 113.70
🔼 Key Resistance Levels: 118 / 120 / 143
🔽 Key Support Levels: 113.30 - 110.50 / 107.30
❌ Invalidation Level: 100.60 (Weekly Close Below)
✴️ Breakout Point: Weekly close above the neckline (Pink dotted line) 👀
🎯 Pattern Target: 145 (+27% from CMP)
#PNB | #InverseHeadAndShou
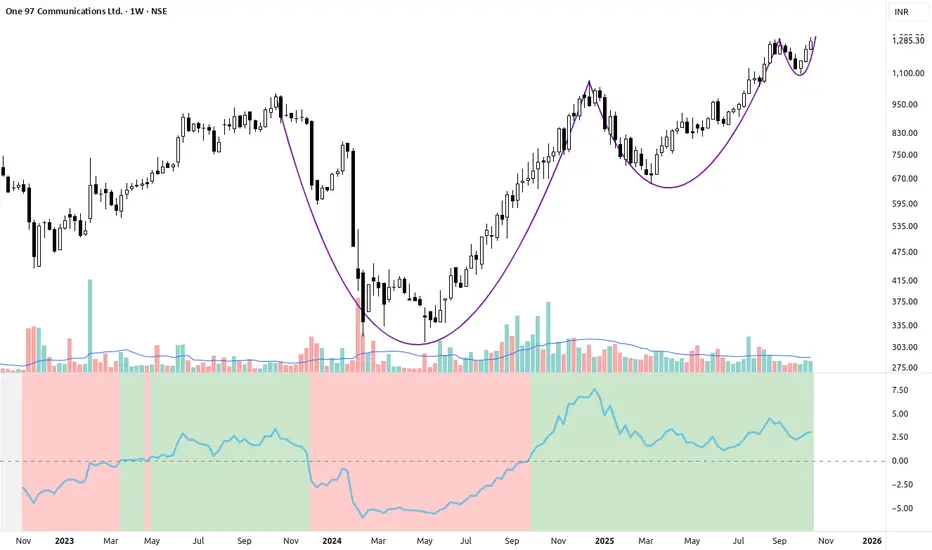
PAYTM (ONE97) - Power Consolidation at 52-Week HighsThe Setup: Major Base Breakout in Progress
ONE97 has transformed from a long-term downtrend into a powerful uptrend. The chart shows a massive multi-year base (a large rounded bottom) that is now being successfully broken out of. This transition signals a potential paradigm shift in the stock's lon
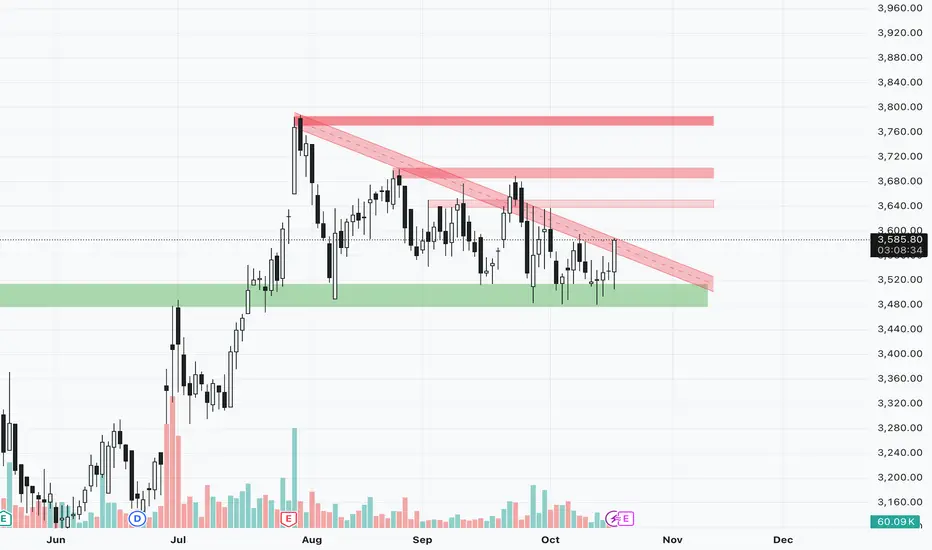
Torrent Pharma Long Swing CandidateChart Analysis :
Price making a flat decending triangle pattern while holding a major weekly support of 3500 levels and looking to breakout above the trendline resistance zone and can be considered for long. One can enter here or wait for 3600 above daily close or one hour sustain above 3600.
Ke
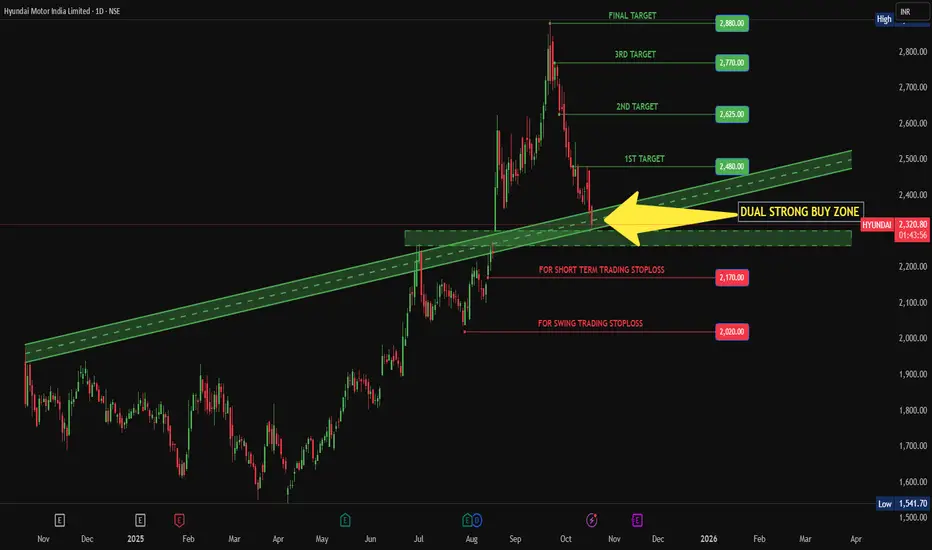
HYUNDAI IN STRONG BUY ZONEHyundai Motors India reach at dual strong buy zone area to consider as a long trade, use your skill as well knowledge to enter in a trade not guaranteed return. Do your own research than make a trade. But technically and fundamentally Hyundai is in good spot to consider as a long trade.
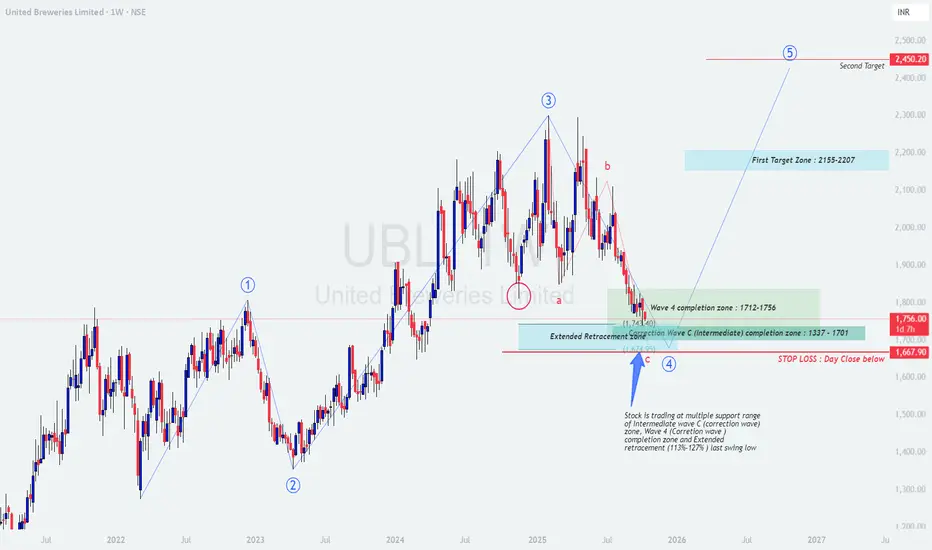
UBL (United Breweries) – Weekly Swing Trading PlanUBL (United Breweries) – Weekly Swing Trading Plan (Educational)
Structure overview
Price has completed a multi‑month corrective leg into a confluence support cluster: Wave‑4 completion zone 1712–1756 overlaps with the projected Wave‑C (intermediate) completion band 1701–1337 and the extended retr
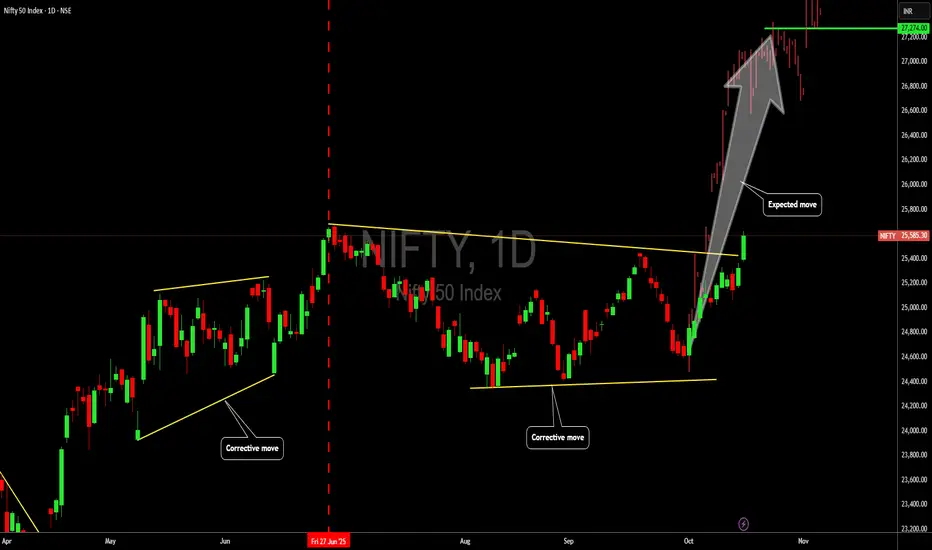
Bulls coming in on the Nifty50 indexHello,
Since June 27th, 2025, the Nifty 50 index has been undergoing a correction phase, reflecting a temporary pause in the market's strong upward trend. Recent market data, however, indicates that this corrective phase is likely behind us, paving the way for renewed bullish momentum. This develop
See all editors' picks ideas
Dynamic Equity Allocation Model"Cash is Trash"? Not Always. Here's Why Science Beats Guesswork.
Every retail trader knows the frustration: you draw support and resistance lines, you spot patterns, you follow market gurus on social media—and still, when the next bear market hits, your portfolio bleeds red. Meanwhile, institution

First Passage Time - Distribution AnalysisThe First Passage Time (FPT) Distribution Analysis indicator is a sophisticated probabilistic tool that answers one of the most critical questions in trading: "How long will it take for price to reach my target, and what are the odds of getting there first?"
Unlike traditional technical indicators

PongExperience PONG! The classic arcade game, now on your charts!
With this indicator, you can finally achieve your lifelong dream of beating the Markets. . . at PONG!
Pong is jam-packed with features! Such as:
2 Paddles
A moving dot
Floating numbers
The idea of a net
This indicator is solel

Options Max Pain Calculator [BackQuant]Options Max Pain Calculator
A visualization tool that models option expiry dynamics by calculating "max pain" levels, displaying synthetic open interest curves, gamma exposure profiles, and pin-risk zones to help identify where market makers have the least payout exposure.
What is Max Pain?
Max

Volume Profile 3D (Zeiierman)█ Overview
Volume Profile 3D (Zeiierman) is a next-generation volume profile that renders market participation as a 3D-style profile directly on your chart. Instead of flat histograms, you get a depth-aware profile with parallax, gradient transparency, and bull/bear separation, so you can see w

RiskMetrics█ OVERVIEW
This library is a tool for Pine programmers that provides functions for calculating risk-adjusted performance metrics on periodic price returns. The calculations used by this library's functions closely mirror those the Broker Emulator uses to calculate strategy performance metrics (

Simple Decesion Matrix Classification Algorithm [SS]Hello everyone,
It has been a while since I posted an indicator, so thought I would share this project I did for fun.
This indicator is an attempt to develop a pseudo Random Forest classification decision matrix model for Pinescript.
This is not a full, robust Random Forest model by any stretch o

Tick CVD [Kioseff Trading]Hello!
This script "Tick CVD" employs live tick data to calculate CVD and volume delta! No tick chart required.
Features
Live price ticks are recorded
CVD calculated using live ticks
Delta calculated using live ticks
Tick-based HMA, WMA, EMA, or SMA for CVD and price
Key tick levels (S

analytics_tablesLibrary "analytics_tables"
📝 Description
This library provides the implementation of several performance-related statistics and metrics, presented in the form of tables.
The metrics shown in the afforementioned tables where developed during the past years of my in-depth analalysis of various str

Adaptive Trend Classification: Moving Averages [InvestorUnknown]Adaptive Trend Classification: Moving Averages
Overview
The Adaptive Trend Classification (ATC) Moving Averages indicator is a robust and adaptable investing tool designed to provide dynamic signals based on various types of moving averages and their lengths. This indicator incorporates multipl

See all indicators and strategies
Community trends
Simple CUP Pattern looking like a Diwali Diya Happy Diwali to All Traders!
This Diwali, the chart tells a special story—a classic cup breakout, but look closely and you'll notice it also resembles a beautifully lit diya. Just like Diwali celebrates the light conquering darkness, this breakout is a reminder of the power of patience, conviction,
Kansai Nerolac – Triangle + Inverse H&S | Bullish Move loadingKansai Nerolac Paints – Symmetrical Triangle + Inverse Head & Shoulders Breakout Setup
Timeframe: 4H
Trend: Bullish Reversal in Progress
Price has been consolidating for months within a symmetrical triangle structure.
Inside the triangle, an Inverse Head & Shoulders pattern has formed — a classic
Stallion India Fluorochemicals Ltd - Breakout Setup, Move is ON#STALLION trading above Resistance of 312
Next Resistance is at 524
Support is at 204
Here are previous charts:
Chart is self explanatory. Levels of breakout, possible up-moves (where stock may find resistances) and support (close below which, setup will be invalidated) are clearly defined

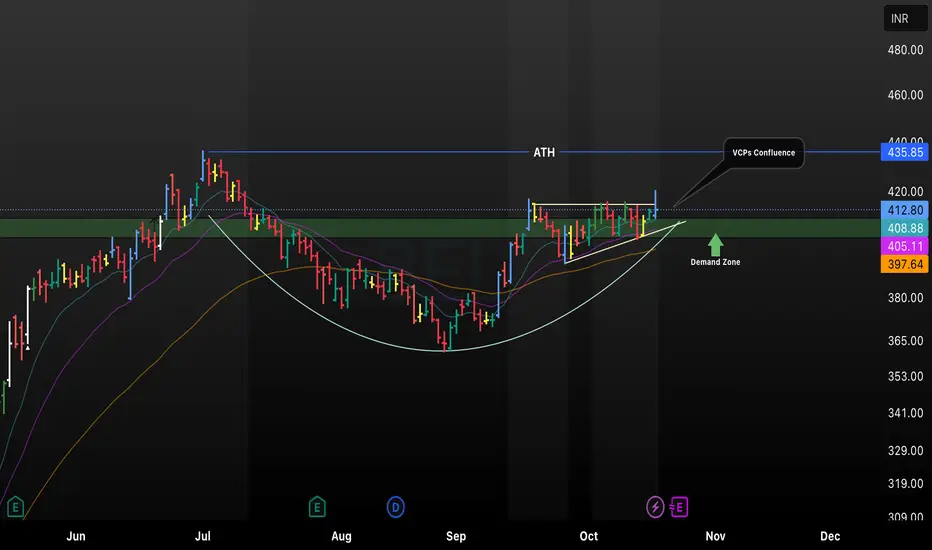
BEL Breakout Setup: Cup & Handle Pattern with VCP ConfluenceThis chart highlights a bullish setup in BEL, where a classic cup and handle pattern forms alongside a visible Volatility Contraction Pattern (VCP) near the all-time high (ATH) resistance at 435.85. The stock is consolidating above the demand zone, supported by rising moving averages and a clean bas
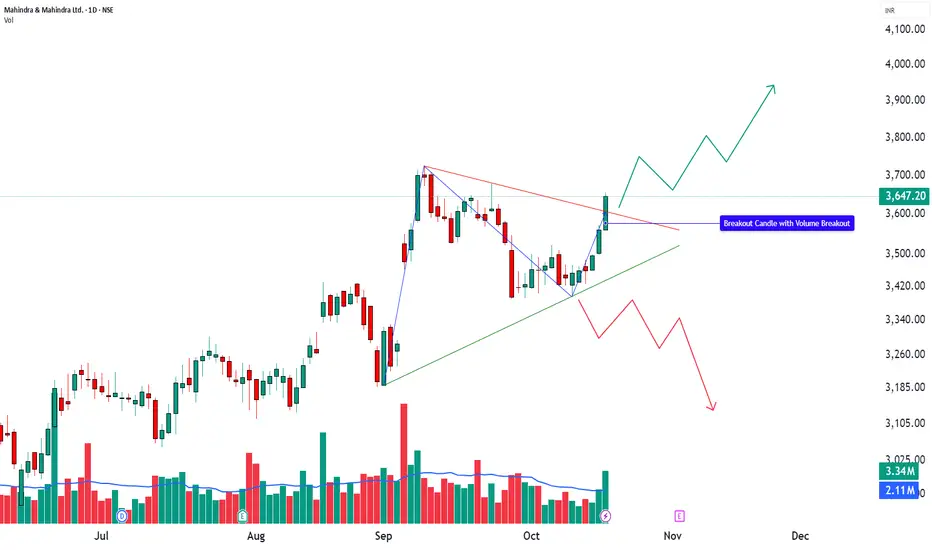
M&M Breaks Out with Volume Support | Structure Meets Momentum________________________________________
🚙 MAHINDRA & MAHINDRA LTD (NSE: M&M) | CMP ₹3,647.20 (+2.43%)
Sector: Auto | Date: 19 Oct 2025
________________________________________
🔹 Price Action:
M&M posted a strong bullish candle, closing near day’s high at ₹3,647.20 with gains of +2.43%.
Volume surge
BUY TODAY SELL TOMORROW for 5%2 days ago
DON’T HAVE TIME TO MANAGE YOUR TRADES?
- Take BTST trades at 3:25 pm every day
- Try to exit by taking 4-7% profit of each trade
- SL can also be maintained as closing below the low of the breakout candle
Now, why do I prefer BTST over swing trades? The primary reason is that I have obs

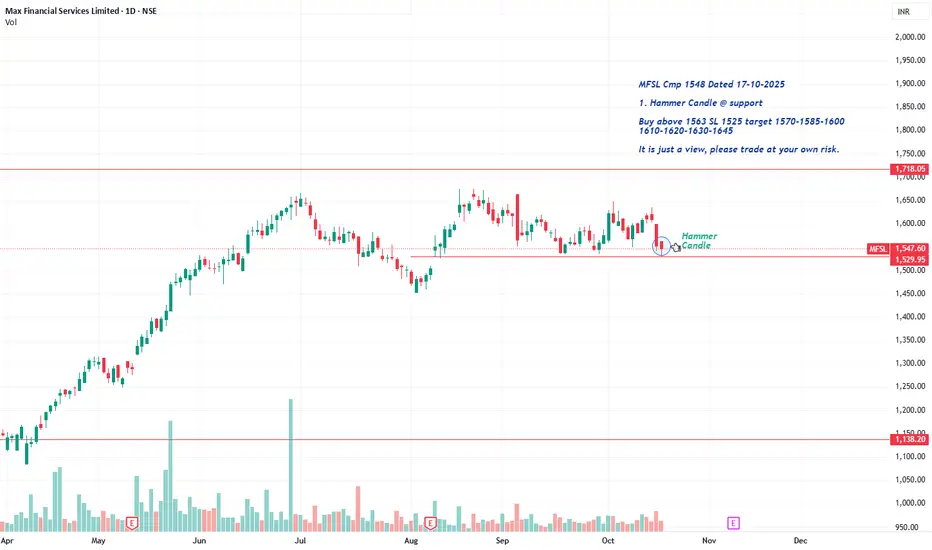
MFSL Cmp 1548 Hammer @ SupportMFSL Cmp 1548 Dated 17-10-2025
1. Hammer Candle @ support
Buy above 1563 SL 1525 target 1570-1585-1600-1610-1620-1630-1645
It is just a view, please trade at your own risk.
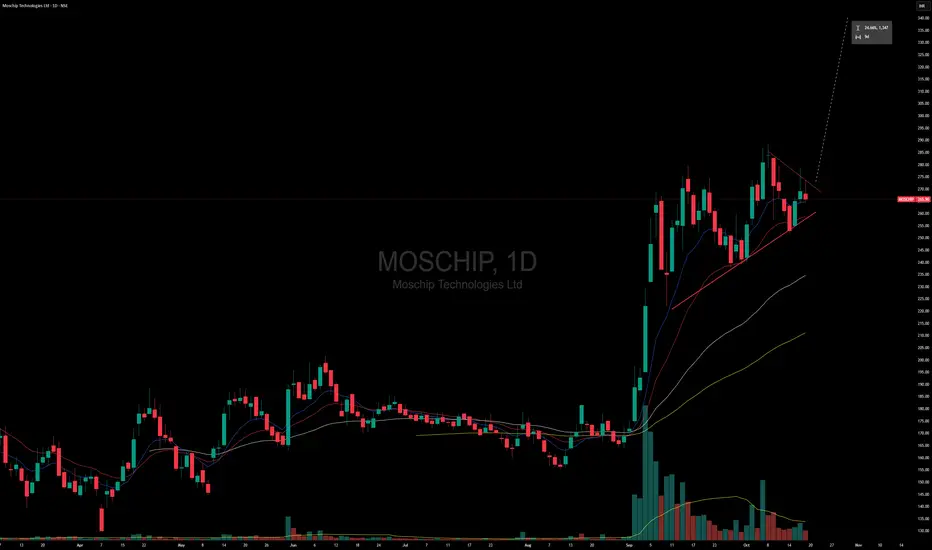
Another Move , Kaboom I am looking another Explosive Move in it
Yes its based on Pattern trading , There is No indicator or Theory behind just pure patterns
This is education content
Good luck
BOSCHLTD - DOUBLE BOTTOM CHART PATTERN BREAKOUT [ BUY SIDE ]More technical indicator data is available in the YouTube video.
If you like the idea, please follow me and don’t forget to like, share, and subscribe to my YouTube channel.

See all stocks ideas
Today
YESBANKYes Bank Limited
Actual
0.21
INR
Estimate
0.21
INR
Today
TRIDENTTrident Limited
Actual
—
Estimate
—
Today
KRSNAAKrsnaa Diagnostics Limited
Actual
—
Estimate
7.53
INR
Today
DBOLDhampur Bio Organics Ltd
Actual
—
Estimate
—
Today
HATSUNHatsun Agro Product Limited
Actual
—
Estimate
—
Today
STYLAMINDStylam Industries Limited
Actual
—
Estimate
22.10
INR
Today
TATACONSUMTata Consumer Products Limited
Actual
—
Estimate
3.69
INR
Today
SSWLSteel Strips Wheels Ltd
Actual
—
Estimate
—
See more events
Community trends
$TAO: +80% IN 14 DAYS - INSTITUTIONAL ACCUMULATION PLAYGETTEX:TAO : +80% IN 14 DAYS - INSTITUTIONAL ACCUMULATION PLAY
Performance Update:
Entry execution: +80% unrealized gains
Institutional bid confirmed (Grayscale allocation)
Position Framework:
Entry Zones:
Primary: $180-$200 ✅
Secondary: $250-$300 ✅
Profit Targets: → $750 → $1,200 → $2,000 (6.6x →
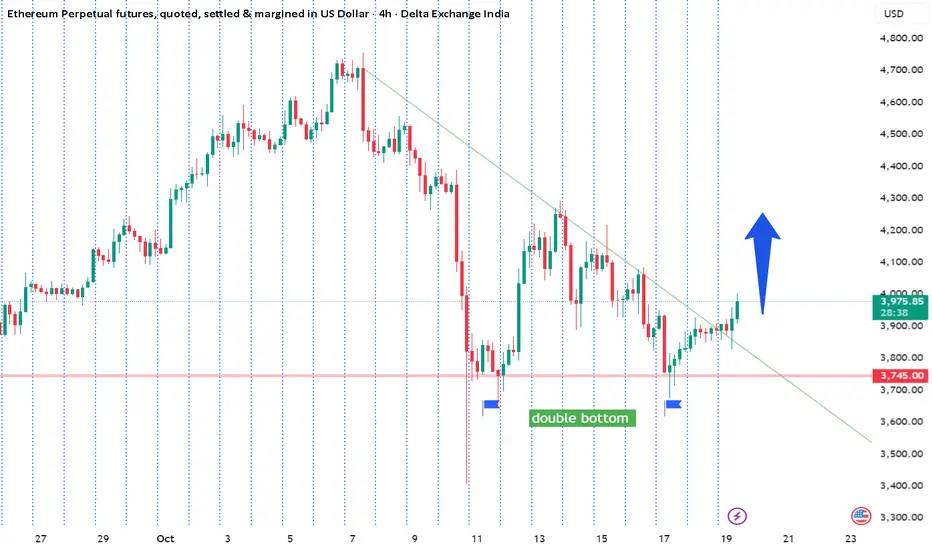
Key Insights on Ethereum's 4-Hour ChartAs of October 19, 2025, Ethereum (ETH) is trading around $3,900, reflecting a period of consolidation after recent volatility, with analysis suggesting a balanced but potentially bullish setup if key resistances are broken.
The 4-hour chart shows a descending wedge pattern, which often signals a rev
BTCUSD SHOWING A GOOD UP MOVE WITH 1:10 RISK REWARD BTCUSD SHOWING A GOOD
UP MOVE WITH 1:10 RISK REWARD
DUE TO THESE REASON
A. its following a rectangle pattern that stocked the market
which preventing the market to move any one direction now it trying to break the strong resistant lable
B. after the break of this rectangle it will boost the mark

Market Analysis: BTCBITSTAMP:BTCUSD $CRYPTO:BTCUSD+BITSTAMP:BTCUSD+BINANCE:BTCUSDT+BINANCE:BTCUSD+OANDA:BTCUSD+BYBIT:BTCUSDT+VANTAGE:BTCUSD+OKX:BTCUSD+KRAKEN:BTCUSD+BITFINEX:BTCUSD+FOREXCOM:BTCUSD+CAPITALCOM:BTCUSD+ICMARKETS:BTCUSD+BINANCE:BTCUSDC+EASYMARKETS:BTCUSD+MEXC:BTCUSDT+BLACKBULL:BTCUSD+EIGHTCAP:BTCUSD+FX:BTC

ETHUSD (Ethereum / U.S. Dollar) on the 1-hour timeframe...ETHUSD (Ethereum / U.S. Dollar) on the 1-hour timeframe, here’s what stands out technically:
---
🧭 Chart Overview
The price has broken above a descending trendline, which is a bullish breakout signal.
The breakout is supported by Ichimoku confirmation — price is trading above the cloud, and the

BTC AT MAJOR RESISTANCEBTC is consolidating between 107500 and 106400 . something is really cooking . As we could see BTC is consolidating below 50ema , which indicates a bearish trend . But we could also see a probability of bullishness .
Based on our previous entries we are still holding the levels in XRP & ETH .

Why I am bullish on $STRK?@Starknet is one of the most asymmetric opportunities in crypto right now.
👉 Real Technology and a Proven Team
Starknet is not a hype project. It is a Layer 2 network built on Ethereum using zk-STARKs, one of the most advanced and scalable cryptographic proof systems ever developed. This technolog

Bitcoin in Buy Zone – Expecting a Short-Term RallyBTC/USDT is currently holding above the support zone around 106,300, forming higher lows on the 15-minute chart.
I’ve entered a long position near 106,600–106,800, targeting the 108,590 level for a potential 1.9% upside move.

[SeoVereign] ETHEREUM BEARISH Outlook – October 18, 2025Today, as of October 18, I would like to share my bearish outlook on Ethereum.
This analysis is based on two main factors.
First — Bearish Bat Pattern
Currently, Ethereum is approaching the PRZ (Potential Reversal Zone) of the Bat pattern.
This area is generally interpreted as a zone where buying

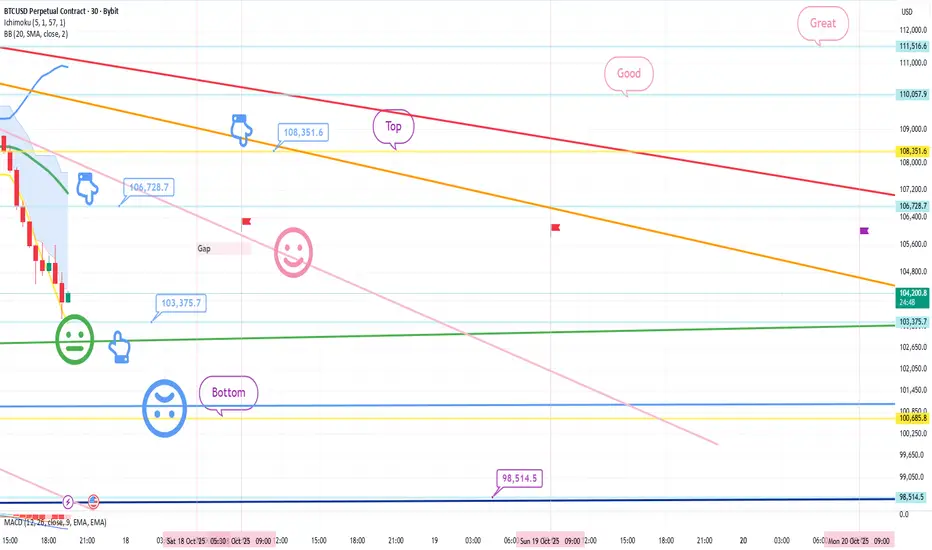
Bitcoin Bybit chart analysis October 17Hello
It's a Bitcoin Guide.
If you "follow"
You can receive real-time movement paths and comment notifications on major sections.
If my analysis was helpful,
Please click the booster button at the bottom.
This is Bitcoin's 30-minute chart.
There are no Nasdaq data releases today.
Bit has been
See all crypto ideas
XAGUSD (Silver vs USD) on the 1-hour timeframeXAGUSD (Silver vs USD) on the 1-hour timeframe, here’s what can be inferred:
The price has clearly broken below the ascending trendline.
It also broke down through the Ichimoku cloud, confirming a bearish signal.
There’s a sharp rejection candle followed by continuation below previous structure s

GOLD 1H Analysis for 20th October 2025 MondayThe 1H trend has shifted to bearish. The current price is above the 1H QML and has retested the 1H SBR zone.
The price is currently positioned in two areas: 1) Supply Zone and 2) Double Top.
The outcome of the market will be determined on Monday.

XAUUSD/GOLD WEEKLY SELL PROJECTION 19.10.25(XAUUSD/GOLD 4H Weekly Sell Projection — 19.10.25):
🟡 Chart Overview
Instrument: XAUUSD (Gold/USD)
Timeframe: 4H (4-hour)
Projection: Bearish/Sell
Pattern Date: 19 October 2025
📊 Key Technical Structure
Trend Channel:
The price has been moving in an upward trend channel.
It reached the uppe

Gold Retracement After 200-Point Fall — Watch for a Rejection!Price Action in Focus | Short Setup on Key Resistance Zone
Gold (XAUUSD) posted a sharp 200-point drop from the all-time high at 4380 on Friday. The current move looks like a technical retracement, not a reversal — a classic dead-cat bounce scenario? 🐈📉
📍 Key Resistance Zone: 4280 – 4300
Price is

4,200 or 4,285? Gold’s Next Move Decides It All📊 Market Overview
Gold remains under pressure at the start of the week, trading below last week’s record highs, after a sharp correction from the 4,380s down to the 4,240 zone.
Investor sentiment is cautious as the market navigates a mix of uncertain U.S. economic data, a still-closed U.S. governm

Hold ur horses!!!!!!# NIFTY Futures Technical Analysis
## Market Structure: Breakout → Channel → Consolidation
The classic three-phase pattern has unfolded:
### Phase 1: Breakout (April 7th)
- Strong breakout initiated the current bull move
- Established new higher ground
### Phase 2: Channel Formation
- Price ente

XAG/USD Technical Analysis (as of October 19, 2025)Current Market Snapshot
The spot price of silver (XAG/USD) stands at 51.91430 USD per ounce, reflecting a sharp decline of -2.3663 (-4.36%) from the previous close of 54.24 in daily time frame. This pullback follows recent record highs near 54.48, driven by safe-haven demand amid geopolitical tensi

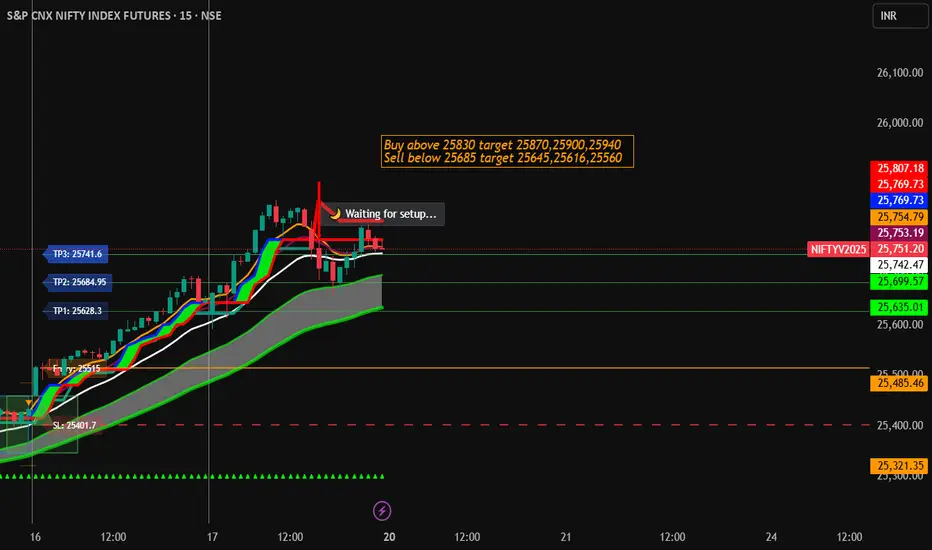
Nifty Futures Trading Strategy for 20th October 2025📊 NIFTY FUTURES INTRADAY TRADING PLAN 📊
🟢 BUY SETUP
📈 Buy Above: High of the 15-Minute Candle after a confirmed close above ₹25,830
🎯 Target Levels:
1️⃣ ₹25,870
2️⃣ ₹25,900
3️⃣ ₹25,940
🛑 Stop Loss: Below the low of the entry candle
📊 Wait for the 15-minute candle to close above ₹25,830 before ente
XAU/USD: Channel Breakout → Retest → Downside Target at 3,940Pair: Gold Spot (XAU/USD)
Timeframe: 1-hour
Current Price: 4,253.975
Trend: Recently broke out of an ascending channel (bearish signal)
📉 Chart Breakdown
1. Ascending Channel (Trade Lines)
Price was moving steadily inside a rising channel, indicated by the two parallel yellow “TRADE LINE” level

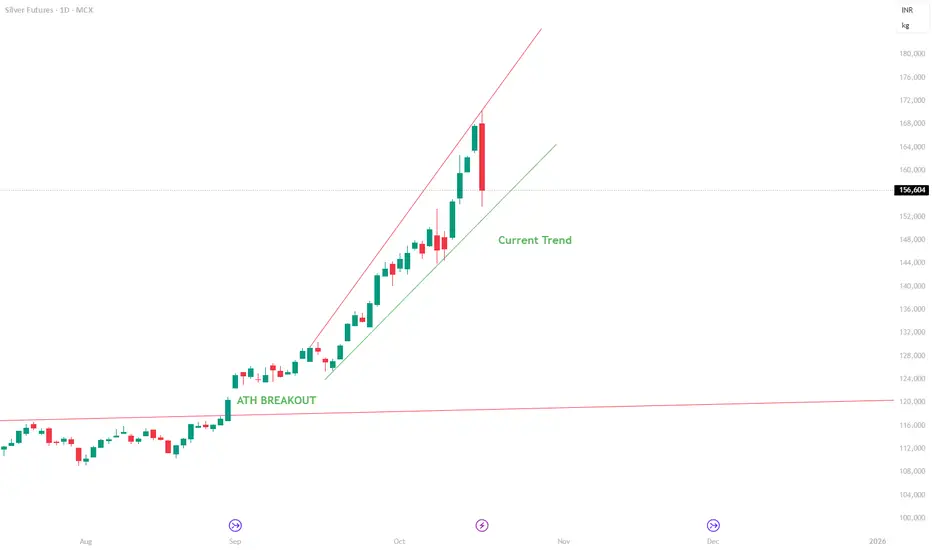
Silver Futures (MCX : SILVER1!)- Educational Analysis📈 Silver Futures (MCX: SILVER1!) – Trend Structure & Pullback Observation
After the ATH Breakout, Silver Futures entered a strong upward channel supported by higher highs and higher lows.
The price recently touched the upper boundary of the rising channel and has now shown a sharp pullback, testing
See all futures ideas
USDCHF Long SetupPrice has formed a session low within the previous weekly low, creating a strong support area. This low also aligns with the Psychological Line, adding confluence and increasing the probability of a bullish reaction.
📊 Confluences:
Session Low inside Previous Weekly Low
Within Psychological Line

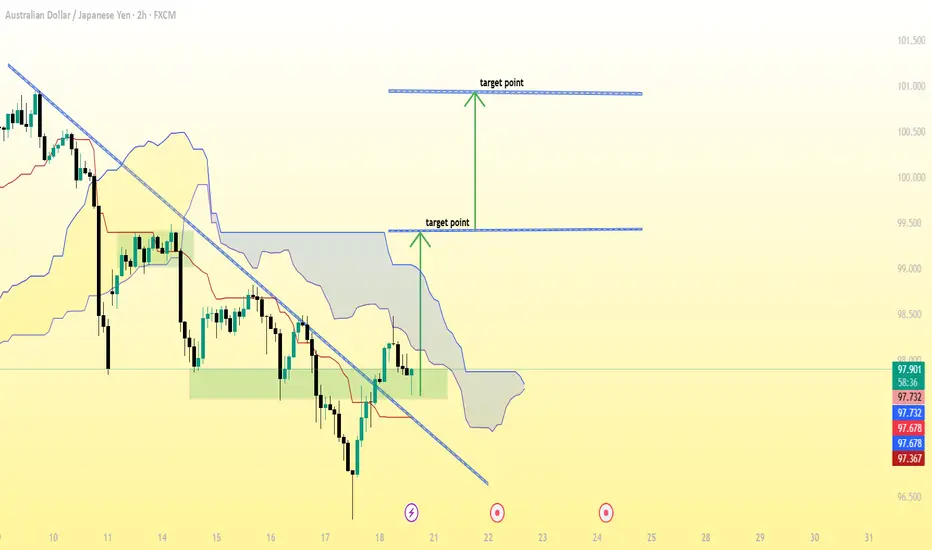
AUD/JPY (2-hour timeframe), here’s a breakdown of what’s visibleAUD/JPY (2-hour timeframe), here’s a breakdown of what’s visible:
The downtrend line has been broken to the upside, suggesting a potential bullish reversal.
The Ichimoku Cloud shows price moving above or attempting to move above the cloud — another bullish signal.
Two target points are already ma
GBPJPY MULTI TIME FRAME ANALYSISHello traders , here is the full multi time frame analysis for this pair, let me know in the comment section below if you have any questions , the entry will be taken only if all rules of the strategies will be satisfied. wait for more price action to develop before taking any position. I suggest yo

I AM FXHUNTER / GBPUSDHello The GBPUSD symbol has the possibility of falling from the specified area by forming a liquidity area near a supply level... Be sure to follow our channel.

EURUSD is in H & S PatternEUR-USD is trading in H & S Pattern in 30Min TF. If it breaks then, it may achieve the Target Supply.

GBPUSD SELL TRADE SETUP GBPUSD – Bearish Setup Loading 📉🔥
📍 Bias: Short
📍 Pair: GBP/USD
🕒 Timeframes: Daily | 4H | LTF (Execution)
🧭 Multi-Timeframe Outlook
GBPUSD is showing clear bearish structure on both the Daily and 4H timeframes, indicating strong downside momentum.
The pair has recently taken liquidity at triple hig

EUR/USD buy-side setupEUR/USD is holding strong near support at 1.1663.
Expecting a bullish move towards 1.1693 as long as price sustains above the buy zone.

Will crude move north?EUR/USD vs crude
Eur/usd and crude have a positive correlation. Here crude is a laggard. In the current scenario if u look at the charts, EUR has been advancing for quite some time while crude is still correcting. Its a clear indication to the sleeping bear that things can change for crude anytim

AUDJPY Sell SetupPrice is retesting the supply zone between 98.20 – 98.45 after a strong bearish fall.
Expecting rejection to push price back toward 96.30 – 96.20 zone.
🎯 Entry: 98.20 – 98.40
🛑 SL: 98.50
✅ TP: 96.30
⚖️ High RR setup | Follow the structure | Patience = Profit

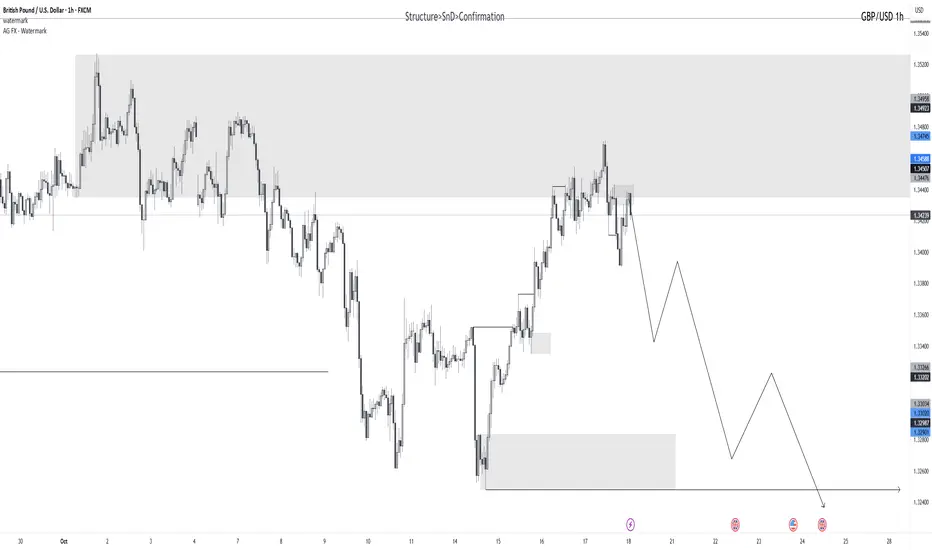
GBPUSD for next week -> 20 OctLooking for `sell` on GBPUSD for next week. Expecting a drop on the basis of supply zone
See all forex ideas
| - | - | - | - | - | - | - | - | ||
| - | - | - | - | - | - | - | - | ||
| - | - | - | - | - | - | - | - | ||
| - | - | - | - | - | - | - | - | ||
| - | - | - | - | - | - | - | - | ||
| - | - | - | - | - | - | - | - | ||
| - | - | - | - | - | - | - | - | ||
| - | - | - | - | - | - | - | - | ||
| - | - | - | - | - | - | - | - |
Trade directly on the supercharts through our supported, fully-verified and user-reviewed brokers.


