H&S pattern Bearish in SBICARDHead & Shoulders pattern finished in SBICARD.
On breakdown of trendline, will target the downside target equal to the range of head (from top of head to neckline)
Targets are mentioned, including key levels in between. Stop is above halfway of the right shoulder

The best trades require research, then commitment.
Get started for free$0 forever, no credit card needed

Scott "Kidd" PoteetThe unlikely astronaut

Where the world does markets
Join 100 million traders and investors taking the future into their own hands.

INFOSYS MY TECHNICAL VIEWS 19-11-25After retest of support, multiple times, price ready to go up.
Nifty It and Infosys charts are almost identical..
Nifty is already in trend. VIX Normal. dollar index below 100. Good delivery. Everything look perfect. Anything missing?
Your views and suggestion are invited.

Bitcoin Turn Bearish In Monthly Time frameWhat’s going on
Bitcoin slipped significantly this week, dropping into the US$90,000–96,000 range, marking roughly a 10% decline for the week.
The decline has pushed BTC to trade around 20-25% below its all-time high of US$126,200.
On-chain data shows that long-term holders (those who typically h

BNB/USDT – Bullish Reversal Idea | Demand Zone Reaction📌 Overview
BNB is currently trading at a major higher-timeframe demand zone, showing early signs of accumulation after a sharp sell-off. Price has tapped the demand area multiple times and is holding without breaking structure to the downside.
This setup is based on a potential short-term reversal

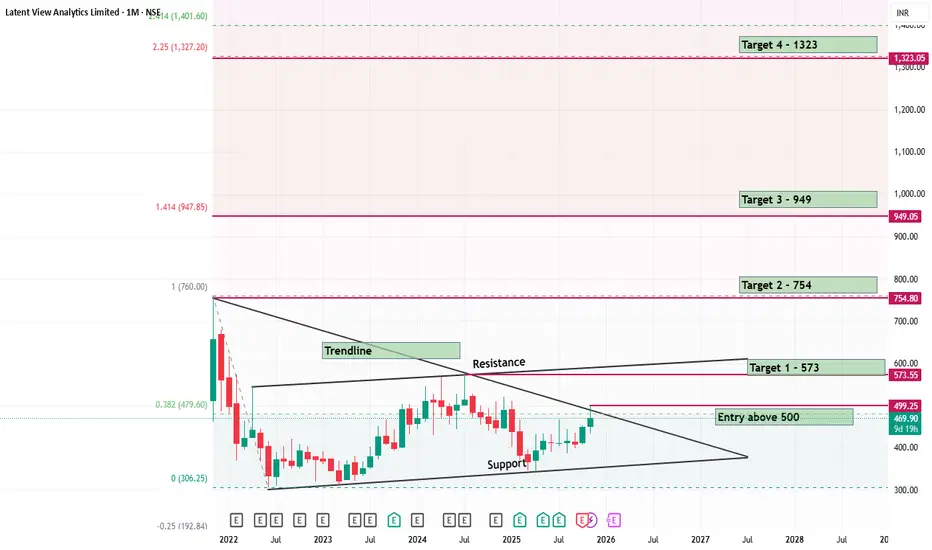
Latent View a Hidden Gem BUY with 2 Years Horizon
BUY LATENT VIEW
BUY ABOVE RS500 AND HOLD FOR 2 YEARS FOR A TARGET OF 1323.
Stock needs to break the upside resistance of Rs 573 with an entry on monthly close above 500.
It will rocket above 754 with is the the all time high.
Plotted the trendline for your understnading.
Below is the companies
BUY TODAY SELL TOMORROW for 5%DON’T HAVE TIME TO MANAGE YOUR TRADES?
- Take BTST trades at 3:25 pm every day
- Try to exit by taking 4-7% profit of each trade
- SL can also be maintained as closing below the low of the breakout candle
Now, why do I prefer BTST over swing trades? The primary reason is that I have observed that

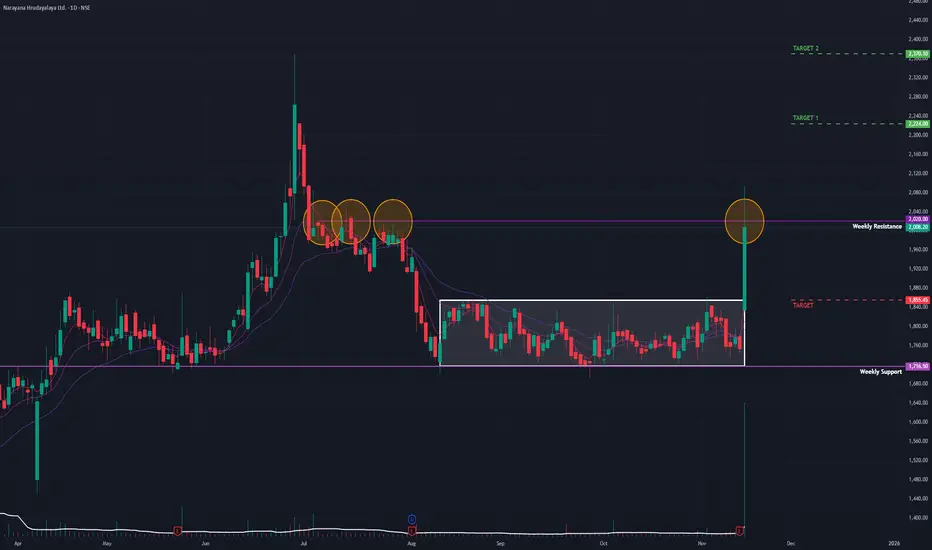
Narayana Hrudayalaya (D): Earnings-Driven BreakoutThe stock has decisively broken out of a 3-month consolidation phase. This technical breakout is powered by a strong fundamental catalyst (Q2 earnings), validating the surge and the high volume.
🚀 1. The Fundamental Catalyst (The "Why")
The breakout is a direct reaction to the company's Q2 FY26
Technical View: Engineers India Ltd (EIL)Pattern Formation
The stock is moving inside a sideways accumulation range between ₹188–₹200.
Multiple swing highs formed in the ₹212–₹220 region created a liquidity pool.
Price repeatedly wicked above these highs, indicating Buy-Side Liquidity Hunt.
Breakout Behaviour
A strong bullish

Money moves the market - Bank NiftyTraders say price moves the market. Bulls or bears move the market etc... But the fact is, money moves the market. You cannot ignore Bank Nifty when analyzing Nifty. When bank sector is supporting, Nifty gives a trending move.
Public sector bank stocks are on the move, while private sector bank stoc

L&T Multiyear BreakoutLarsen & Toubro Limited - Multi-Timeframe Breakout Analysis
Current Price:4,004.40
CRITICAL SETUP ALERT
L&T is at a pivotal moment with breakouts confirmed on weekly and monthly timeframes. The stock is now in a crucial period that will determine the validity of this range breakout.
KEY TECHNICAL

See all editors' picks ideas
Holographic Market Microstructure | AlphaNattHolographic Market Microstructure | AlphaNatt
A multidimensional, holographically-rendered framework designed to expose the invisible forces shaping every candle — liquidity voids, smart money footprints, order flow imbalances, and structural evolution — in real time.
---
📘 Overview
The Hol

PriceFormatLibrary for automatically converting price values to formatted strings
matching the same format that TradingView uses to display open/high/low/close prices on the chart.
█ OVERVIEW
This library is intended for Pine Coders who are authors of scripts that display numbers onto a user's charts. T

LogNormalLibrary "LogNormal"
A collection of functions used to model skewed distributions as log-normal.
Prices are commonly modeled using log-normal distributions (ie. Black-Scholes) because they exhibit multiplicative changes with long tails; skewed exponential growth and high variance. This approach i

Range Oscillator (Zeiierman)█ Overview
Range Oscillator (Zeiierman) is a dynamic market oscillator designed to visualize how far the price is trading relative to its equilibrium range. Instead of relying on traditional overbought/oversold thresholds, it uses adaptive range detection and heatmap coloring to reveal where pri

Volume Surprise [LuxAlgo]The Volume Surprise tool displays the trading volume alongside the expected volume at that time, allowing users to spot unexpected trading activity on the chart easily.
The tool includes an extrapolation of the estimated volume for future periods, allowing forecasting future trading activity.
🔶 U

Smooth Theil-SenI wanted to build a Theil-Sen estimator that could run on more than one bar and produce smoother output than the standard implementation. Theil-Sen regression is a non-parametric method that calculates the median slope between all pairs of points in your dataset, which makes it extremely robust to o

Fair Value Gaps by DGTFair Value Gaps
A refined, multi-timeframe Fair Value Gap (FVG) detection tool that brings institutional imbalance zones to life directly on your chart.
Designed for precision, it visualizes how price delivers into inefficiencies across chart, higher, and lower (intrabar) timeframes — offering a fl

TASC 2025.11 The Points and Line Chart█ OVERVIEW
This script implements the Points and Line Chart described by Mohamed Ashraf Mahfouz and Mohamed Meregy in the November 2025 edition of the TASC Traders' Tips , "Efficient Display of Irregular Time Series”. This novel chart type interprets regular time series chart data to create an ir

Simplified Percentile ClusteringSimplified Percentile Clustering (SPC) is a clustering system for trend regime analysis.
Instead of relying on heavy iterative algorithms such as k-means, SPC takes a deterministic approach: it uses percentiles and running averages to form cluster centers directly from the data, producing smoo

Adaptive Volume Delta Map---
📊 Adaptive Volume Delta Map (AVDM)
What is Adaptive Volume Delta Map (AVDM)?
The Adaptive Volume Delta Map (AVDM) is a smart, multi-timeframe indicator that visualizes buy and sell volume imbalances directly on the chart.
It adapts automatically to the best available data resolution

See all indicators and strategies
Community trends
Mazgaon Dock Descending Triangle and Breakoht ResetMazgaon Dock formed a Descending Triangle and gave a breakout, right after that it came backc to the trendline to give retest which signifies this can go up from here the key target levels here are 3023 and 3151 which are the 38.2% and 50% of the fib retracement.

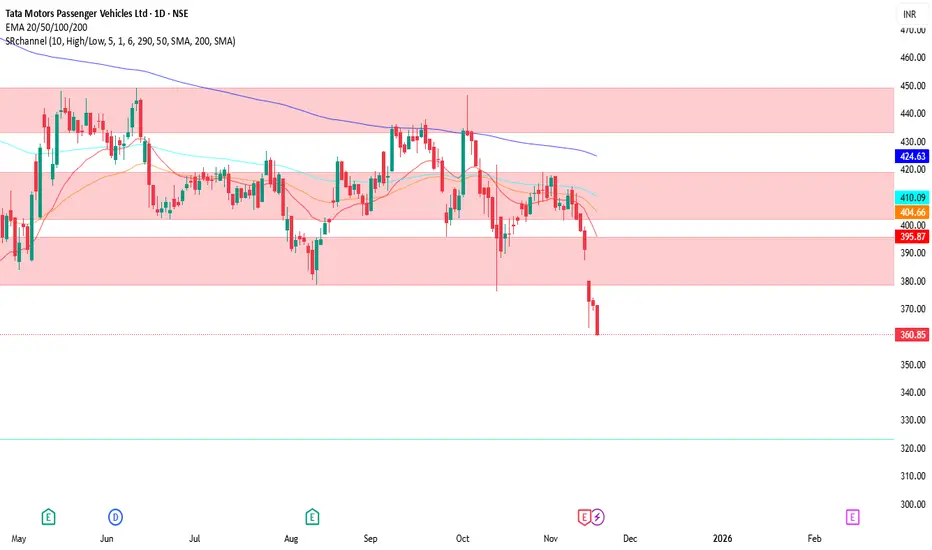
TMPV Short Setup: Expected Decline from 364 to 310 LevelThis trading idea revolves around Tata Motors Passenger Vehicles (TMPV), currently trading around 364 INR. Based on technical analysis and market sentiment, the stock is anticipated to decline towards the 310 INR level.
Analysis Walkthrough:
Current Price Action: The stock is trading near 364 INR,
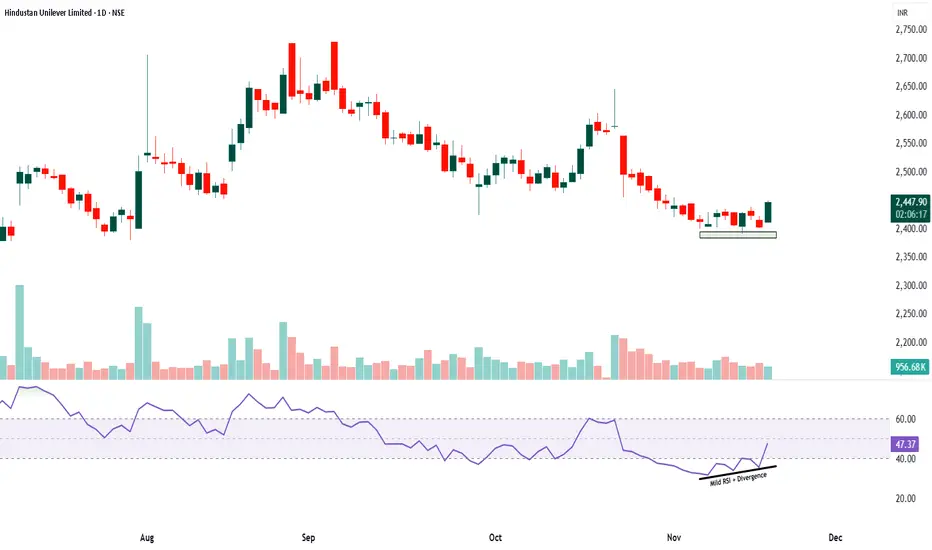
HINDUNILVR - longThe chart shows a mild RSI divergence where the price made a lower low near the 2400 zone while RSI formed a higher low, indicating that the selling momentum is reducing even though the price slipped slightly. This zone also aligns with a strong weekly support area where the stock has earlier taken
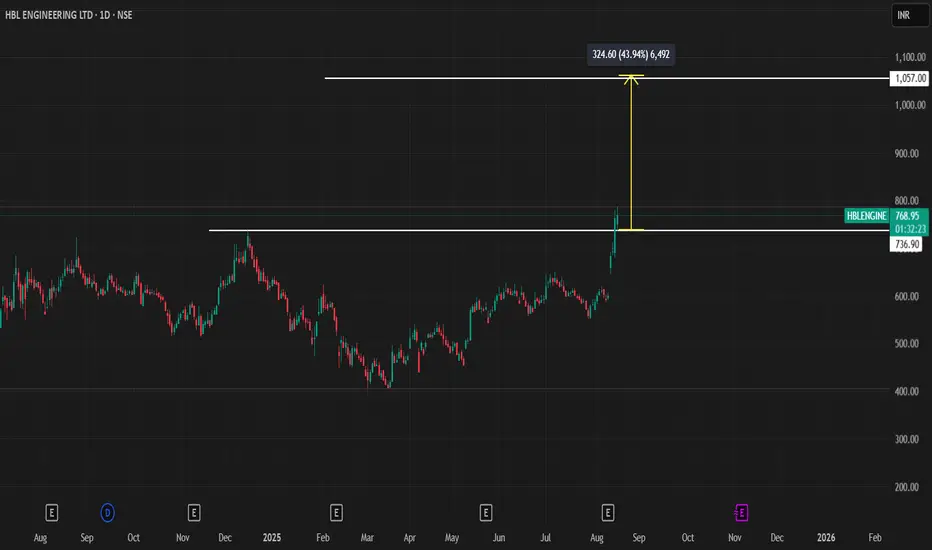
HBL engineering breakout level 739 HBL engineering breakout level 739, tgt is 1000 for positional,
HBLENGINE latest qtr result was good, buying opportunity for trader 739 is major support
INFOSYS MY TECHNICAL VIEWS 19-11-25After retest of support, multiple times, price ready to go up.
Nifty It and Infosys charts are almost identical..
Nifty is already in trend. VIX Normal. dollar index below 100. Good delivery. Everything look perfect. Anything missing?
Your views and suggestion are invited.
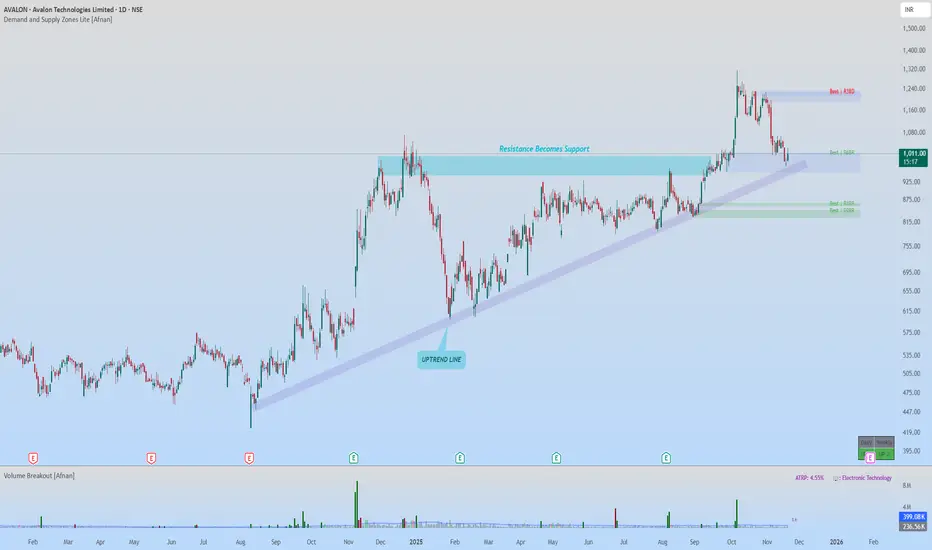
Is Avalon Technologies Preparing for a Major Trend Continuation?The chart of Avalon Technologies is currently sitting at a very interesting location where both advanced Demand–Supply principles and traditional technical analysis are telling a powerful story.
Let’s break the entire analysis into two separate parts so traders of all styles can understand what the
H&S pattern Bearish in SBICARDHead & Shoulders pattern finished in SBICARD.
On breakdown of trendline, will target the downside target equal to the range of head (from top of head to neckline)
Targets are mentioned, including key levels in between. Stop is above halfway of the right shoulder
HAL – Trendline Rejection & Short SetupPrice has approached a major descending trendline and shown clear rejection near the supply zone. The structure is still respecting lower highs, indicating sellers are active at the top of the range.
I’ve taken a short position based on:
Retest of the descending trendline
Rejection from the previ

Multi-Timeframe Structure and Supply Observations-Green Broadening Pattern
A distinct broadening pattern is forming, mapped out by the green lines on the daily chart. This structure highlights expanding volatility, which often captures both swing highs and lows as price oscillates between opposing boundaries.
-Monthly High-Low Anchors
The orange
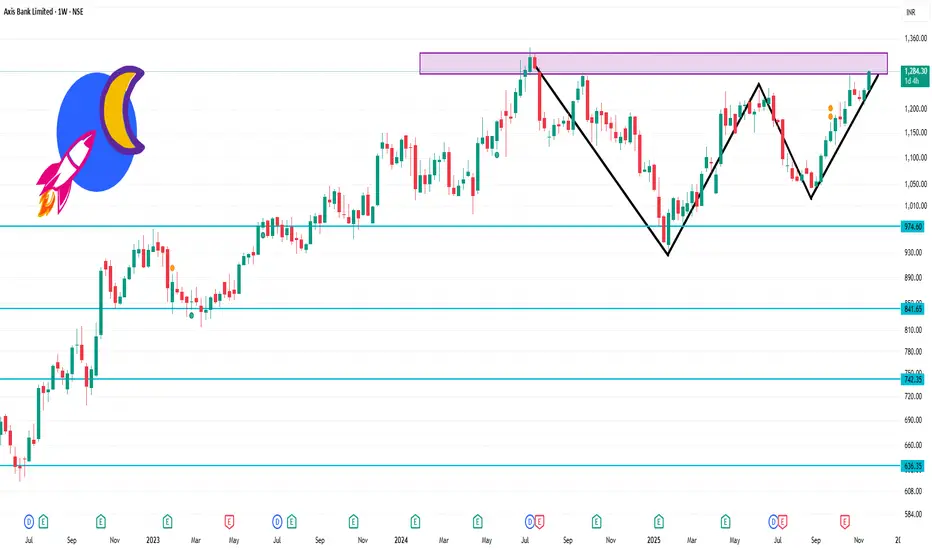
AXISBANK 1 Week Time Frame 🔍 Key Levels for the Week
Based on recent pivot/technical data:
Resistance levels: ~ ₹1,276 to ₹1,282 (around daily R1/R2)
Higher resistance: ~ ₹1,290-₹1,302 if uplink happens
Support levels: ~ ₹1,252-₹1,246 as near-term floor
Broader weekly support: ~ ₹1,232-₹1,218 region if deeper pullback
⚠️
See all stocks ideas
Today
U
UTLSOLARFujiyama Power Systems Limited
Exchange
BSE
Offer price
2.44 - 2.57
USD
Tomorrow
C
CAPILLARYCapillary Technologies India Ltd.
Exchange
BSE
Offer price
6.19 - 6.51
USD
Nov 26
T
TEAMExcelsoft Technologies Limited
Exchange
BSE
Offer price
1.29 - 1.35
USD
Nov 26
B
BLINGallard Steel Limited
Exchange
BSE
Offer price
1.60 - 1.69
USD
See more events
Community trends
BNB/USDT – Bullish Reversal Idea | Demand Zone Reaction📌 Overview
BNB is currently trading at a major higher-timeframe demand zone, showing early signs of accumulation after a sharp sell-off. Price has tapped the demand area multiple times and is holding without breaking structure to the downside.
This setup is based on a potential short-term reversal
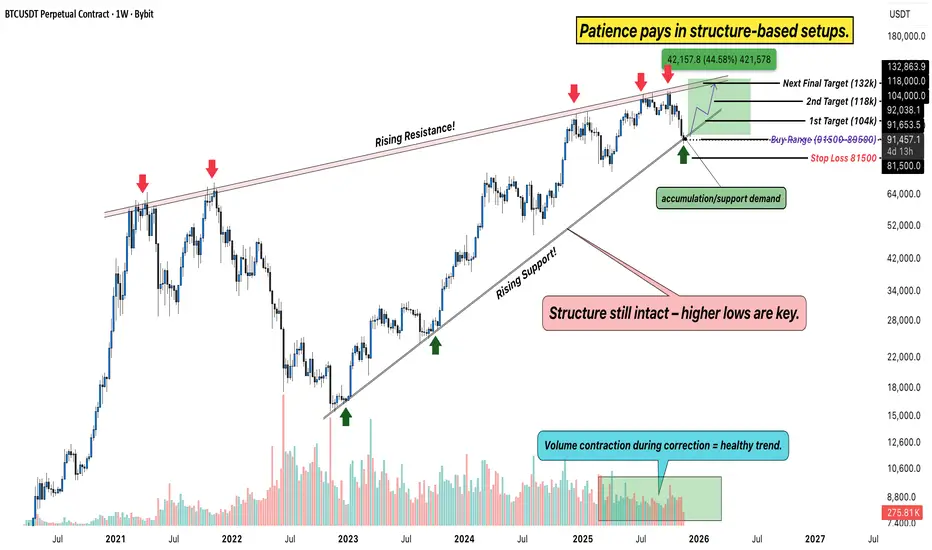
Bitcoin Weekly Chart – Structure Still Intact, Patience is PowerHello Everyone, i hope you all doing good, Lets discuss about bitcoin. After weeks of consolidation and volatility, Bitcoin is back at its rising support zone, where strong hands usually step in. The structure on the weekly chart continues to hold higher lows, a clear sign that the broader trend rem
BTCUSD WHY MOVE UP- ANALYSIS ?BTCSUSD
*Took the buy side trade. on basis of multitime frame.
* 4 hr -ve poi and 1hr -ve poi become +ve poi once BTCUSD move upside without respect
4hr -ve poi.
* Once BTCUSD reached @ 1hr -VE POI.
*we drew Fibo, got discount zone , where 1hr +ve poi and 15 mins FVA present.
*Trade with good R:R.

Bitcoin Turn Bearish In Monthly Time frameWhat’s going on
Bitcoin slipped significantly this week, dropping into the US$90,000–96,000 range, marking roughly a 10% decline for the week.
The decline has pushed BTC to trade around 20-25% below its all-time high of US$126,200.
On-chain data shows that long-term holders (those who typically h
$ETH UPDATE – FVG FILLED & STRUCTURE CLEANEDCRYPTOCAP:ETH UPDATE – FVG FILLED & STRUCTURE CLEANED
CRYPTOCAP:ETH just bounced perfectly from the $2,880 FVG and the entire downside imbalance is now fully filled, meaning no remaining bearish FVGs below.
Structure is clean… Ethereum is now technically READY for upside continuation.
Only one

Bitcoin at Support: Bounce Likely, Trend Still WeakBitcoin has been sliding steadily and has now broken its first major support near 103k. The latest drop completed a clear A-B-C decline, with the final C-wave forming an ending diagonal — a pattern that often signals exhaustion at the end of a move. That’s why the selling pressure slowed as price en

BTC Swing 8R reversal scenario....BTC moved as per our plan throughout last 10-15 days and crashed to ~ 90K levels, now it has reached to its critical level of reversal, which is weekly FVG CE area. Price has already shown change in delivery at 4H level. All these making it a really good contender for a long swing trade which may ev

BITCOIN looking for some pull backIt appears A,B,C, major correction is done.
However some concerns.
C wave is not touched the lower line of the channel.
and minor waves indicating still 5 th wave of C wave is pending
immediate target of Bitcoin 94700 tom94900
like this post if it helps ypu.
follow me to get up dates

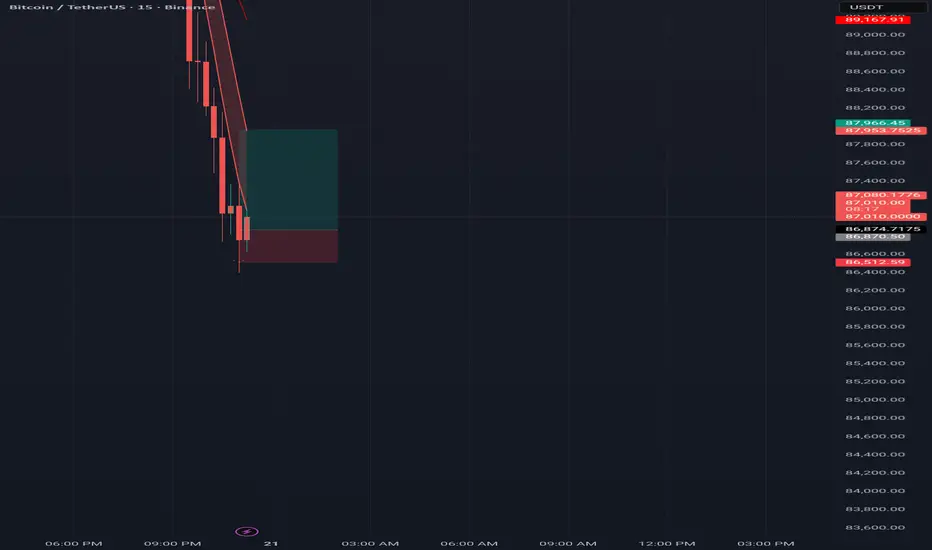
a small bye side tread on btc a quick scalp BTC/USDT – 15M | Catching the Knife or Buying the Fear?
Heavy sell-off on BTC pushed price straight into my marked demand zone.
Waited for liquidity sweep + wick rejection before entering a long position.
✔️ Entry: After liquidity grab
✔️ TP Hit: +$1,055
✔️ SL Below Sweep Zone
✔️ RR Maintained
Th
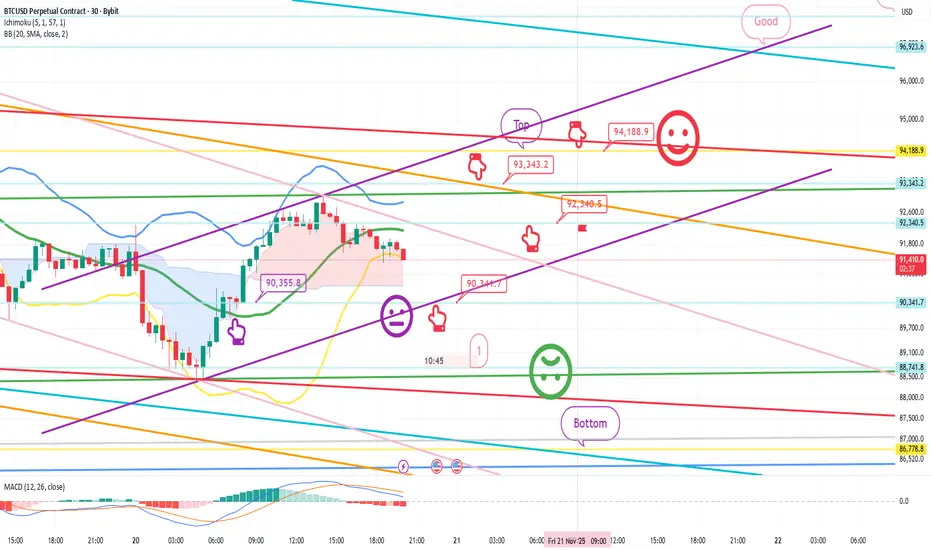
Bitcoin Bybit chart analysis November 20Hello
It's a Bitcoin Guide.
If you "follow"
You can receive real-time movement paths and comment notifications on major sections.
If my analysis was helpful,
Please click the booster button at the bottom.
Here's a Bitcoin 30-minute chart.
Shortly, at 10:30 AM and 12 PM, the Nasdaq indicators w
See all crypto ideas
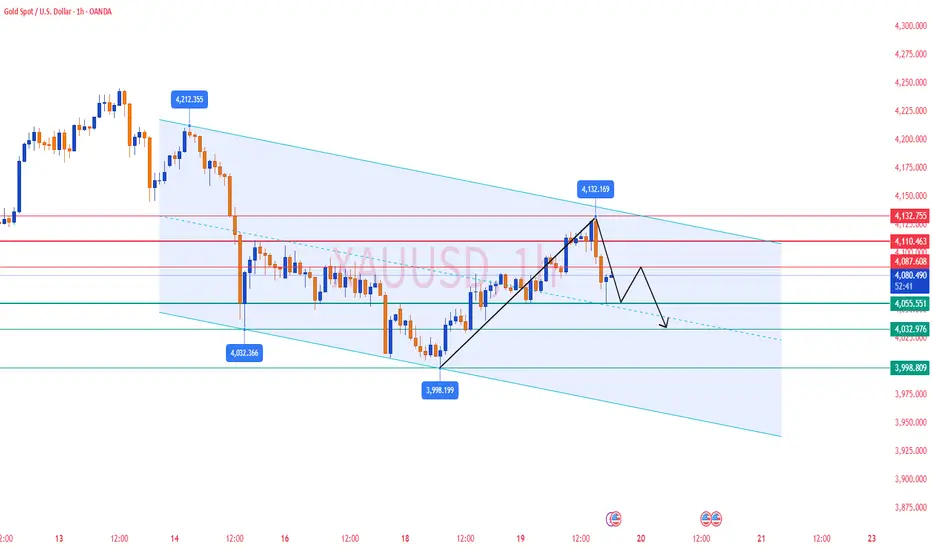
GOLD / XAUUSD - Classic Example of Liquidity GRAB
TF: 30 Minutes
CMP: 4075
GOLD and Silver seem to have completed the corrective rise and ready to tumble down.
In case of GOLD, price got rejected from the 50% fib level of the A leg and now resuming the C leg down.
The channel, possible price action etc, all are marked in the chart published her

Gold Trading Strategy for 20th November 2025🟡 GOLD INTRADAY LEVELS – 30-Min Strategy
📈 BUY SETUP (Long Position)
🔸 Entry Condition:
Buy above the High of the 30-min candle after price closes above $4122.
💰 Targets:
🎯 $4132
🎯 $4145
🎯 $4160
📌 Notes for Traders:
Wait for a strong bullish candle close above $4122 to confirm the breakout.

Gold Analysis & Trading Strategy | November 19-20✅ From the 4-hour chart, gold experienced a strong rebound yesterday, releasing some short-term bullish momentum. However, the price encountered significant resistance near 4132 (previous high + upper Bollinger Band).
The latest candle shows a large bearish candle with a long upper wick, which is a
Gold NY Session Strategy 11/19: Will up to 4162Gold Daily Plan – SMC Outlook (Nov 20)
Framework: CHoCH – BOS – FVG – POI – Premium/Discount Model
1. Market Context
Gold continues to recover after the sharp drop earlier this week. Price is now approaching the Premium zone of the current bullish swing and tapping into H1 supply. The market show

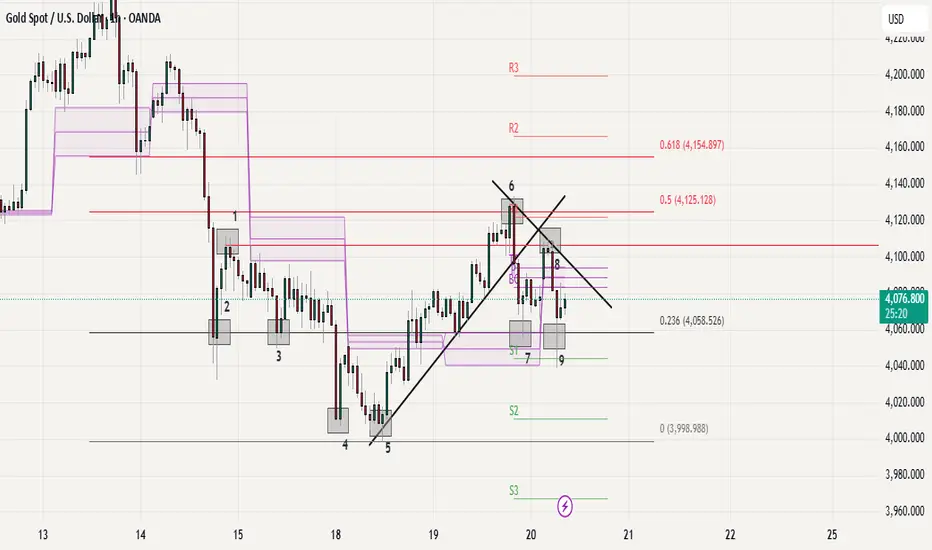
Gold Current Price Action Structure Looking weak under 6 and 8||
Support at 7 and 9, more correction under these POI.//
to go bullish need to claim /breakout on 6//
major support / Demand at 4 and 5//
Overall sentiments as per structure is correction /bearish for short term .
Gold Bullish Till 127000Gold have pending liquidity above 127000
after that it may fall towards 110000

LiamTrading – XAUUSD H1 | Gold Holds 0.618, Bullish Scenario...💛 LiamTrading – XAUUSD H1 | Gold Holds 0.618, Bullish Scenario Preferred for Wednesday 🎯
Gold continues to recover after the previous decline and is currently sitting right at the 0.618 Fibonacci level on the H1 timeframe — indicating buyers still have the upper hand. Price is also holding above th

Brian here with the gold outlook for November 20thGood morning everyone, Brian here with the gold outlook for November 20th. The ABC correction phase of gold is nearly complete, and the market is preparing to enter a new wave phase amidst a flurry of USD data today.
Fundamental Analysis
Today's focus remains on the US labor data: NFP (or revisions

The Gold Bullish Setup You Can't Miss!OANDA:XAUUSD The price is clearly approaching a critical support zone, one that has previously triggered positive reactions in the market. This zone also aligns closely with the psychological level of $4,000, which tends to capture the market’s full attention.
Given the current momentum, there’s a

Gold (XAU/USD) 2H Chart Analysis – Sell Setup from High ProbabilBased on the chart you provided, Gold is currently reacting near a High Probability POI (supply zone) after a corrective bullish move. The structure still shows:
Lower highs and lower lows → Bearish market structure
Price is approaching a supply zone where sellers previously dominated
Liquidity h

See all futures ideas
LONG EURUSDas i am looking for short covering, i am expecting to bounce from this levels
ENTRY - 1.14945
SL- 1.14845
TP- 1.15400

This One GBP Option Has 4 Red Flags — All Pointing UpA new GBP put option at 1.27 on the March futures contract entered the CME market quietly — and the price reacted almost immediately, starting to move in that direction.
👉 That’s Signal #1: Price is respecting the flow.
But it gets more interesting:
Signal #2: The position was built very rapidly

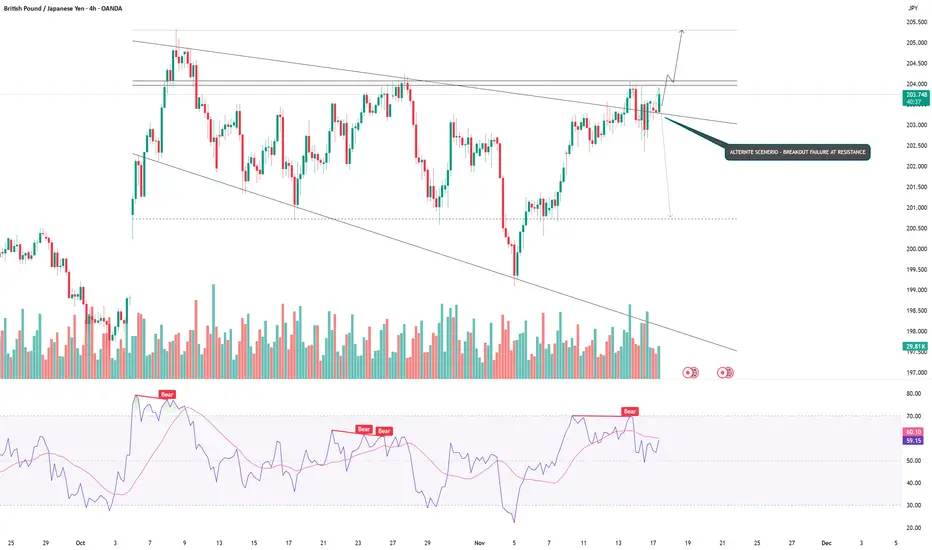
GBPJPY - BULLISH CONTINUATION OR REVERSAL?Symbol - GBPJPY
GBPJPY has broken the structure of the local downtrend amid persistent weakness in the Japanese yen. This shift opens the possibility for a continuation of the broader bullish trend.
The yen continues to depreciate, while the British pound maintains its upward trajectory. A breakou
Flag Found in NZDUSDI was eyeing on NZDUSD for Bullish entry above its major support @ 0.5613.
Then I caught a flag pattern which indicates continuation towards 0.5515. This is also confirmed by its near major support at 0.5514.
The price retraced two times from 0.5514 on 9th April 2025 and 3rd Februrary 2025. It ena

EURUSDEURUSD, I expect to come down further. This provides a strong risk–reward ratio since the downtrend is intact on 15 min, and market momentum supports continuation toward lower support levels.

EURUSD Trade idea 20/11/2025Namaste everyone 🙏
Eurusd is in a trappy orderflow rightnow, we are in a bullish poi currently that is a daily FVG, and we have a bearish H4 fvg.
This is my plan -
1.Dxy has clear buy side liquidity to take out, so if dxy taps into its FVG on H4 time frame before taking out the buy side liquidity

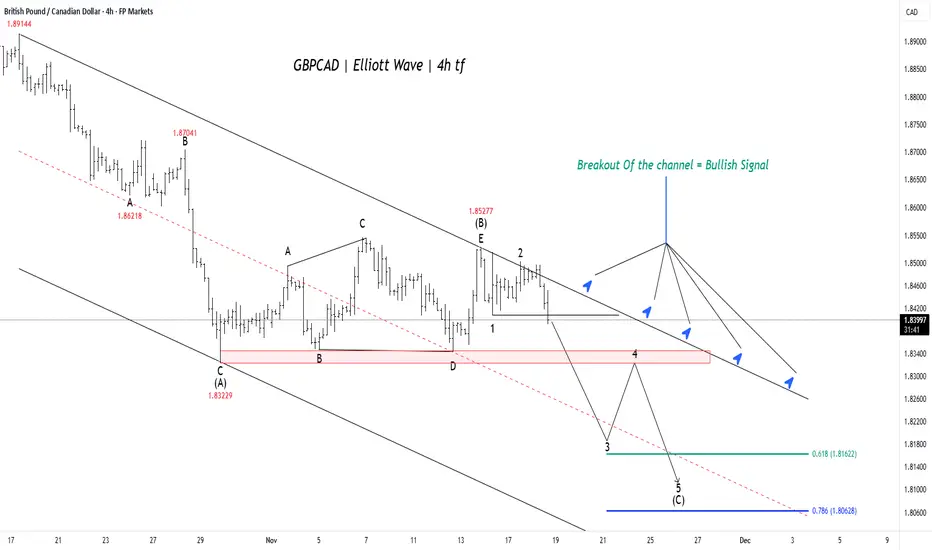
GBPCAD: Final Drop to Key Support Before Major ReversalThe wave Principle strongly suggests the currency pair is currently in the final stages of a large decline, which is expected to precede a major, sustained upward move.
Completion of Correction: The pair has recently completed a complex, sideways corrective pattern (such as a triangle or flat),
GBPUSD MULTI TIMEFRAME ANALYSIS Hello traders , here is the full multi time frame analysis for this pair, let me know in the comment section below if you have any questions , the entry will be taken only if all rules of the strategies will be satisfied. wait for more price action to develop before taking any position. I suggest yo

GBP/USD something big is cooking. keep eye no gbp/usd. it is consolidating since a long time. a big move can come anytime in either side, wait for price action confirmation.

Usdchf bearish sell
💧USD/CHF – Bearish Bias News Summary
📍SNB cut rates to 0%, signaling more easing ahead → CHF stays fundamentally strong.
📍UBS forecasts USD/CHF lower, expecting continued franc strength.
📍Weak U.S. data increases Fed cut expectations → pressure on USD.
📍Swiss sentiment weak, but SNB still ready

See all forex ideas
| - | - | - | - | - | - | - | - | ||
| - | - | - | - | - | - | - | - | ||
| - | - | - | - | - | - | - | - | ||
| - | - | - | - | - | - | - | - | ||
| - | - | - | - | - | - | - | - | ||
| - | - | - | - | - | - | - | - | ||
| - | - | - | - | - | - | - | - | ||
| - | - | - | - | - | - | - | - | ||
| - | - | - | - | - | - | - | - |
Trade directly on the supercharts through our supported, fully-verified and user-reviewed brokers.


