RBL Bank Shows a Powerful Cup Pattern Breakout on Weekly ChartRBL Bank has completed a textbook Cup & Handle pattern on the weekly timeframe, signaling a meaningful shift from a long consolidation phase into a fresh bullish trend. The rounded base formation highlights a gradual transition from distribution to accumulation, indicating growing confidence among l

The best trades require research, then commitment.
Get started for free$0 forever, no credit card needed

Scott "Kidd" PoteetPolaris Dawn astronaut

Where the world does markets
Join 100 million traders and investors taking the future into their own hands.

Tata Steel Ltd The chart exhibits a Cup and Handle pattern on Tata Steel’s daily timeframe.
1. Pattern structure:
Cup: Formed from Nov to early Jan, with a rounded decline and recovery, creating the “U” shape.
Handle: A tighter consolidation from mid‑Jan to Feb, retracing ~10–15% of the cup’s advance, w

PNB Ready to touch ATH 225+ in next 1.5-2 Years timeframePNB Ready to touch ATH 225+ in next 1.5-2 Years timeframe
Fundamentals:
Stock is trading at 1.07 times its book value
Company has delivered good profit growth of 111% CAGR over last 5 years
Company has been maintaining a healthy dividend payout of 19.2%
Technical:
Chart has been forming rounding

SBI Life: Double Top Signals Short-Term Downside RiskSBI Life Insurance is showing signs of a short-term trend reversal after forming a well-defined double top near the ₹2,105–2,110 zone on the hourly chart. The stock has slipped below its neckline support around ₹2,065, confirming bearish structure and indicating distribution at higher levels.
Mome

Policy Bazaar Cmp 1648 Hammer Candle @ SupportPolicy Bazaar Cmp 1648
1. Triple bottom @ support Line
2. Hammer Candle @ Support
2. RSI reversal
Buy above 1652 SL 1610 target 1675-1700-1725-1750
It is just a view, please trade at your own risk.

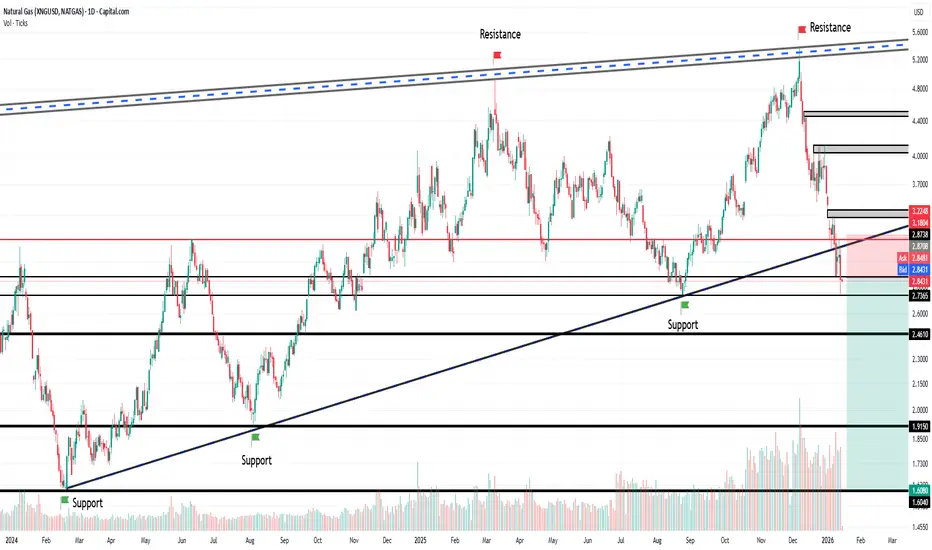
NG : Raising wedge breakdown• NG was trading in a wedge from Jan-2023.
• The wedge is clearly broken on 9th Jan
• Retest of the wedge is completed on14th Jan.
• SL and Target are mentioned in the chart.
• RR is 1:4.
• Educational purpose only. Happy learning
ASTRAL ltd ready to move higher?No strong breakout yet. Stock is consolidating.
above 1500 looks like a breakout level
sl 20-25%
tp 50-75%
rrr 1:2
Key levels to watch:
Support: ₹1,400–1,420
Major support: ₹1,300
Resistance: ₹1,520–1,550
Astral has the potential to move higher, but the ride may not be smooth, there are mixed si

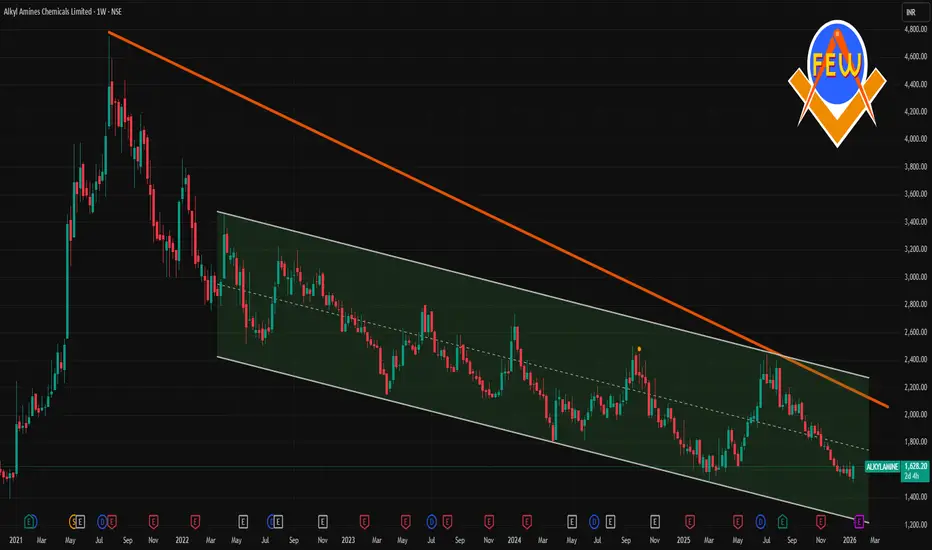
ALKYLAMINE 1 Week Time Frame 📌 Current Price (Latest Market Levels)
Approximate current trading price: ₹1,570 – ₹1,610 range on NSE (mid‑January 2026) — slightly below recent intraday highs/lows around this zone.
52‑week range: Low ~₹1,506 • High ~₹2,438.
Short‑term price action has been slightly bearish to neutral around th
Apollo Tyres Ltd – Chart Analysis (Daily)Price has respected the ₹495–500 support zone multiple times, indicating strong demand at lower levels.
A bullish pin bar has formed near this support, suggesting rejection of lower prices and potential upside continuation.
Current price is trading above support and near ₹525–530, showing improvin

Banco Products (India) LtdDate 14.10.2026
Banco Products (India) Ltd
Timeframe : Day Chart
Highlight :
Despite of 38% rise in share price in the last 1 year the stock PE Ratio is still at 21
This is very rare occurrence in todays era in stock market, indicates strong earnigs & managment
About
Manufactures and supplies

See all editors' picks ideas
DeeptestDeeptest: Quantitative Backtesting Library for Pine Script
━━━━━━━━━━━━━━━━━━━━━━━━━━━━━━━━━━
█ OVERVIEW
Deeptest is a Pine Script library that provides quantitative analysis tools for strategy backtesting. It calculates over 100 statistical metrics including risk-adjusted return ratios (Sharpe

Arbitrage Detector [LuxAlgo]The Arbitrage Detector unveils hidden spreads in the crypto and forex markets. It compares the same asset on the main crypto exchanges and forex brokers and displays both prices and volumes on a dashboard, as well as the maximum spread detected on a histogram divided by four user-selected percenti

Multi-Distribution Volume Profile (Zeiierman)█ Overview
Multi-Distribution Volume Profile (Zeiierman) is a flexible, structure-first volume profile tool that lets you reshape how volume is distributed across price, from classic uniform profiles to advanced statistical curves like Gaussian, Lognormal, Student-t, and more.
Instead of forcin

Multi-Ticker Anchored CandlesMulti-Ticker Anchored Candles (MTAC) is a simple tool for overlaying up to 3 tickers onto the same chart. This is achieved by interpreting each symbol's OHLC data as percentages, then plotting their candle points relative to the main chart's open. This allows for a simple comparison of tickers to tr

Vdubus Divergence Wave Pattern Generator V1The Vdubus Divergence Wave Theory
10 years in the making & now finally thanks to AI I have attempted to put my Trading strategy & logic into a visual representation of how I analyse and project market using Core price action & MacD. Enjoy :)
A Proprietary Structural & Momentum Confluence System

Per Bak Self-Organized CriticalityTL;DR: This indicator measures market fragility. It measures the system's vulnerability to cascade failures and phase transitions. I've added four independent stress vectors: tail risk, volatility regime, credit stress, and positioning extremes. This allows us to quantify how susceptible markets are

Volatility Risk PremiumTHE INSURANCE PREMIUM OF THE STOCK MARKET
Every day, millions of investors face a fundamental question that has puzzled economists for decades: how much should protection against market crashes cost? The answer lies in a phenomenon called the Volatility Risk Premium, and understanding it may fundam

Volume Gaps & Imbalances (Zeiierman)█ Overview
Volume Gaps & Imbalances (Zeiierman) is an advanced market-structure and order-flow visualizer that maps where the market traded, where it did not, and how buyer-vs-seller pressure accumulated across the entire price range.
The core of the indicator is a price-by-price volume prof

Match Finder [theUltimator5]Match Finder is the dating app of indicators. It takes your current ticker and finds the most compatible match over a recent time period. The match may not be Mr. right, but it is Mr. right now. It doesn't forecast future connection, but it tells you current compatibility for today.
Jokes aside,

Trend Line Methods (TLM)Trend Line Methods (TLM)
Overview
Trend Line Methods (TLM) is a visual study designed to help traders explore trend structure using two complementary, auto-drawn trend channels. The script focuses on how price interacts with rising or falling boundaries over time. It does not generate trade sign

See all indicators and strategies
Community trends
PNB Ready to touch ATH 225+ in next 1.5-2 Years timeframePNB Ready to touch ATH 225+ in next 1.5-2 Years timeframe
Fundamentals:
Stock is trading at 1.07 times its book value
Company has delivered good profit growth of 111% CAGR over last 5 years
Company has been maintaining a healthy dividend payout of 19.2%
Technical:
Chart has been forming rounding
RBL Bank Shows a Powerful Cup Pattern Breakout on Weekly ChartRBL Bank has completed a textbook Cup & Handle pattern on the weekly timeframe, signaling a meaningful shift from a long consolidation phase into a fresh bullish trend. The rounded base formation highlights a gradual transition from distribution to accumulation, indicating growing confidence among l
Tata Steel Ltd The chart exhibits a Cup and Handle pattern on Tata Steel’s daily timeframe.
1. Pattern structure:
Cup: Formed from Nov to early Jan, with a rounded decline and recovery, creating the “U” shape.
Handle: A tighter consolidation from mid‑Jan to Feb, retracing ~10–15% of the cup’s advance, w
JTLIND: 3 year Downtrend Trendline Breakout, Chart of the WeekFrom ₹138 to ₹50: Why This Old Multi-Bagger Steel Stock Just Hit 20% Upper Circuit, Breaking 3-Year Downtrend and Getting a Big Order. Let's Understand in "Chart of The Week"
As per the Latest SEBI Mandate, this isn't a Trading/Investment RECOMMENDATION nor for Educational Purposes; it is just for

HINDZINC 1 Week Time Frame 📌 Current Context (mid‑Jan 2026)
• The stock is trading around ~₹640‑₹654 on NSE.
📊 1‑Week Key Levels (Support & Resistance)
🔄 Weekly Pivot (Standard)
Pivot (weekly baseline): ~₹615‑₹642 (varies slightly by method)
📈 Resistance Levels
R1: ~₹642‑₹677 (immediate weekly resistance)
R

What is the Best Location / Area to Take a trade in the Markets I make educational content videos for trading
In this video I am sharing my experience on which areas are the best to trade with simple Price action using older than 3 months charts

CDSL — Price Respecting a Falling ChannelPrice is trading within a well-defined falling channel, marked by lower highs and lower lows.
Multiple touches on both the upper and lower trendlines confirm the validity of this structure.
Recently, price has reacted near the lower boundary of the channel, indicating demand emerging at this zone.
T

SBI Life: Double Top Signals Short-Term Downside RiskSBI Life Insurance is showing signs of a short-term trend reversal after forming a well-defined double top near the ₹2,105–2,110 zone on the hourly chart. The stock has slipped below its neckline support around ₹2,065, confirming bearish structure and indicating distribution at higher levels.
Mome
RBL BANK @324Not a SEBI registered, just sharing idea. RBL @324 gave multi-month breakout from Cup & Handle @300 SL 303. Primary Target- 466 & 530 & investment target 720 in 1.5 -2 year.

Processing multi year breakout📈 Emkay Global Financial Services | Long-Term Resistance Zone
Emkay Global is trading near a major multi-year resistance area (~₹300–320) on the weekly timeframe after a strong upmove.
Price has shown sharp recovery from long-term base, but supply is visible near historical highs.
🔍 Technical High

See all stocks ideas
Jan 19
SBILIFESBI Life Insurance Co. Ltd.
Actual
—
Estimate
6.94
INR
Jan 19
OBEROIRLTYOberoi Realty Limited
Actual
—
Estimate
20.30
INR
Jan 19
BIOCONBiocon Limited
Actual
—
Estimate
1.17
INR
Jan 19
HINDZINCHindustan Zinc Limited
Actual
—
Estimate
8.30
INR
Jan 19
PNBPunjab National Bank
Actual
—
Estimate
4.27
INR
Jan 19
TIPSMUSICTips Music Limited
Actual
—
Estimate
4.20
INR
Jan 19
CEATLTDCEAT Limited
Actual
—
Estimate
46.42
INR
Jan 19
BHELBharat Heavy Electricals Limited
Actual
—
Estimate
1.04
INR
See more events
Jan 20
3284Narmadesh Brass Industries Limited
Exchange
BSE
Offer price
0.166
USD
Jan 21
F
FUSEGre Renew Enertech Ltd.
Exchange
BSE
Offer price
1.11 - 1.16
USD
Jan 22
EMIArmour Security (India) Ltd.
Exchange
NSE
Offer price
0.61 - 0.63
USD
Jan 23
OHLAAritas Vinyl Limited
Exchange
BSE
Offer price
0.44 - 0.52
USD
Jan 28
B
BRSDigilogic Systems Ltd.
Exchange
BSE
Offer price
1.09 - 1.15
USD
See more events
Community trends
Retest of Support BTC1. Rest of the Support(Previous Resistance) Completed
2. Falling wage Wxyz Correction Completed
3. Hourly bulish Divergence is Visible
Next leg 98-99k Probability 60%

BTC 1D UpdateEvening sturdy fam! 🌆📈 (7:42 PM IST Chennai vibes)
Daily BTC/USDT Perpetual (Binance) quick update – Jan 16, 2026: Sitting at ~$95,399 (-0.18%). Still holding above $94,760 support zone (dark box), no real breakdown after the rejection at $101,516 resistance. Blue upward arrow earlier showed clean h

Altseason 2026 Will Be Bigger Than 2017 & 2021 Combined Altseason 2026 Will Be Bigger Than 2017 & 2021 Combined 🚀
OTHERS/BTC (Altcoins Vs Bitcoin) Is Back At The Same Support Level That Triggered Every Major Altcoin Cycle.
2017: +423% Rally
2021: +503% Rally
2026: ~702% Projected Move
Every Cycle This Ratio Bounces, Small Caps Go Parabolic And 10x–100

Elliott Wave Structure - classic 5-wave impulse cycleWave 1
2016 → 2017 move (up to ~19k)
Wave 2
2018 crash (~3k)
Wave 3
2018 → 2021 rally (~69k)
Wave 4
2021 → 2022 bear market (~15.5k)
Wave 5 (current)
2023 → now (~115k+ structure)
Everything inside Wave 5 = lower timeframe waves, not new major waves.
Based on this count + Fibonacci relationships:
Co

ETH/USD 1H: Double Top Formation Under WatchEthereum is showing a classic 'M' pattern on the hourly chart. If the support level breaks, we could see a significant move lower. Watching the price action for confirmation

Intraday Short Setup | Jan 15th 2026 | Valid Until Daily ClosePrice when pushed into a potential intraday Pivot supply zone (red box) where sellers may step in. This trade is based on the expectation of a rejection from this area.
Entry: Red box - a short entry zone aligned with overhead supply
Stop Loss: Above the red zone (invalidates the setup)
Target: Gre

BTC Showing StrengthBTC looks bullish on 45m timeframe, even though we are in bearish leg in 1D timeframe.
However, we have also got a ChOch on 4H higherframe.
Could be an early sign of bullish rally.
These are the most probable scenario we are looking at currently.

BTCUSDT – Bullish SetupBitcoin is showing strong bullish momentum from the current price.
Price is holding above the key support zone and buyers are actively defending the levels.
🔹 Market structure remains bullish
🔹 Strong demand visible near support
🔹 Higher high & higher low formation intact
As long as BTC sustains a

BTCUSD – Daily Timeframe AnalysisBitcoin is currently trading near a critical horizontal resistance around 95,300, which has acted as a strong supply zone in the recent past. Price has formed a higher-low structure, respecting the rising trendline support, indicating a gradual shift from bearish to neutral–bullish momentum.
The on

BTC Uptrend or Downtrend- 4 Hour Time FrameTechnical Structure Analysis
Fibonacci Retracement Analysis (Image 2)
0.5: ~$103,490 - Mid-level resistance
0.382: ~$98,177 - Current battle zone
0.236: ~$91,942 - Critical support
Current Formation: Descending Triangle/Wedge
Lower highs: $125k → $108k → $103k → $98k
Horizontal support: $92-93k r

See all crypto ideas
Gold weekly rotation between 4682 supply and 4420 demand🟡 XAUUSD – Weekly Smart Money Plan | by Ryan_TitanTrader (17/01)
📈 Market Context
Gold remains structurally bullish on the higher timeframe, but weekly price action has clearly transitioned into a controlled Smart Money rotation. After delivering buy-side liquidity into premium, continuation has

XAUUSD – Rejection From Premium Zone Trade Idea Summary
Gold has tapped into a key premium zone, swept local liquidity, and is now showing early signs of rejection. Price has also broken below the short-term structure on the 15m chart, aligning with a corrective pullback setup toward discounted levels.
This setup offers a clean risk-

XAUUSD Consolidation Below Resistance!Chart Analysis (XAUUSD – 1H)
Market Structure:
Price is ranging just below a major resistance / supply zone (~4,630–4,640). Multiple rejections here show distribution rather than clean breakout strength.
Higher Time Frame Context:
A bullish higher-timeframe trendline is risin

XAUUSD 4HR T/F ANALYSIS---
xauusd 4hr t/f analysis----- formation of arc if breakdown we can see supply on target point let`s see how it`s work |

XAUUSD H1 – Range Bound MarketSideways Consolidation, Waiting for a Range Break
Gold on the H1 timeframe is currently trading inside a clear sideways range near the ATH, showing signs of balance after the recent impulsive move. At this stage, the market is not trending — it is building liquidity and waiting for a breakout.
MAR

Silver Tired for few Weeks - Exit for the time beingIn my earlier post of 3rd December 2025 I had talked about a BLAST in Gold including Silver. It has happened. But remember, in the AI model, rise can not be one sided for ever. I am not saying that TREND has turned negative. But for the time being it has a run up too fast and tiredness is visible on

Silver is also reactingSame as Gold, reacting from an early but strong zone with pending liquidity and demand below.
Worth taking a small risk right now to rise the rally if it starts early
Otherwise can as well wait for the unmitigated area below for full size position.

SILVER (XAGUSD) 1HRsWING TRADE
- EARN WITH ME DAILY 10K-20K –
SILVER (XAGUSD) Looking good for upside..
When it break level 93053 and sustain.. it will go upside...
BUY@ 93053
Target
1st 96004
2nd 98886
Enjoy trading traders.. Keep add this STOCK in your watch list..
Big Investor are welcome to join the ride ..
L

Silver bull case above 94 and bear case below 86 Looks like silver has taken a halt now and in accumulation phase. Looks breakout can come above 93 and breakdown below 86.
Either side rally of 8-10% is anticipated.

Geopolitical Tensions Keep Gold Bid Macro & Fundamental Context
Escalating geopolitical risks, ongoing regional conflicts, and rising political uncertainty continue to drive risk-off sentiment across global markets.
In this environment:
The USD shows mixed reactions as demand for safety competes with expectations of policy flexibil

See all futures ideas
GBPUSD SHOWING A GOOD UP MOVE WITH 1:8 RISK REWARD GBPUSD SHOWING A GOOD UP MOVE WITH 1:8 RISK REWARD
DUE TO THESE REASON
A. its following a rectangle pattern that stocked the market
which preventing the market to move any one direction now it trying to break the strong resistant lable
B. after the break of this rectangle it will boost the market

XAUUSD 4HR T/F ----- FORMATION OF ARC ---
xauusd 4hr t/f analysis------
formation of arc and it`s dual direction structure bow current situation we can expect breakdown of down side then we can see previous demand interchange into supply like structure mapping let`s see

EURUSD | KAALA TARGET Liquidity RespectEURUSD respected KAALA TARGET liquidity zone perfectly.
After a sharp sell-off, price came back and respected the OLD liquidity area again.
KAALA ENERGY also showed weakness before the drop.
Educational purpose only. Not financial advice.

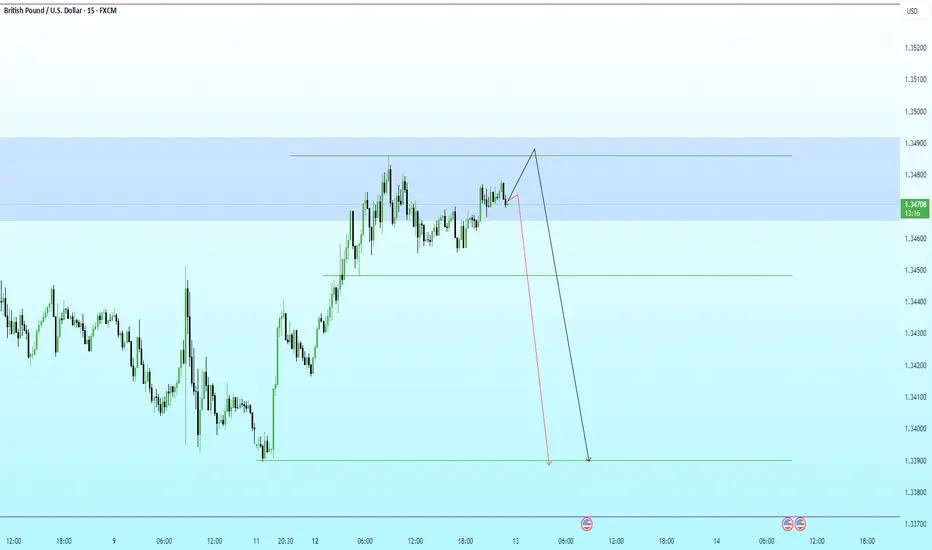
GBPUSD the range confirmed, can initiate the short trade .GBPUSD the range confirmed, can initiate the short trade with proper SL and target

Bullish Engulfing Pattern🔎 Overview
Overview
The Bullish Engulfing Pattern is a strong price-action formation that appears after a decline or extended consolidation. It occurs when a large bullish candle completely engulfs the previous bearish candle, signaling a decisive shift in control from sellers to buyers. This p

AUDUSD | Bullish SetupPrice action remains bullish, indicating continuation towards 0.6708.
Trend strength supports further upside

Mejor Forex Pair Scanning Session – 4Scanning multiple forex pairs to filter high-quality trade setups. No trades forced, only structure-based opportunities.

AUDUSD LONG SETUP — Bullish Reversal from DemandAUDUSD has tapped into a strong demand zone aligned perfectly with a long-term ascending trendline, showing signs of potential bullish reversal. Price swept the previous intraday liquidity and reacted strongly, indicating buyers are stepping in.
This confluence makes this area a high-probability lon

USDCAD ON 2H Time frame Head and shoulder pattern.As you can see market is forming head and shoulder pattern if market breaks the neckline we can sell with LTF

GBPUSD · 15M · SMC OutlookPrice is trading deep into premium, pressing against a well-defined HTF supply zone.
HTF Framework
Clear bullish leg already completed.
Buy-side liquidity resting above recent highs.
Premium zone aligns with prior distribution and weak highs.
LTF Structure
Momentum is slowing near the highs.
See all forex ideas
| - | - | - | - | - | - | - | - | ||
| - | - | - | - | - | - | - | - | ||
| - | - | - | - | - | - | - | - | ||
| - | - | - | - | - | - | - | - | ||
| - | - | - | - | - | - | - | - | ||
| - | - | - | - | - | - | - | - | ||
| - | - | - | - | - | - | - | - | ||
| - | - | - | - | - | - | - | - | ||
| - | - | - | - | - | - | - | - |
Trade directly on Supercharts through our supported, fully-verified, and user-reviewed brokers.


