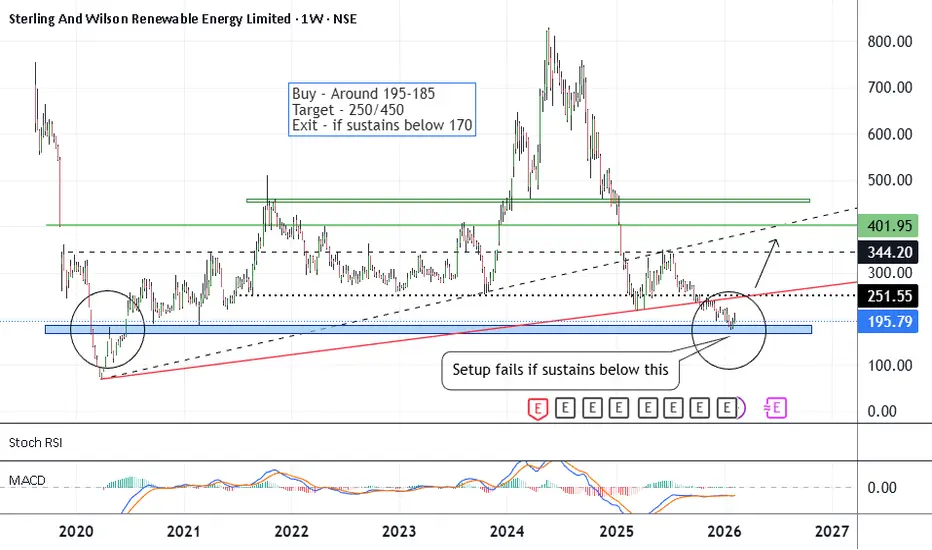
SW Solar - Bottom FishingCMP 195 on 14.02.26
As can be seen on the chart. There has been a big correction in the stock price in the past months. Presently trading near the lowest prices. If a reversal takes place, may go into a bullish phase ahead.
Possible targets may be 250/450.
The setup fails if it sustains below 170.

The best trades require research, then commitment.
Get started for free$0 forever, no credit card needed

Scott "Kidd" PoteetPolaris Dawn astronaut

Where the world does markets
Join 100 million traders and investors taking the future into their own hands.
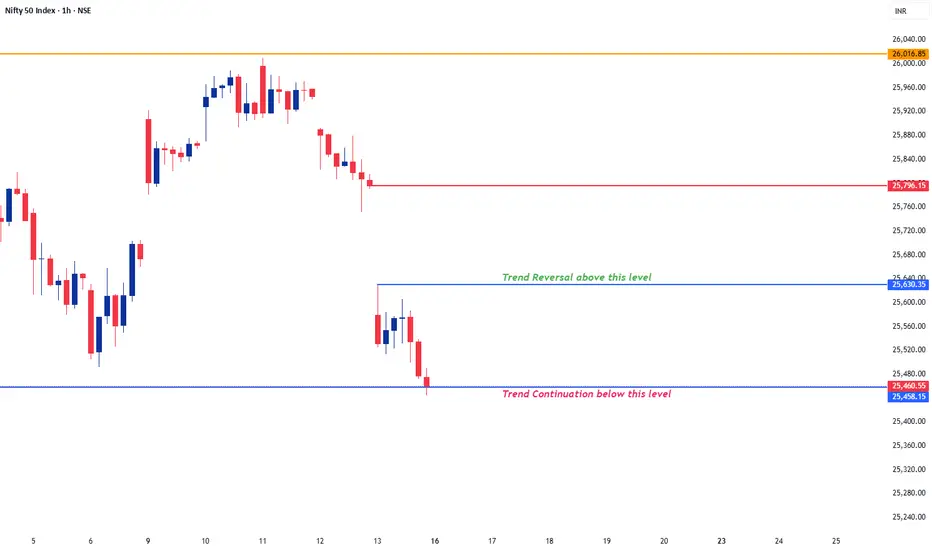
#Nifty Weekly 16-02-26 to 20-02-26#Nifty Weekly 16-02-26 to 20-02-26
25450-25650 is the sideways range for next week.
25800 will act as Resistance for next week.
Wait for above range to break on either side for a trending move.
Long level is above 25650 for the targets of 25780/25900.
Short level is below 25450 for the targets of 25
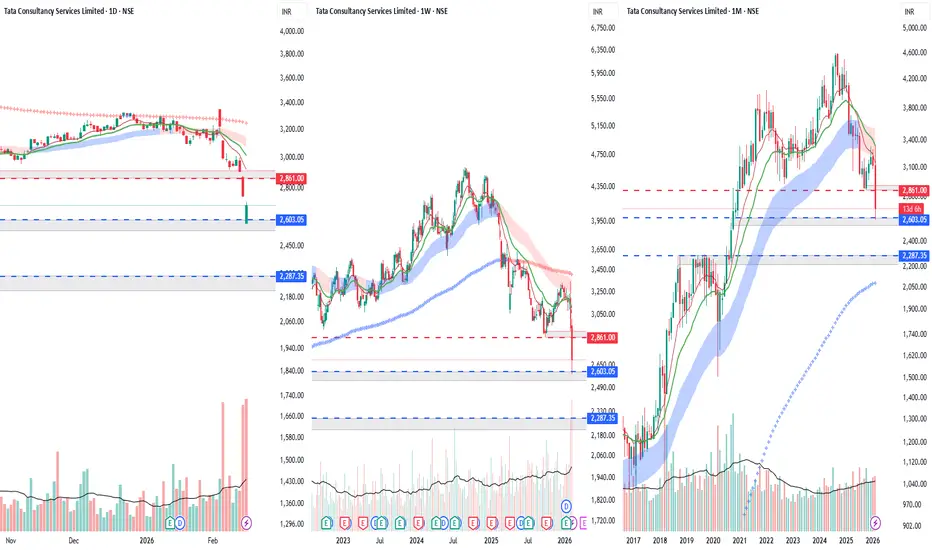
What to do in TCS if we are Holding?What to do in TCS if we are Holding?
Market Sentiment :
- Extremely week: Due to AI disruption Theory
Technical:
- Extremely Week: Daily, Weekly, Monthly Lower Lows formation
Should We Enter at this Level?
- No New Entry suggested unless we see Daily close above 20EMA
But I am already Hold
SILVER 1HRSWING TRADE
SILVER (XAGUSD) Looking good for Downside..
When it break level 73.77 and sustain.. it will go Downside...
SELL @ 73.77
Target
1st 63.89
2nd 56.48
Enjoy trading traders.. Keep add this STOCK in your watch list..
Big Investor are welcome..
Like this Post??? Hit like button..!!!
Foll

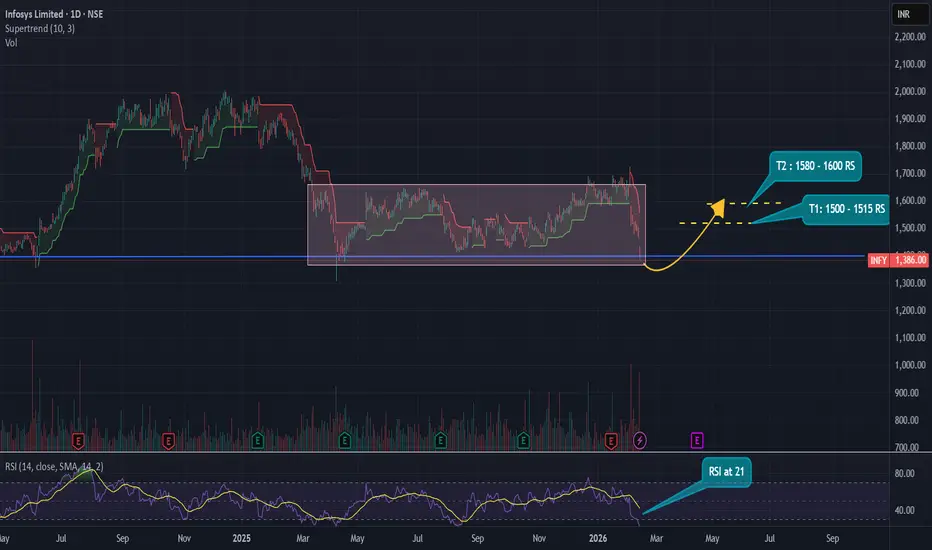
Infosys LimitedInfosys Technical Outlook :
Infosys has been consolidating within the ₹1400–₹1700 range over the past year. Currently, the stock is in the oversold zone, with the RSI at 21, and is testing a strong support level around ₹1400.
From a mid-term perspective, the setup looks attractive:
- Target 1: ₹1500
$ETH has officially lost the 2000–2020 base CRYPTOCAP:ETH has officially lost the 2000–2020 base we highlighted on the 1H chart.
Triple-top rejection (Top 1 → Top 2 → Top 3) played out perfectly — buyers failed at the 2140–2160 supply zone, and breakdown followed.
📍 First reaction target (1980–1950) ✅ Hit
That’s roughly a 2.6–3% move from

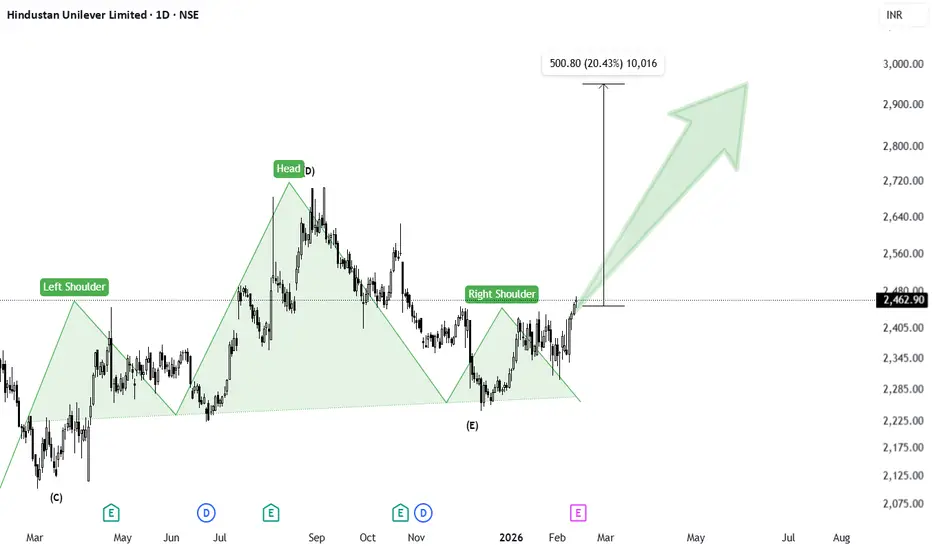
Hindustan Unilever : Prepared for Upside Hindustan Unilever – Failed Head & Shoulders Turning Bullish (Daily Chart)
On the daily timeframe, Hindustan Unilever was forming a well-structured Head & Shoulders pattern. The left shoulder, head, and right shoulder were clearly visible, with a defined neckline acting as support.
However, instea
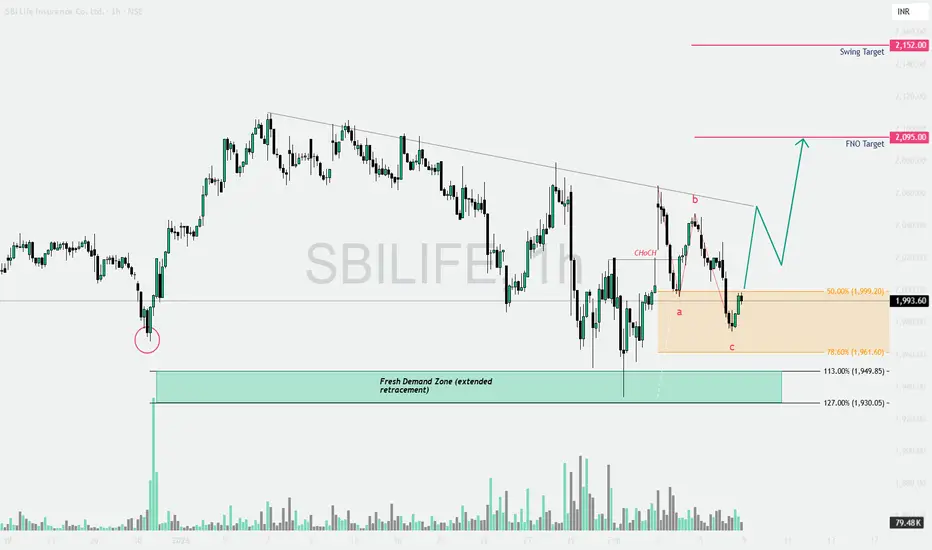
SBILIFE: "Change of Character" Signaling somethingThe Technical Breakdown (Educational Guide)
The chart displays a beautiful confluence of Smart Money Concepts (SMC) and Fibonacci retracement. If you’ve been looking for a textbook "Buy the Dip" setup, this is it! Here are 4 key educational points from this chart:
1. The Choch (Change of Character)
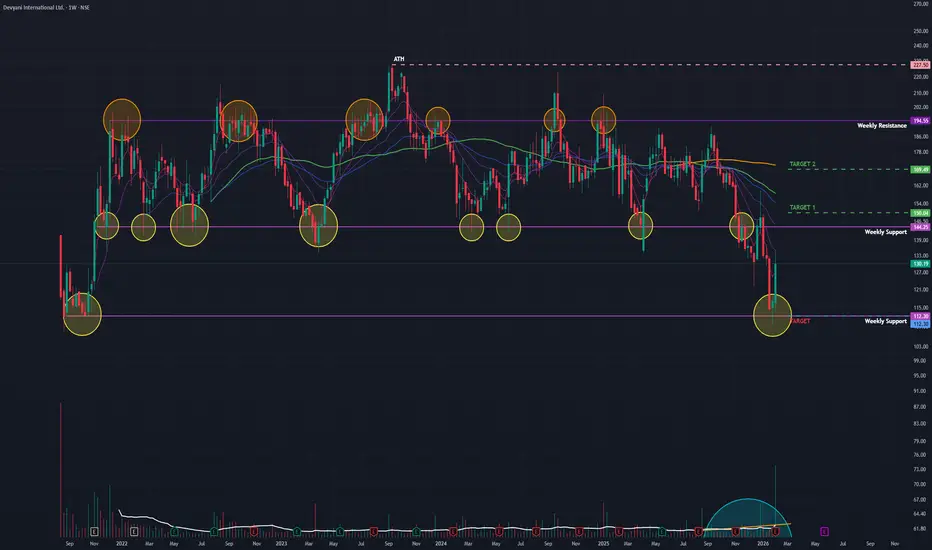
Devyani Int (W): Aggressive Bullish, Turnaround at Major Support(Timeframe: Weekly | Scale: Logarithmic)
The stock has confirmed a major "V-Shape Reversal" from its long-term support zone of ₹110. The surge is backed by "Climax Volume" and a positive reception to its Q3 operational updates, signaling that the 2-year correction might be over.
🚀 1. The Fund
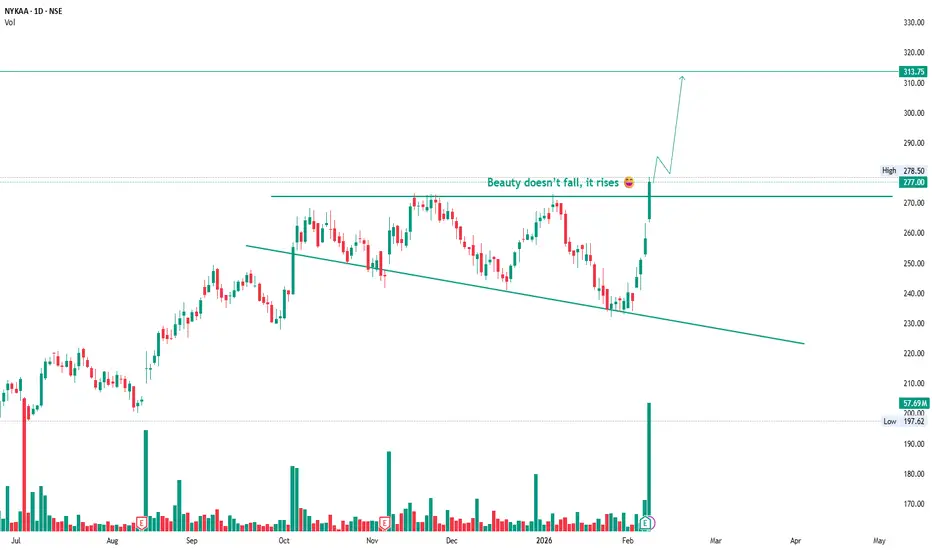
Nykaa: Descending Trendline BreakoutNykaa respected the rising structure even during the correction and never lost its trend strength.
Price held the sloping support, absorbed selling pressure, and then gave a clean breakout above the key horizontal resistance around 277 with strong volume.
This move shows acceptance above resistanc
See all editors' picks ideas
Peak Trading Activity Graphs [LuxAlgo]The Peak Trading Activity Graphs displays four graphs that allow traders to see at a glance the times of the highest and lowest volume and volatility for any month, day of the month, day of the week, or hour of the day. By default, it plots the median values of the selected data for each period. T
Pine Script® indicator

Smart Trader, Episode 03, by Ata Sabanci, Candles and TradelinesA volume-based multi-block analysis system designed for educational purposes. This indicator helps traders understand their current market situation through aggregated block analysis, volumetric calculations, trend detection, and an AI-style narrative engine.
━━━━━━━━━━━━━━━━━━━━━━━━━━━━━━━━━━━━━━━
Pine Script® indicator

Asset Drift ModelThis Asset Drift Model is a statistical tool designed to detect whether an asset exhibits a systematic directional tendency in its historical returns. Unlike traditional momentum indicators that react to price movements, this indicator performs a formal hypothesis test to determine if the observed d
Pine Script® indicator

Hyperfork Matrix🔱 Hyperfork Matrix 🔱 A manual Andrews Pitchfork tool with action/reaction propagation lines and lattice matrix functionality. This indicator extends Dr. Alan Andrews' and Patrick Mikula's median line methodology by automating the projection of reaction and action lines at equidistant intervals, cr
Pine Script® indicator

Arbitrage Matrix [LuxAlgo]The Arbitrage Matrix is a follow-up to our Arbitrage Detector that compares the spreads in price and volume between all the major crypto exchanges and forex brokers for any given asset.
It provides traders with a comprehensive view of the entire marketplace, revealing hidden relationships among d
Pine Script® indicator

Wyckoff Schematic by Kingshuk GhoshThe "Wyckoff Schematic" is a Pine Script indicator that automatically detects and visualizes Wyckoff Method accumulation and distribution patterns in real-time. This professional tool helps traders identify smart money movements, phase transitions, and critical market structure points.
Key Features
Pine Script® indicator

Volume Cluster Profile [VCP] (Zeiierman)█ Overview
Volume Cluster Profile (Zeiierman) is a volume profile tool that builds cluster-enhanced volume-by-price maps for both the current market window and prior swing segments.
Instead of treating the profile as a raw histogram only, VCP detects the dominant volume peaks (clusters) insid
Pine Script® indicator

DeeptestDeeptest: Quantitative Backtesting Library for Pine Script
━━━━━━━━━━━━━━━━━━━━━━━━━━━━━━━━━━
█ OVERVIEW
Deeptest is a Pine Script library that provides quantitative analysis tools for strategy backtesting. It calculates over 100 statistical metrics including risk-adjusted return ratios (Sharpe
Pine Script® library

Arbitrage Detector [LuxAlgo]The Arbitrage Detector unveils hidden spreads in the crypto and forex markets. It compares the same asset on the main crypto exchanges and forex brokers and displays both prices and volumes on a dashboard, as well as the maximum spread detected on a histogram divided by four user-selected percenti
Pine Script® indicator

Multi-Distribution Volume Profile (Zeiierman)█ Overview
Multi-Distribution Volume Profile (Zeiierman) is a flexible, structure-first volume profile tool that lets you reshape how volume is distributed across price, from classic uniform profiles to advanced statistical curves like Gaussian, Lognormal, Student-t, and more.
Instead of forcin
Pine Script® indicator

See all indicators and strategies
Community trends
SW Solar - Bottom FishingCMP 195 on 14.02.26
As can be seen on the chart. There has been a big correction in the stock price in the past months. Presently trading near the lowest prices. If a reversal takes place, may go into a bullish phase ahead.
Possible targets may be 250/450.
The setup fails if it sustains below 170.
What to do in TCS if we are Holding?What to do in TCS if we are Holding?
Market Sentiment :
- Extremely week: Due to AI disruption Theory
Technical:
- Extremely Week: Daily, Weekly, Monthly Lower Lows formation
Should We Enter at this Level?
- No New Entry suggested unless we see Daily close above 20EMA
But I am already Hold
Linde - At ResistanceLinde :
Rectangle Breakout done, retested and broke out
Currently at strong resistance
Looks good above 7100 for possible quick 5 percent move

BUY TODAY SELL TOMORROW for 5% DON’T HAVE TIME TO MANAGE YOUR TRADES?
- Take BTST trades at 3:25 pm every day
- Try to exit by taking 4-7% profit of each trade
- SL can also be maintained as closing below the low of the breakout candle
Now, why do I prefer BTST over swing trades? The primary reason is that I have observed t

VBL – Is their a wedge Breakout- swing trade Scenario...???Varun Beverages Limited;- CMP: 493.80; RSI: 54.95
Trading plan based on the weekly chart of Varun Beverages Limited 🔍Visible Chart Patterns are as belwo
1️⃣ Falling Wedge / Descending Channel
Lower highs + flat to slightly rising lows
This is a bullish reversal / continuation pattern
2️⃣ Base

Avanti Feeds Limited - Breakout Setup, Move is ON...#AVANTIFEED trading above Resistance of 1199
Next Resistance is at 2118
Support is at 880
Here is previous chart:
Chart is self explanatory. Levels of breakout, possible up-moves (where stock may find resistances) and support (close below which, setup will be invalidated) are clearly defined.

#Mahlog after decent recovery #Mahlog after decent recovery on weekly chart
long term view are intact with 20% upside
solid result declared
ADD Till 373 for 468/501

BSE 1 Day Time Frame 📈 Current Price & Daily Price Range (Latest)
Current / Last traded price: ~₹3,025.30 INR
Day’s trading range: ₹3,017.90 – ₹3,127.00
📌 How to Interpret Today’s 1-Day Levels
📍 Bullish levels (upside pressure):
✔ Above Pivot 3,056–3,095 suggests intraday buyer strength
✔ Break & hold above 3,165–3,20

BLUESTAR @1997Not a SEBI registered, just sharing idea. Investment idea BLUESTAR@1997 on the brink of breakout from rounding bottom @2041. Target short term-2500(4--50 days) long term -3500(6-9 month) SL-1940.

INFYINFY
bearish trend is Showing on the chart.
sell signals in
technical indicators and double top chart pattern.
strong support 1200/1250
Disclaimer : The Above shared Content is for information and education purposes only and should not be treated as investment or trading advice. Im not SEB

See all stocks ideas
Tomorrow
EMMBIEmmbi Industries Limited
Actual
—
Estimate
—
Tomorrow
MRCAGROMRC Agrotech Limited
Actual
—
Estimate
—
Tomorrow
PENINDPennar Industries Limited
Actual
—
Estimate
—
Feb 17
AGSTRAAGS Transact Technologies Ltd.
Actual
—
Estimate
—
Feb 19
ABBABB India Limited
Actual
—
Estimate
20.78
INR
Feb 19
CIEINDIACIE Automotive India Ltd
Actual
—
Estimate
5.40
INR
Feb 19
VESUVIUSVesuvius India Ltd
Actual
—
Estimate
—
Feb 19
SANOFICONRSanofi Consumer Healthcare India Limited
Actual
—
Estimate
—
See more events
Community trends
LTC expected moveLTC is moving in ABC pattern and is in a good buying zone for long term...
For education purpose only. No buy sell recommendation.

BTC Reversal or still bearish (13/02/2026).BTC is trading in a parallel channel.
Major Trend :- Bearish
Minor Trend :- Range Bound.
A bearish scalp trade can be taken upto the support levels of the channel. With a SL being a candle closing above the channel.
If there are halt candle near the resistance levels and a BO occurs, a 1000 point

Analysis – Demand Zone Bounce Toward Key Resistance🔎 Market Overview
On the 1-hour timeframe, BTCUSDT (Bybit) shows a strong bullish reaction after forming a short-term bottom near the 65,000 area. Price has broken structure to the upside and is now consolidating above a marked demand zone, suggesting buyers are in control for the short term.
🟢 Key

The could be possible tradeNow here is the why it can happen - so far in the history of bitcoin there has been no low break of a red candle but this time it happened.


Nearly 50% Market Cap Gone in just 120 days📉 From Euphoria to Reality in 4 Months
Nearly 50% Market Cap Gone in just 120 days.
🗓 Oct 7, 2025 — Total Crypto Market Cap: $4.26T
🗓 Feb 6, 2026 — Total Crypto Market Cap: $2.16T
That’s a $2.1 TRILLION wipeout.
And yes… we’ve seen worse.
Let’s zoom out 👇
🔻 2014–2015 Bear Market
• Market cap

BTC 1H🧠 Market Context
Bitcoin has just completed a liquidity sweep after an extended move, tapping into a high-timeframe supply/demand reaction zone. Price action is currently compressing, signaling that we’re approaching a decision point where momentum traders and HTF participants collide.
The recent

Bitcoin Bybit chart analysis FEBURARY 13
Hello
It's a Bitcoin Guide.
If you "follow"
You can receive real-time movement paths and comment notifications on major sections.
If my analysis was helpful,
Please click the booster button at the bottom.
This is a 30-minute Bitcoin chart.
At the bottom left, the purple finger indicates
the fi

Short term Short Bias BTCBTC Abc Move up in Supply Order Block
1. See Reaction from 0.618 FIB
2. Short from around 67k
3. Major Demand Zone still seating under 59K

Crash : the OPPORTUNITY or a TRAPThese are the common crash levels that I have marked
After every crash it has bounced back with atleast 100% of return
I think this crash is also not different it's opportunity that may give a decent return
share your views Is this a opportunity cost ?

See all crypto ideas
SILVER 1HRSWING TRADE
SILVER (XAGUSD) Looking good for Downside..
When it break level 73.77 and sustain.. it will go Downside...
SELL @ 73.77
Target
1st 63.89
2nd 56.48
Enjoy trading traders.. Keep add this STOCK in your watch list..
Big Investor are welcome..
Like this Post??? Hit like button..!!!
Foll
XAUUSD (H1) – Weekly Outlook | LiquidityXAUUSD (H1) – Weekly Outlook | Liquidity Rebuild Before Expansion
Gold has recovered strongly from the sharp sell-off into 4,900 and is now rotating back toward the upper range. The current structure shows a classic liquidity rebuild phase after a stop run — and next week will likely decide whether

Gold View On 1H Time FrameEnter for short on monday opening, tp 4656
It can be 1:40 Risk Reward Ratio, 1% risk of total capital, 40% gain on total capital and then rest is compounding.
Follow For More !!

XAUUSD feb 3rd week, Bullish or bearishThis week Gold against Dollar movement be like, After taking upside External Liquidity taken at 5128, Market aims down at Bearish FVG around 5000 before aiming 5200 this week , inconclusion market may looks in favour for Buyers at he 3rd week of Feb

XAUUSD – Trendline Break and RetestXAUUSD – Trendline Break & Retest: Bearish Signals Emerging | Lana ✨
Gold is showing early signs of structural weakness after breaking below the ascending trendline. The recent rebound appears corrective rather than impulsive, with price now retesting a key sell-side FVG zone near the former trendl

XAUUSD (Gold) | BEST TRADING SETUP | 13th Feb'2026Gold is trading near 4957 with short-term bearish pressure, while the higher timeframe trend remains bullish.
Lower timeframes show selling momentum, indicating a possible correction. However, the overall structure on Daily & Weekly charts still supports buying on dips.
Key Levels
Resistance: 4975

Gold (XAUUSD) – 1H Technical Analysis
Gold has broken a major ascending trendline, signaling a short-term shift from bullish structure to corrective/bearish.
🔎 Market Structure
Clear trendline breakdown after multiple higher lows. Strong bearish impulse from the 5080–5100 resistance zone. Price currently attempting a pullback after s

A-Book vs B-Book: What Every Retail Trader Needs to KnowMost retail CFD traders have never even heard the terms “A-Book” and “B-Book,” yet almost all of them are directly affected by how these models work. Your broker’s choice between the two can change the prices you see, how your orders are filled, and even whether your stop loss gets hit. Let’s break

XAUUSD (4H) Analysis Price is compressing inside a triangle consolidation between rising support and descending resistance.
A strong breakout with candle close & sustain will likely trigger a high-momentum move.
👉 Break above resistance = bullish expansion
👉 Break below trendline = bearish continuation
Volatility load

“Gold Bullish Above 5090 – Key Levels Ahead”Right now, 5090 seems like a strong support for buyers. As long as price stays above this level, buying pressure can continue. Market structure is positive, and buyers are defending small dips around this zone.
If price holds above 5090 with good momentum, gold may move towards 5200, possibly today

See all futures ideas
AUDJPY – Bullish Reversal From Trendline SupportAUDJPY is reacting strongly from a major ascending trendline support on the 1H timeframe. Price swept liquidity below the structure, tapped into the demand zone, and immediately rejected — signaling buyer strength.
we entered long around 108.180, which aligns perfectly with the technicals.
📈 Why T

NZD/JPY – Buy Entry Points📈 NZD/JPY – Buy Entry Points (Structured Plan)
Since you prefer clear trading levels, here is a clean buy setup plan.
🟢 1️⃣ Aggressive Buy (Trend Continuation)
Condition: Price holding above short-term support
Entry: 92.534 (on small pullback)
Stop Loss: 91.937
Target 1: 93.70
Target 2: 94.20

FOREX "PAIRS IN PLAY" Session 33 15 02 26Scanning multiple forex pairs to filter high-quality trade setups. No trades are forced—only structure-based opportunities.
Note: There may be a delay in this video due to upload processing time.
Disclaimer: FX trading involves high leverage and substantial risk, and losses can exceed your initial


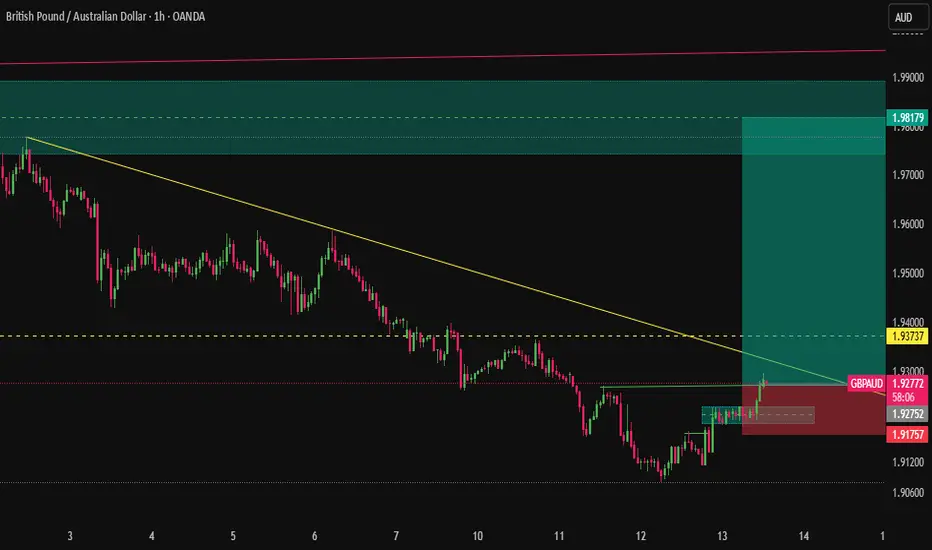
The "High R:R" Power PlayThe tides are turning for GBPAUD. After a prolonged bearish slide, we are witnessing a textbook structural shift on the 1H timeframe.
EURUSD AnalysisThe prices have breached the head & shoulder pattern on the down side.
The pair also resting below the 9 EMA
Prices are expected to test the bullish FVG between 1.1845 & 1.1835, confluence with fib level 0.236

EURUSD - 4H - SHORTFOREXCOM:EURUSD
Hello traders , here is the full multi time frame analysis for this pair, let me know in the comment section below if you have any questions, the entry will be taken only if all rules of the strategies will be satisfied. wait for more Smart Money to develop before taking any pos

See all forex ideas
Trade directly on Supercharts through our supported, fully-verified, and user-reviewed brokers.


