JK Tyre & Industries Ltd – Weekly Chart Breakout WatchJK Tyre & Industries Limited is currently showing strong momentum, and the price action suggests that the stock may be approaching a fresh breakout above the ₹554 level.
Since this analysis is based on the weekly timeframe, the primary focus will be on a weekly breakout and weekly closing above

The best trades require research, then commitment.
Get started for free$0 forever, no credit card needed

Scott "Kidd" PoteetPolaris Dawn astronaut

Where the world does markets
Join 100 million traders and investors taking the future into their own hands.

On the 1H chart, $BNB is forming a Head & ShouldersOn the 1H chart, CRYPTOCAP:BNB is forming a Head & Shoulders after a strong sell-off from the 900+ region.
Left Shoulder: ~785–790
Head: ~728 (marked low on chart)
Right Shoulder: ~770–775
Neckline / Supply Zone: 780–785
Current price is trading below the neckline, which keeps the structure

Varun Beverages: Formation Near Support | Multi-Target Study📄 Description
Varun Beverages is currently trading near a strong long-term support zone around ₹440–₹450, where price has formed a stable base after a prolonged correction.
The chart shows a descending trendline breakout attempt along with consolidation near Fibonacci support (0–0.22 zone), indica

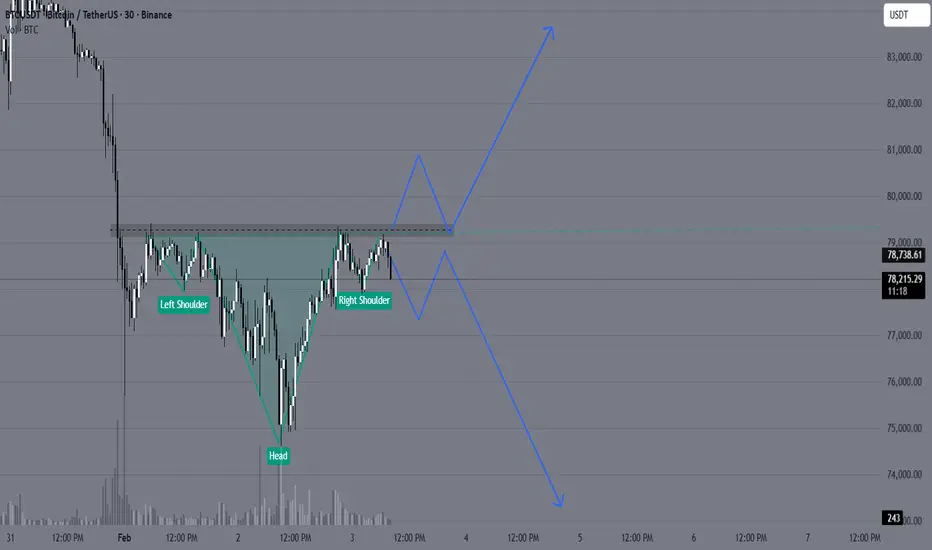
BTCUSD might give Structure Shift Now✅ Pattern: Potential Inverse Head & Shoulders
Look closely:
Left dip → around 76.8k
Deep dip (Head) → around 75k
Right dip → higher low near 76.5k
Now price is pushing back up
This is a classic reversal structure.
✅ Important Level: Neckline Resistance
The dotted zone you marked around:
79,
Texas Instruments breaks into price discovery above ATH1 Trend is constructive and the breakout came after a long base, not a random spike
2 The old high was reached, tested, then broken, now price is in discovery
3 The key is whether the market can hold above the breakout zone and stay accepted there
4 Pattern labels are visual context only, they are n

TRADINGVIEW IS LOOKING FOR A NEW INDIAN REGION MODERATOR!Join Our Team: Exciting Opportunity to Become a Moderator for the Indian Region Community at TradingView!
Hello TradingView Enthusiasts,
Are you passionate about trading and the TradingView platform? We are on the lookout for a new moderator to join our INDIAN REGION Community and help elevate th

Market Outlook & Trade Setup – Monday, 2nd Feb 2026Major indices corrected heavily yesterday during the Budget announcement due to the increase in STT in F&O and no respite in LTCG.
Nifty, Sensex and Bank nifty went minus by almost 500,1200 and 1500 points respectively. We expect the selling to continue further. Additionally, the selling in metals c

PTL Trade SetupCurrent Market Price (CMP): 41.50
Breakout Context: Consolidation breakout confirmed yesterday with strong volume, which adds conviction.
Target: 46.62 (approx. +12.3% from CMP)
Stop Loss: 40.03 (risk of about -3.5% from CMP)
Key Notes
- A breakout with volume often signals genuine momentum, but

KAYNES above 3427 – Breakout or Pullback?KAYNES Technology India has strong long-term earnings growth and good profit and revenue growth over recent years, supported by expanding electronics & EMS market trends.
The stock trades with a relatively high P/E but is backed by a firm order book and industry relevance.
Despite recent volatility

Breakout soon Arman Financial Symmetrical Triangle Breakout Setup
RSI near 60 and rising
Trading above EMA50
Volume increasing
2+ yrs of consolidation
Enter after breakout confirmation!
Disc: for study, DYOR

See all editors' picks ideas
Smart Trader, Episode 03, by Ata Sabanci, Candles and TradelinesA volume-based multi-block analysis system designed for educational purposes. This indicator helps traders understand their current market situation through aggregated block analysis, volumetric calculations, trend detection, and an AI-style narrative engine.
━━━━━━━━━━━━━━━━━━━━━━━━━━━━━━━━━━━━━━━

Asset Drift ModelThis Asset Drift Model is a statistical tool designed to detect whether an asset exhibits a systematic directional tendency in its historical returns. Unlike traditional momentum indicators that react to price movements, this indicator performs a formal hypothesis test to determine if the observed d

Hyperfork Matrix🔱 Hyperfork Matrix 🔱 A manual Andrews Pitchfork tool with action/reaction propagation lines and lattice matrix functionality. This indicator extends Dr. Alan Andrews' and Patrick Mikula's median line methodology by automating the projection of reaction and action lines at equidistant intervals, cr

Arbitrage Matrix [LuxAlgo]The Arbitrage Matrix is a follow-up to our Arbitrage Detector that compares the spreads in price and volume between all the major crypto exchanges and forex brokers for any given asset.
It provides traders with a comprehensive view of the entire marketplace, revealing hidden relationships among d

Wyckoff Schematic by Kingshuk GhoshThe "Wyckoff Schematic" is a Pine Script indicator that automatically detects and visualizes Wyckoff Method accumulation and distribution patterns in real-time. This professional tool helps traders identify smart money movements, phase transitions, and critical market structure points.
Key Features

Volume Cluster Profile [VCP] (Zeiierman)█ Overview
Volume Cluster Profile (Zeiierman) is a volume profile tool that builds cluster-enhanced volume-by-price maps for both the current market window and prior swing segments.
Instead of treating the profile as a raw histogram only, VCP detects the dominant volume peaks (clusters) insid

DeeptestDeeptest: Quantitative Backtesting Library for Pine Script
━━━━━━━━━━━━━━━━━━━━━━━━━━━━━━━━━━
█ OVERVIEW
Deeptest is a Pine Script library that provides quantitative analysis tools for strategy backtesting. It calculates over 100 statistical metrics including risk-adjusted return ratios (Sharpe

Arbitrage Detector [LuxAlgo]The Arbitrage Detector unveils hidden spreads in the crypto and forex markets. It compares the same asset on the main crypto exchanges and forex brokers and displays both prices and volumes on a dashboard, as well as the maximum spread detected on a histogram divided by four user-selected percenti

Multi-Distribution Volume Profile (Zeiierman)█ Overview
Multi-Distribution Volume Profile (Zeiierman) is a flexible, structure-first volume profile tool that lets you reshape how volume is distributed across price, from classic uniform profiles to advanced statistical curves like Gaussian, Lognormal, Student-t, and more.
Instead of forcin

Multi-Ticker Anchored CandlesMulti-Ticker Anchored Candles (MTAC) is a simple tool for overlaying up to 3 tickers onto the same chart. This is achieved by interpreting each symbol's OHLC data as percentages, then plotting their candle points relative to the main chart's open. This allows for a simple comparison of tickers to tr

See all indicators and strategies
Community trends
JK Tyre & Industries Ltd – Weekly Chart Breakout WatchJK Tyre & Industries Limited is currently showing strong momentum, and the price action suggests that the stock may be approaching a fresh breakout above the ₹554 level.
Since this analysis is based on the weekly timeframe, the primary focus will be on a weekly breakout and weekly closing above
Varun Beverages: Formation Near Support | Multi-Target Study📄 Description
Varun Beverages is currently trading near a strong long-term support zone around ₹440–₹450, where price has formed a stable base after a prolonged correction.
The chart shows a descending trendline breakout attempt along with consolidation near Fibonacci support (0–0.22 zone), indica
BUY TODAY SELL TOMORROW for 5% DON’T HAVE TIME TO MANAGE YOUR TRADES?
- Take BTST trades at 3:25 pm every day
- Try to exit by taking 4-7% profit of each trade
- SL can also be maintained as closing below the low of the breakout candle
Now, why do I prefer BTST over swing trades? The primary reason is that I have observed t

Reliance - Interesting price action...Many traders/investors check reliance whenever they want to know the direction of the indexes. Today, we had a gap-up opening due to the positive news(trade talks). What are the important levels if we want to buy?
The price has support at 1390 and 1420. It should show bullish strength at any of thes

Trent Ltd Cmp 3823 Bullish Engulfing Candle @ supportTrent Ltd Cmp 3823 dated 3-2-2026
Weekly chart (Positional)
1. Bullish Engulfing Candle @ support
2. RSI reversal
Buy above 3900 Sl 3600 target 4000-4200-4400-4500
it is just a view, please trade at your own risk.

ATH Breakout Pullback: Smart Money Reloading at Demand Zone?Price has corrected from an all-time high and is now revisiting a high-quality demand zone that played a key role in breaking previous highs. This is not a random pullback — this is a structurally important retest. Let’s decode what the chart is really saying using pure Supply & Demand and Price Act

FOXCONN of India - A overlook on DIXON TECHNSE:DIXON
Hey Folks,
Today we are talking about Dixon Technologies aka foxconn of India. the Q3 results shows +68% in PAT. which looks good as headline numbers. but diving deep I found that Dixon tech slides over a thin margin module as it is high-volume producer to marquee clients and that oper

Berger Paints (W): Neutral-Bullish, Support Defense Pre-Earnings(Timeframe: Weekly | Scale: Logarithmic)
The stock is defending a 3-year critical support zone (₹440–₹450) just days before its Q3 results. While the technical reversal signal (Hammer) is present, the immediate direction will be dictated by the earnings reaction on Feb 5.
🚀 1. The Fundamental

NTPC - Long• Price has moved above the middle Bollinger Band on the weekly chart. This shows the stock is shifting from sideways to bullish.
• The recent weekly candle is strong and moving toward the upper Bollinger Band. This tells us volatility is expanding on the upside, which usually supports further upsi

IOCIOC
bullish trend is Showing on the chart.
buy signals in
technical indicators and
cup with handle & ascending triangle chart pattern.
BUYING RANGE 172/175
Watch for a breakout above 172/175 to sustain the bullish trend. If the resistance holds, there could be a retest towards 150/155 and an upt

See all stocks ideas
Tomorrow
KNRCONKNR Constructions Limited
Actual
—
Estimate
1.49
INR
Tomorrow
ABFRLAditya Birla Fashion and Retail Ltd
Actual
—
Estimate
−0.97
INR
Tomorrow
IMAGICAAImagicaaworld Entertainment Ltd.
Actual
—
Estimate
—
Tomorrow
VARROCVarroc Engineering Limited
Actual
—
Estimate
5.70
INR
Tomorrow
FDCFDC Ltd.
Actual
—
Estimate
—
Tomorrow
ALLCARGOAllcargo Logistics Limited
Actual
—
Estimate
—
Tomorrow
DHANUKADhanuka Agritech Limited
Actual
—
Estimate
7.30
INR
Tomorrow
APLLTDAlembic Pharmaceuticals Limited
Actual
—
Estimate
8.37
INR
See more events
Community trends
On the 1H chart, $BNB is forming a Head & ShouldersOn the 1H chart, CRYPTOCAP:BNB is forming a Head & Shoulders after a strong sell-off from the 900+ region.
Left Shoulder: ~785–790
Head: ~728 (marked low on chart)
Right Shoulder: ~770–775
Neckline / Supply Zone: 780–785
Current price is trading below the neckline, which keeps the structure
BTCUSD might give Structure Shift Now✅ Pattern: Potential Inverse Head & Shoulders
Look closely:
Left dip → around 76.8k
Deep dip (Head) → around 75k
Right dip → higher low near 76.5k
Now price is pushing back up
This is a classic reversal structure.
✅ Important Level: Neckline Resistance
The dotted zone you marked around:
79,
Why Bitcoin’s Stability Is a Warning, Not StrengthBitcoin’s inability to participate in the recent “debasement trade” is not a sign of hidden strength — it’s a sign of waning relevance in the current macro cycle.
While gold and silver surged during the final euphoric phase, Bitcoin’s stagnation near $82,000 suggests that capital actively chose har

The Ugly Truth Behind Cathie Wood's $1.5M Bitcoin Prediction⚠️ The Ugly Truth Behind Cathie Wood's $1.5M Bitcoin Prediction Nobody Talks About (The $1M Bitcoin Trap Exposed)
Cathie Wood Just Predicted $1.5M Bitcoin By 2030. Before You Get Excited, Let Me Show You Something Important.
Her Prediction Track Record:
1️⃣ November 2020: Target: $400K-$500K
2️⃣

BTCUSD/BITCOIN SELL PROJECTION 03.02.26BTCUSD SELL PROJECTION | Market Breakdown Explained
“Let’s break down the current BTCUSD market structure and why the sell bias is still valid.
Bitcoin is clearly trading inside a parallel downtrend channel, showing strong bearish continuation. After a strong impulsive drop, price attempted a pull

ETHUSD SHOWING A GOOD DOWN MOVE WITH 1:8 RISK REWARDETHUSD SHOWING A GOOD DOWN MOVE WITH 1:8 RISK REWARD
DUE TO THESE REASON
A. its following a rectangle pattern that stocked the market
which preventing the market to move any one direction now it trying to break the strong resistant lable
B. after the break of this rectangle it will boost the mark

BTCUSD Reacts From Demand Zone After Strong Bearish MoveBTCUSD has shown a sharp fall from the upper resistance area near 90,500–91,500, where sellers clearly dominated and price failed to hold higher levels. This rejection led to a strong bearish move, confirming a short-term downtrend with consistent lower highs and lower lows. The descending trendline

Btc power house Despite the current downturn, institutional forecasts for the remainder of 2026 remain highly varied but generally optimistic for the long term:

Bitcoin Bybit chart analysis FEBURARY 2Hello
It's a Bitcoin Guide.
If you "follow"
You can receive real-time movement paths and comment notifications on major sections.
If my analysis was helpful,
Please click the booster button at the bottom.
This is Bitcoin's 30-minute chart.
The Nasdaq indicators will be released shortly at 12:0

Rolling moneyRolling money
KING INDICATOR👑
I develop scripts and indicators for TradingView from real work with the market
Not theoretical experiments and not a “magic indicator”.
The scripts published here are intermediate and useful versions, designed to:
Give real value
Illustrate the thinking method
And

See all crypto ideas
SILVER – How Greed and Fear Build Every Market MoveThis chart shows the complete market cycle in real time — not indicators, not theory, but pure price action and human behavior.
First, smart money slowly accumulates in the stealth phase while price moves quietly.
Then institutions step in and price starts trending higher during the awareness phase

Silver - Bear Flag + Rising WedgeSilver (XAGUSD) seems to be forming a Bear Flag & a Rising Wedge on shorter time frames - 4H, 1H, 15Min. Looking to short once the $84-$85 support is broken.

natural gas update after melted like icenatural gas update--- hurdle 303--305 if market sustain above or close above than only looks up side 320--335++ where below 300 looks down fall 276--265+++ strong laxman rekha 245 if market close below than u will see 222--202 soon ---

XAUUSD – Brian | H2 Technical AnalysisXAUUSD – Brian | H2 Technical Outlook – Consolidation & Range-Building Phase
After the recent sharp sell-off, gold is now transitioning into a consolidation phase on the H2 timeframe. The strong bearish impulse has slowed, and current price action suggests the market is shifting from directional mo

(Gold) 45-Minute Chart — Support Hold & Upside Retest Scenario
Chart Analysis:
Market Structure:
Gold is in a short-term corrective phase after a strong bearish impulse. Price made a lower low, then started forming higher lows, suggesting a potential short-term recovery within a broader downtrend.
Key Support Zone (Red):
The marked support around 4,850–4,900

XAUUSD – H2 Technical AnalysisXAUUSD – H2 Technical Outlook: Bullish Structure Rebuild as Precious Metals Surge | Lana ✨
Precious metals are back in focus as silver surges sharply, adding momentum to the broader metals complex. In this context, gold is showing signs of structure rebuilding after a healthy correction, setting th

#XAGUSD⚡ Silver – What Happens Next? ⚡
🥈 Silver began a new impulsive cycle in April 2025, with its 1st wave in October. After a flat corrective 2nd wave (C failure), it surged into a powerful 3rd wave, peaking at $84 on 29 Dec 2025.
📈 The 4th wave followed as another flat correction with strong buying p

XAUUSD – High volatility, monitor key reaction zones.📌 Market Context
Gold is currently trading in a high-volatility environment after a sharp drop below the $5,000 level, reflecting aggressive repricing ahead of major macro uncertainty. The market has shifted away from smooth trend behavior into a liquidity-driven, fast-reaction phase, where price m

What’s Next for Gold?Gold’s sharp rebound from the recent lows has reignited calls for an immediate continuation toward new highs. But the structure tells a more nuanced story.
The rally so far looks less like fresh upside momentum and more like a classic relief move after forced liquidation.
The recent selloff flushe

SILVER1! : Volatility Contraction & Mean Reversion Analysis1. Context & Review (Linking the Past) In our previous analysis Silver Futures: Parabolic Breakdown , we correctly identified the "Bearish Liquidation" event that led to a -17% correction. As predicted, the parabolic arc was violated, and price sought liquidity lower.
2. Current Market Structure:

See all futures ideas
USDCHF – M15 | Sell-Side Purge → Mitigation Rally → ContinuationPrice completed a textbook sell-side liquidity sweep, flushing weak longs below the range. The impulsive push down was real displacement. What followed is a forced bounce, driven by short covering and mitigation, not fresh demand.
Current price is retracing into a discounted supply / imbalance zone

DAILY FOREX SCAN Session – 24 04 02 26Scanning multiple forex pairs to filter high-quality trade setups. No trades are forced—only structure-based opportunities.
Note: There may be a delay in this video due to upload processing time.
Disclaimer: FX trading involves high leverage and substantial risk, and losses can exceed your initial

Expecting EurCHF bearish Why should we trust this idea 💡??Eur has 2.15% interest rate ,while chf is safe heaven currency so
it would shows always significant strength towards chf ,apart from that any Ongoing panic
global events will also cause CHF bullish with aligning the price action parameters by following liquidity 💲⚔

USDJPY Pullback Explained: Trend Support in Focus!For me, USDJPY is still behaving like a healthy uptrend, not a market that is rolling over. Price has been respecting a clear rising channel structure, with buyers consistently defending higher lows.
The recent move lower looks more like a pullback into major trend support rather than a sign of wea

GBPUSD looks bearish for the next few sessions!!ICT Concepts:
- Price swept BSL in Daily timestamp
- IFVG creation on daily showing bearish sentiment
- Daily candle delivering out of CE of the IFVG
- FVG sitting in discount should attract price lower
- Previous breakout region and OB should be the next price targets as mentioned in the chart

EURUSD - MY TRADE ON US OPENAlways Follow Your Set Up Or a+ Trade Set Up So That We Can Get Our Tp Hit Without Any Hustle. - Trade On Your Own Risk, This Is Only My Perspective Of Trade On My Own. Happy Trading Fellas.

GBP/AUD Analysis: Bearish Momentum Accelerates on Hawkish RBAFresh Selling Level_ At CMP
The GBP/AUD currency pair is experiencing significant selling pressure on the 1-hour timeframe as the Australian Dollar strengthens following a hawkish interest rate decision. The pair is currently trading at 1.95423, down approximately 0.58% from the daily open.

EURUSD SlidingI See EURUSD is sliding down with channel.
Fundamentals are also aligned with an Idea.

Long USDCAD Setup Looking to BUY USDCAD. Price is bouncing from a strong support zone with bullish momentum divergence, suggesting a potential reversal higher.

See all forex ideas
| - | - | - | - | - | - | - | - | ||
| - | - | - | - | - | - | - | - | ||
| - | - | - | - | - | - | - | - | ||
| - | - | - | - | - | - | - | - | ||
| - | - | - | - | - | - | - | - | ||
| - | - | - | - | - | - | - | - | ||
| - | - | - | - | - | - | - | - | ||
| - | - | - | - | - | - | - | - | ||
| - | - | - | - | - | - | - | - |
Trade directly on Supercharts through our supported, fully-verified, and user-reviewed brokers.


