JINDALSTEEL | Flag continuationStrong prior impulse, orderly flag structure
-RSI >50, EMAs rising, OBV confirms accumulation
-Sector tailwind: strength in metals
Trade plan:
-Buy > 1100 (volume confirmation required)
-SL: 1030
-Positional target: 1770
-R:R ≈ 1:11

The best trades require research, then commitment.
Get started for free$0 forever, no credit card needed

Scott "Kidd" PoteetPolaris Dawn astronaut

Where the world does markets
Join 100 million traders and investors taking the future into their own hands.

IBEX ltd analysisJAN-2025
1. has got good move and then time correction.
2. Volume is contracting.
3. good momentum score, Good durabilty score.
2. quaterly profit & revenue has increased.
3. EPS has increased.
4. Debt has gone down.has low debt
5. No change in institution holding.
i am managing my risk by stop los

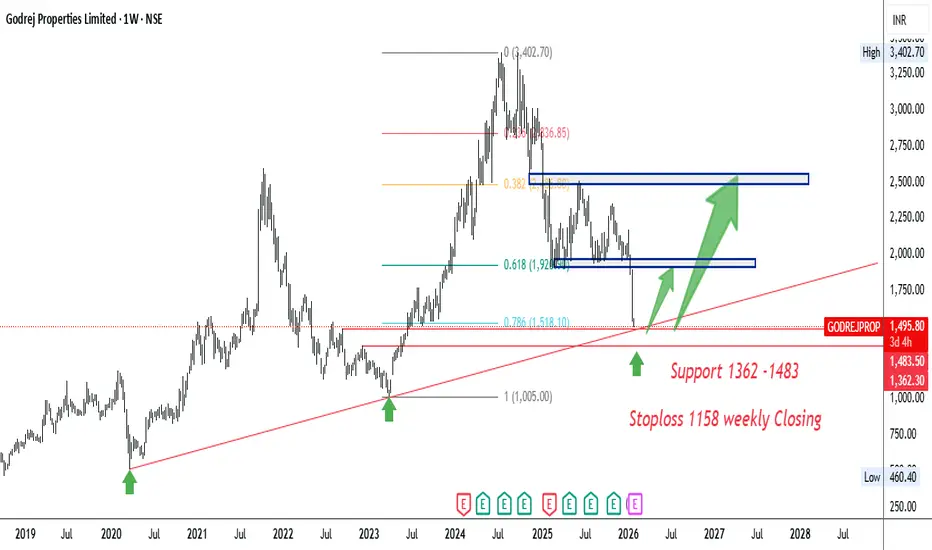
Positional Buy Godrej Properties.Buy Godrej Properties
Strong Retest Support of 1362-1483.
+
Trendline Support
+
Fibo 78.6 Support.
Stoploss 1158 weekly Closing.
Target should be 1900 and 2500
AXISBANK 40% upside possibility in 1-1.5 YearsAXISBANK 40% upside possibility in 1-1.5 Years
Fundamentals - Company has delivered good profit growth of 72.2% CAGR over last 5 years - Best among all Private banks.
Technical - Stock breaking from ATH backed with excellent Results.
LTP - 1325
Targets - 1850+
Timeframe - 1-1.5 Years.
Happy In

TATACONSUMER | Daily TF – RISING WEDGE BreakdownTATACONSUMER is showing short-term weakness after breaking below the rising trendline and failing to hold above 1160.
As long as price stays below this level, the probability increases for a move towards 1120–1100, which aligns with a higher time-frame Bullish Order Block (Demand Zone) and Fibonacc

ANGEL ONE cmp 2515 moving towards fresh 52w low @1808As you can see angel is in VCP pattern and nearest support are 1808 levels only expected it to reach there and this levels can act as good support for long term investment.

Canara Bank daily chartThe chart pattern Upward Parallel channel is seen .
Price is hovering around 20 and 50 EMA. Near term (next few days): Expect consolidation around 150–156.
A breakout above 156.80 could target 160–162, while a drop below 150 might lead to testing 148.
Key levels:
Support: 150 / 148.
Resistance:

UJJIVANSFB: Testing IPO High with Triple Top, Chart of the MonthFrom IPO Highs to Recovery: Is Ujjivan Small Finance Bank Finally Breaking Out After Six Years? After Posting Robust Q3 FY26 Numbers with asset quality improving and Micro Finance Cycle Turning Back. Let's Analyze in "Chart of the Month"
As per the Latest SEBI Mandate, this isn't a Trading/Inves

Bandhan Bank | Long-Term Downtrend | Decision ZoneBandhan Bank continues to trade inside a long-term falling channel, with price now near the lower boundary / support zone (~₹140–150).
This area is critical as it may act as either a base or a breakdown trigger.
🔍 Technical View:
• Strong descending channel intact
• Series of lower highs & lower lo

SILVER (XAGUSD) – Weekly Projection Analysis (24-01-26)
Overall Bias: 🔥 Strong Bullish
🔹 Market Structure
Price is clearly inside a bullish channel
Previous trendline break → clean retest
Retest aligns perfectly with 50% Fibonacci level
👉 This is a high-probability continuation zone
🔹 Key Levels
Support S2: ~96
Support S1: ~99–100
Entry Zone: Br

See all editors' picks ideas
Volume Cluster Profile [VCP] (Zeiierman)█ Overview
Volume Cluster Profile (Zeiierman) is a volume profile tool that builds cluster-enhanced volume-by-price maps for both the current market window and prior swing segments.
Instead of treating the profile as a raw histogram only, VCP detects the dominant volume peaks (clusters) insid

DeeptestDeeptest: Quantitative Backtesting Library for Pine Script
━━━━━━━━━━━━━━━━━━━━━━━━━━━━━━━━━━
█ OVERVIEW
Deeptest is a Pine Script library that provides quantitative analysis tools for strategy backtesting. It calculates over 100 statistical metrics including risk-adjusted return ratios (Sharpe

Arbitrage Detector [LuxAlgo]The Arbitrage Detector unveils hidden spreads in the crypto and forex markets. It compares the same asset on the main crypto exchanges and forex brokers and displays both prices and volumes on a dashboard, as well as the maximum spread detected on a histogram divided by four user-selected percenti

Multi-Distribution Volume Profile (Zeiierman)█ Overview
Multi-Distribution Volume Profile (Zeiierman) is a flexible, structure-first volume profile tool that lets you reshape how volume is distributed across price, from classic uniform profiles to advanced statistical curves like Gaussian, Lognormal, Student-t, and more.
Instead of forcin

Multi-Ticker Anchored CandlesMulti-Ticker Anchored Candles (MTAC) is a simple tool for overlaying up to 3 tickers onto the same chart. This is achieved by interpreting each symbol's OHLC data as percentages, then plotting their candle points relative to the main chart's open. This allows for a simple comparison of tickers to tr

Vdubus Divergence Wave Pattern Generator V1The Vdubus Divergence Wave Theory
10 years in the making & now finally thanks to AI I have attempted to put my Trading strategy & logic into a visual representation of how I analyse and project market using Core price action & MacD. Enjoy :)
A Proprietary Structural & Momentum Confluence System

Per Bak Self-Organized CriticalityTL;DR: This indicator measures market fragility. It measures the system's vulnerability to cascade failures and phase transitions. I've added four independent stress vectors: tail risk, volatility regime, credit stress, and positioning extremes. This allows us to quantify how susceptible markets are

Volatility Risk PremiumTHE INSURANCE PREMIUM OF THE STOCK MARKET
Every day, millions of investors face a fundamental question that has puzzled economists for decades: how much should protection against market crashes cost? The answer lies in a phenomenon called the Volatility Risk Premium, and understanding it may fundam

Volume Gaps & Imbalances (Zeiierman)█ Overview
Volume Gaps & Imbalances (Zeiierman) is an advanced market-structure and order-flow visualizer that maps where the market traded, where it did not, and how buyer-vs-seller pressure accumulated across the entire price range.
The core of the indicator is a price-by-price volume prof

Match Finder [theUltimator5]Match Finder is the dating app of indicators. It takes your current ticker and finds the most compatible match over a recent time period. The match may not be Mr. right, but it is Mr. right now. It doesn't forecast future connection, but it tells you current compatibility for today.
Jokes aside,

See all indicators and strategies
Community trends
Positional Buy Godrej Properties.Buy Godrej Properties
Strong Retest Support of 1362-1483.
+
Trendline Support
+
Fibo 78.6 Support.
Stoploss 1158 weekly Closing.
Target should be 1900 and 2500
AXISBANK 40% upside possibility in 1-1.5 YearsAXISBANK 40% upside possibility in 1-1.5 Years
Fundamentals - Company has delivered good profit growth of 72.2% CAGR over last 5 years - Best among all Private banks.
Technical - Stock breaking from ATH backed with excellent Results.
LTP - 1325
Targets - 1850+
Timeframe - 1-1.5 Years.
Happy In
HDFCBANK Lead the Pre-Budget Rally - Lead Turnover Stock HDFCBANK Lead Turnover Stock Level analysis for 28th JAN 2026
Lead the Pre-Budget Rally.
👇🏼Screenshot: All-day (27th Jan 2026) in 5 min TF..
💥Level Interpretation / description:
L#1: If the candle crossed & stays above the “Buy Gen”, it is treated / considered as Bullish bias.
L#2: Possibi

Hindalco Industries Ltd Stock price will hit 1020-1035Hindalco Industries Ltd is well-positioned for a short-term long trade at ₹962, supported by favorable price and volume action. The setup indicates upside potential toward the ₹1,020–1,035 zone in the near term, making current levels an attractive entry for short-term traders.

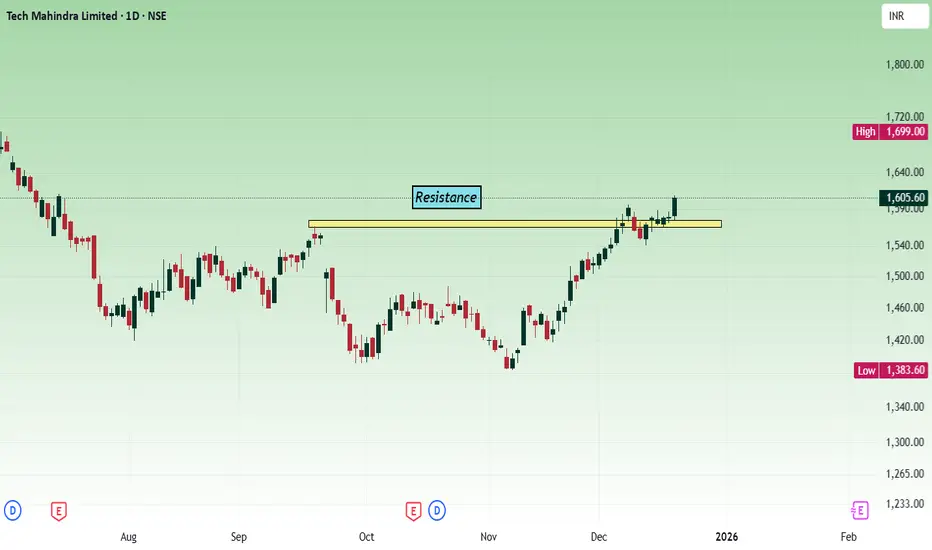
TechM - Multi time frame analysisThe price has broken the resistance at the 1560 - 1580 zone, unable to sustain, fall back and once again took support. Today's movement shows bullish strength.
As per the daily chart, the price has broken the trend line. Strong weekly close will confirm the bullish movement.
Buy above the 1595 - 16
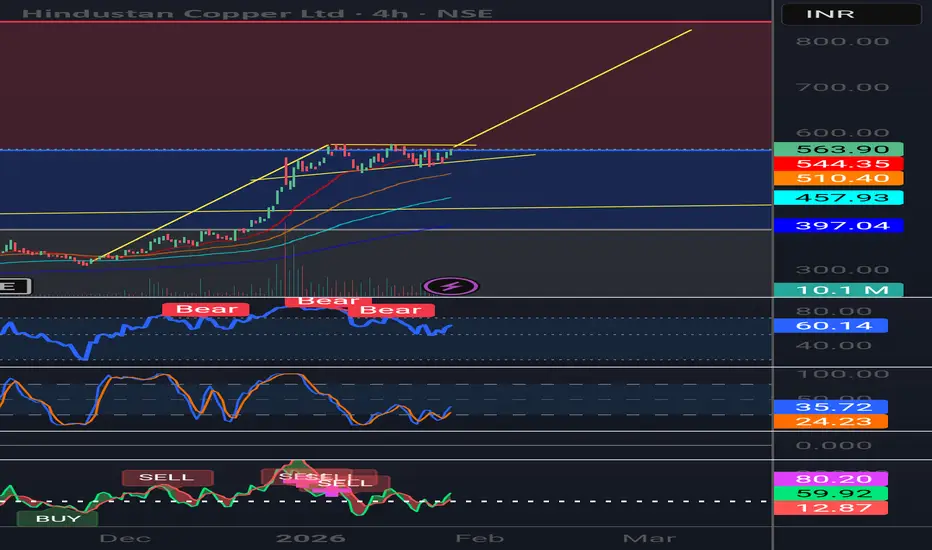
HindCopper to test ATH!!Nifty Metals are in a cyclical bull run. HindCopper has taken a perfect support in a bullish channel. One can plan a long position with an SL below the channel, targetting ATH levels of 670.
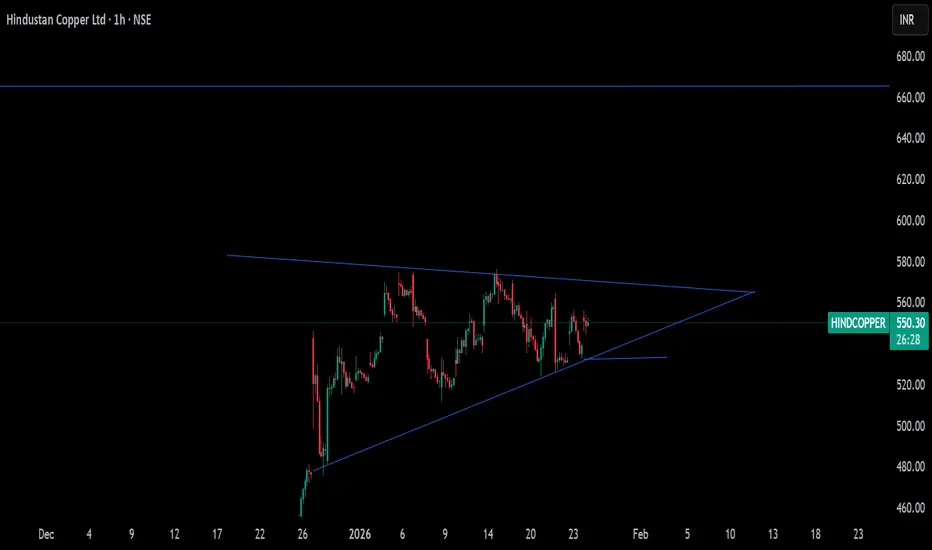
Bullish pennant HindCopperStrong uptrend. Price is consolidating just below resistance (~₹565–570). This looks like a healthy pause after a sharp rally. Expectation: a breakout above ₹570 can lead to a fast move higher; downside remains limited as long as ~₹545 holds.
Next possible targets (on upside):
₹620–630 → first imme
JINDALSTEEL | Flag continuationStrong prior impulse, orderly flag structure
-RSI >50, EMAs rising, OBV confirms accumulation
-Sector tailwind: strength in metals
Trade plan:
-Buy > 1100 (volume confirmation required)
-SL: 1030
-Positional target: 1770
-R:R ≈ 1:11
NSE: EMCURE - Ready for take off?EMCURE is trading near its resistance in Daily/Weekly Timeframe. Last candle shows clear absorption of sellers near the resistance zone. If it comfortably closes above 1600, then it might give a big move. Wait for the confirmation before making a move.
This is not an Investment advice.

Kitex (W): Aggressive Bullish, Political Catalyst + Tech Rev(Timeframe: Weekly | Scale: Logarithmic)
The stock has staged a V-Shape Reversal from a fresh 52-week low, forming a textbook Bullish Hammer on the weekly chart. This technical move is powered by a major political development (joining NDA), which removes significant "Political Risk" from the s

See all stocks ideas
Jan 27
ASIANPAINTAsian Paints Ltd.
Actual
11.05
INR
Estimate
12.33
INR
Today
ECLERXeClerx Services Limited
Actual
—
Estimate
39.18
INR
Today
GVT&DGE Vernova T&D India Limited
Actual
—
Estimate
10.43
INR
Today
LTFOODSLT Foods Limited
Actual
—
Estimate
5.11
INR
Today
VGUARDV-Guard Industries Limited
Actual
—
Estimate
1.40
INR
Today
SBILIFESBI Life Insurance Co. Ltd.
Actual
—
Estimate
6.94
INR
Today
M&MFINMahindra & Mahindra Financial Services Ltd.
Actual
—
Estimate
5.39
INR
Today
CARTRADECarTrade Tech Ltd.
Actual
—
Estimate
13.86
INR
See more events
Community trends
Crypto Altseason UpdateIt is going to come after btc completes its macro target 74k but till then alts gonna bleed hard. be careful in alts.

Bitcoin at Demand: Where Most Traders Panic and Smart Money WaitWhen I look at this chart, I don’t see weakness.
I see price reacting exactly where it should .
Bitcoin is sitting above a clearly defined demand zone, and instead of collapsing, price is slowing down and compressing.
That usually tells me the market is absorbing liquidity, not distributing .
K

BTC Confirms Bearish Structure After Neckline RejectionBTC Confirms Bearish Structure After Neckline Rejection
#Bitcoin has rejected the 94k–98k neckline resistance, confirming a bearish market structure.
➡️ Resistance: 94k–98k
➡️ Supports: 80k → 75k → 70k
Structure shows a confirmed Head & Shoulders Pattern Failed, Followed by a bear flag breakdown,

Bitcoin Bybit chart analysis JENUARY 27Hello
It's a Bitcoin Guide.
If you "follow"
You can receive real-time movement paths and comment notifications on major sections.
If my analysis was helpful,
Please click the booster button at the bottom.
This is a Bitcoin 30-minute chart.
Shortly, there's a Nasdaq indicator release at 12:00 P

BTCUSD Trades Between Demand and Resistance Bearish Structure.BTCUSD is currently trading within a corrective structure after a strong bearish move, clearly respecting a descending trend. Price action shows lower highs and lower lows, confirming short-term bearish control. The marked resistance area near 90,800–91,200 has acted as a selling zone where price pr

BTC 1D UpdateUpdate Jan 26, 2026: BTC rebounds +1.35% to $87,798 after weekend low at $86K, defending wedge support (yellow lines). Upside push testing $88K resistance, but down arrow signals potential rejection targeting $85K/$84K. Volume thin—watch for breakout above $90K or bearish flush.

BTCUSD SHORTBitcoin loading 72000/ soon see only short trades . BTC is in selling zone in weekly time frame.
BTCUSD Sell
Only

BTCUSD ShortBitcoin is in downtrend on 15 mins timeframe. Price can ve shorted at the levels marked after confirmation. Targets mentioned

SOLUSDT SUPPORT AND RESISTANCEI’m bullish on SOL as it’s holding a key weekly support. Price first made a fakeout below the level, swept liquidity, and is now showing signs of a potential rebound. If BTC remains stable, SOL could bounce from this support and move up by around 10%-15%.

Bullish RSI divergence in BTCUSDA Bullish RSI divergence in BTCUSD signaling an upward reversal during a downtrend.

See all crypto ideas
4H Rejection Block & Return to EquilibriumGold (XAUUSD) has rallied aggressively but is now showing signs of exhaustion as it taps into the supply zone around the 5080-5100 level. We are seeing a rejection on the 4H timeframe, suggesting a potential shift in momentum.

Gold 5200/1h ChartGold moving in channel from last 10 days. I believe breaking the 5110 level will put gold to new high of 5200. Although I don't see this happing today. Failing to do so might trigger a profit booking as it has already moved 15% from previous high (+last 7 days green candle closing).
Be vigilant wit

Elliott Wave Analysis – XAUUSD | 27/01/2026
1. Momentum
Daily (D1)
– D1 momentum is currently compressing. This indicates that bullish pressure is still present; however, momentum has weakened, so a potential reversal risk exists.
→ The broader trend remains bullish, but strong corrective moves should be treated with caution.
H4
– H4 momen

XAUUSD SELLAccording to the current conditions, gold may fall downwards. You can short gold after receiving LTF confirmation. People have bought it in a hurry, and gold will only make a new ATH after their stop losses are taken. What I'm saying isn't 100% accurate, but I'm sharing my experience. You should c

XAUUSD – Brian | H3 Technical AnalysisGold has officially broken above the 5,000 level for the first time, confirming a major structural shift on higher timeframes. The breakout reinforces the broader bullish narrative, with price now trading firmly in expansion mode rather than consolidation.
The move above 5,000 reflects sustained sa

Silve is going to moon higher speed than GOLD #xauusdSilve is going to moon higher speed than GOLD #xauusd and this is my next move i analysis from 50 to 100 then 91 to 114 and form next level to next tp of silver as i analysis as of now it takes time and in between a small correction will be possible and then ne xt tp hits of #xagusd
Silve is goin

Gold Trading Strategy for 27th January 2026🟡 GOLD INTRADAY TRADE SETUP (15-MIN TIMEFRAME)
📈 BUY SETUP (Bullish Scenario)
🟢 Buy only if price breaks and closes ABOVE the 15-minute candle high
🔹 Entry Condition:
➡️ Buy Above: 5088
➡️ 15-min candle must close above 5088
🎯 Targets:
🎯 Target 1: 5099 💰
🎯 Target 2: 5110 💰💰
🎯 Target 3: 5125 💰💰💰

It seems silver is going to loose its shine soonSilver (XAGUSD) prices are near all time high, hovering near the VAH logarithmically on monthly chart. Highly cautious period next one or two months. Keep watching !!

XAUUSD – Bullish Continuation, ATH Expansion Still in PlayGold continues to trade within a strong bullish channel, maintaining its ATH expansion structure. The recent pullback is corrective in nature and shows clear signs of liquidity absorption rather than distribution.
On the macro side, sustained USD weakness, safe-haven flows, and a still-cautious Fed

CRUDE OIL Moving towards 6700+CRUDE OIL Moving towards 6700+ after 5 Years ... Are we near the breakout of CRUDEOIL?
Crude OIL MCX is seen rising towards 6700+ Level post correction for 5 Months.
We seen big Rally in 2020-2021 on Crude OIL post COVID - post that we have seen 4 Years of correction on it. Now are we ready for up

See all futures ideas
GBPUSD – Support Holding, Watching Reaction From RangeGBP/USD has reacted from a well-defined support zone, an area where buyers have stepped in multiple times before. Price is currently trading between clear support and resistance, indicating a short-term range environment.
As long as this support holds, upside reactions toward the resistance zone re

USDINR at Key Resistance – Break or Rejection?USDINR is currently trading near the upper boundary of a well-defined rising channel — a zone where price has historically faced strong rejection and profit booking.
This rally has been structural, not random. Price has respected the channel multiple times, creating higher highs and higher lows, sh

GBP/AUD: Corrective Rally, Downtrend IntactGBP/AUD is trading in a clear bearish Elliott Wave structure on the 4H timeframe. The market has already completed a strong impulsive decline and is currently moving in a Wave 4 corrective pullback, which is happening inside a downward channel and near key Fibonacci retracement levels. This correcti

USDCHF trading above Decisive zoneThe USDCHF is currently at a critical "decision zone" after a period of significant volatility. Following a sharp decline earlier this week, price action is now signaling a potential shift in momentum.
1. Key Support Validation
The pair successfully tested a major support zone near 0.7870 – 0.7880.

USDJPY 1W T/F ANALYSIS----
usdjpy 1w t/f analysis---- recent demand will be completed after demand completed we can saw marked supply of top candle are matched here also so we can measure marked supply it`s a full direction now we can go with supply on lower t/f let`s see---

UPDATE on previous EURUSD BULLISH IDEA!The price has claimed the highs which was a major level I marked and presented at :- 1.19206.
The TRADE IDEA is COMPLETE!
Congratulations to whoever took this.

#GBP/AUD Buy Trade Scenario.Here’s an up-to-date GBP/AUD Buy trade outlook (technical + fundamental) to help you assess whether positioning for a Upside makes sense right now.
Thank You......

GBPJPY Weekly Outlook: Short Retest Before Bullish Push to 216.0GBPJPY shows strong bullish momentum after recent highs around 213.92, but expect a minor short recovery first. Market likely retests support at 210.44 or deeper to 208.00 before resuming uptrend targeting 216.00 next week. Chart highlights key levels with recent price action from ~210.84 lows.
Key

EURUSD BUYou can look to buy the EURUSD from here. Volume in the EURUSD is very high. I don't think it will offer a deep pullback. If I get some LTF confirmation from this zone, I will buy it. You can also monitor your risk management.

See all forex ideas
| - | - | - | - | - | - | - | - | ||
| - | - | - | - | - | - | - | - | ||
| - | - | - | - | - | - | - | - | ||
| - | - | - | - | - | - | - | - | ||
| - | - | - | - | - | - | - | - | ||
| - | - | - | - | - | - | - | - | ||
| - | - | - | - | - | - | - | - | ||
| - | - | - | - | - | - | - | - | ||
| - | - | - | - | - | - | - | - |
Trade directly on Supercharts through our supported, fully-verified, and user-reviewed brokers.


