XAUUSDLast day was consolidating and has generated sell side liquidity. There could be possibility the price sweeps that liquidity and then reverse from the Marked Demand zone.
We have Imbalace left in 15M
We have Equal lows. Srong liquidity pool.
Below Eq low we have Demand zone.

The best trades require research, then commitment.
Get started for free$0 forever, no credit card needed

Scott "Kidd" PoteetThe unlikely astronaut

Where the world does markets
Join 100 million traders and investors taking the future into their own hands.

Sona BLW Precision Forgings Ltd. - Weekly chart analysis Trend: Stock is in a long-term downtrend (since late 2024).
Recent Action: Strong bullish candle with high volume, challenging/breaking the downtrend line.
Key Levels:
Resistance: Initial resistance near ₹510-₹520.
Support: Immediate support near the trendline (if it holds) and major support aro

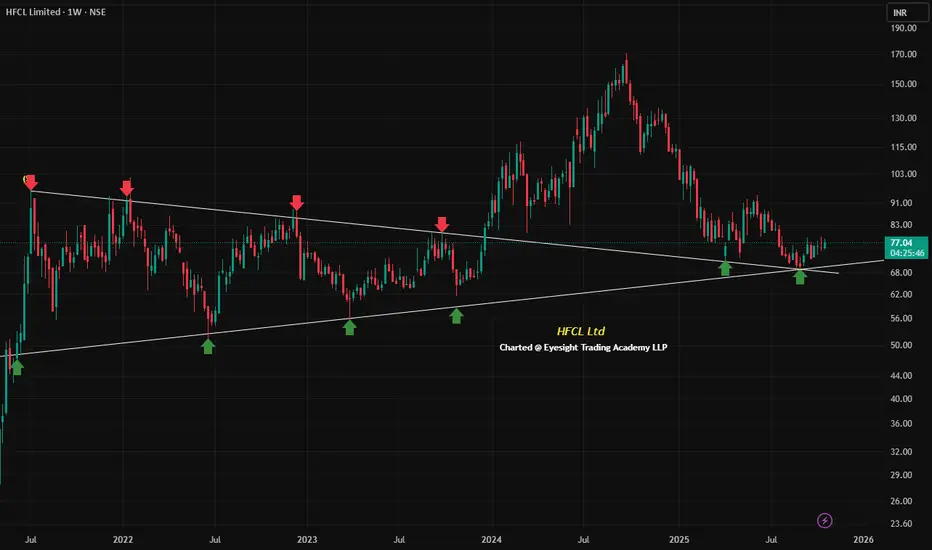
HFCL Technical Snapshot – A Dual Support Setup in PlayHFCL Ltd. is currently trading around ₹77.12 and presenting an interesting technical setup for chart watchers and swing traders. On the weekly timeframe, the stock is attempting to respect two key support zones simultaneously:
🟢 Weekly trendline support: This trendline has held firm across multiple
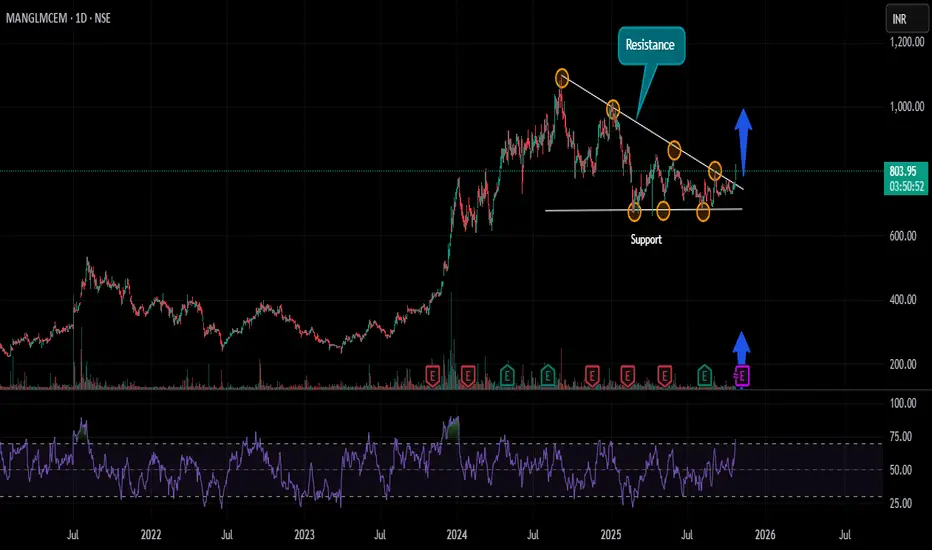
MANGALAM CEMENT : DECENDING TRAINGLE BREAKOUT The stock of Mangalam Cement is consolidating from Sept 2024 , taking support at 680 multiple times with decending traingle formation . On 23 Oct , the stock came out of this consolidation with good volume.
If the stock stays above 760 , move towards 880 and 1000 is possible in near term.
The RSI
BUY TODAY SELL TOMORROW for 5% DON’T HAVE TIME TO MANAGE YOUR TRADES?
- Take BTST trades at 3:25 pm every day
- Try to exit by taking 4-7% profit of each trade
- SL can also be maintained as closing below the low of the breakout candle
Now, why do I prefer BTST over swing trades? The primary reason is that I have observed t
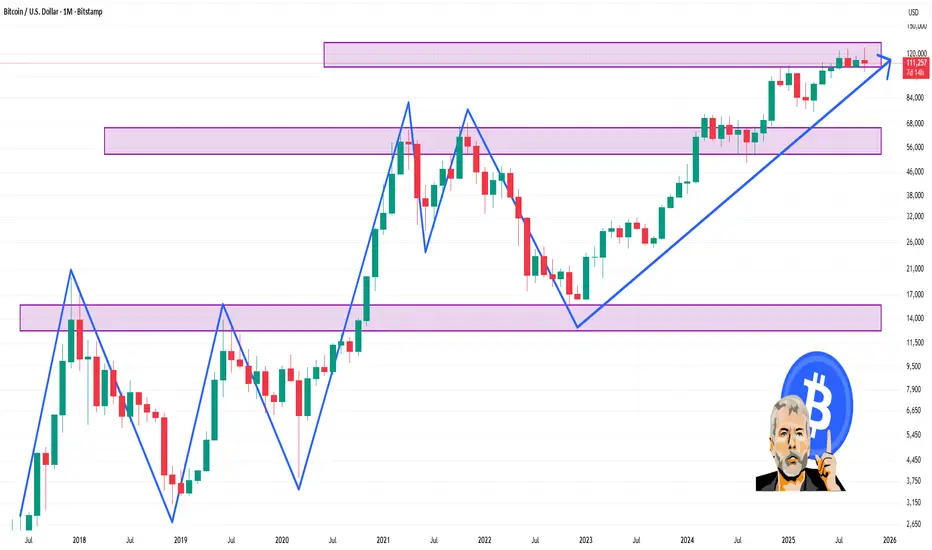
Bitcoin – Buying the Trendline, Not the HypeBitcoin (BTCUSD) continues to respect its rising trendline structure , showing consistent demand on every retest. This type of price action often reveals where smart money is quietly adding positions, not chasing, but accumulating near support.
Each of the highlighted points shows how price has

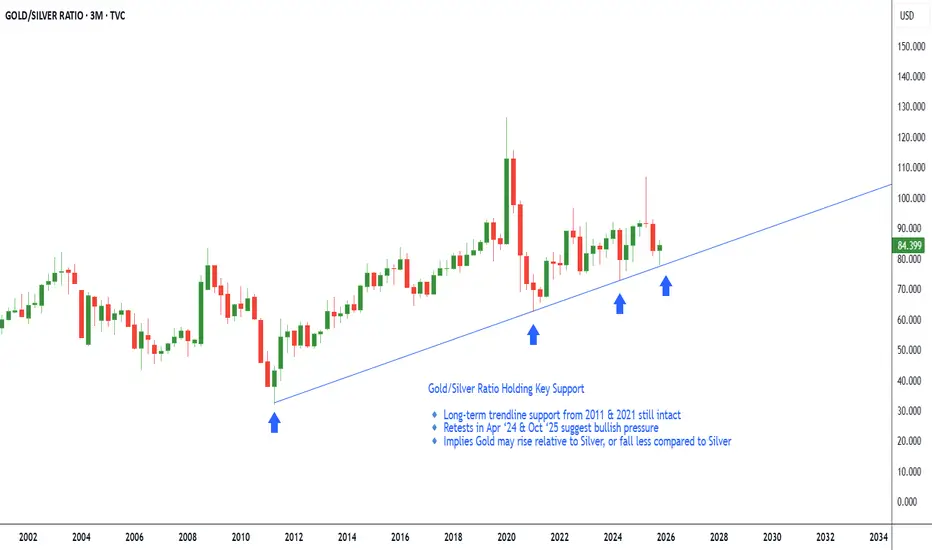
GSR Key Support Retested – Gold May Outperform SilverGold/Silver Ratio – Watching Key Support on Quarterly Chart
Gold/Silver Ratio represents how many ounces of silver are needed to purchase one ounce of gold. It is a classic measure of relative value between the two precious metals.
Generally, a rising ratio means gold is outperforming silver i.e
Elliott Wave Analysis – XAUUSD (October 22, 2025)
🔹 1. Momentum
D1:
The D1 momentum is preparing to turn bullish, signaling the start of a new upward trend.
→ We can expect at least 3–5 consecutive bullish days ahead.
H4:
We need to wait for the H4 candle to close to confirm the reversal signal.
If confirmed, there’s a strong possibility that tod

AdityaBirlaCapital - Investment IdeasAditya Birla Capital Ltd - Technical Analysis
Simple Technical Analysis Summary
Aditya Birla Capital is breaking out from a multi-year resistance zone with a classic and perfect rounding bottom pattern playing out on the monthly timeframe.
Fibonacci targets have been activated!
Key Technical Obse

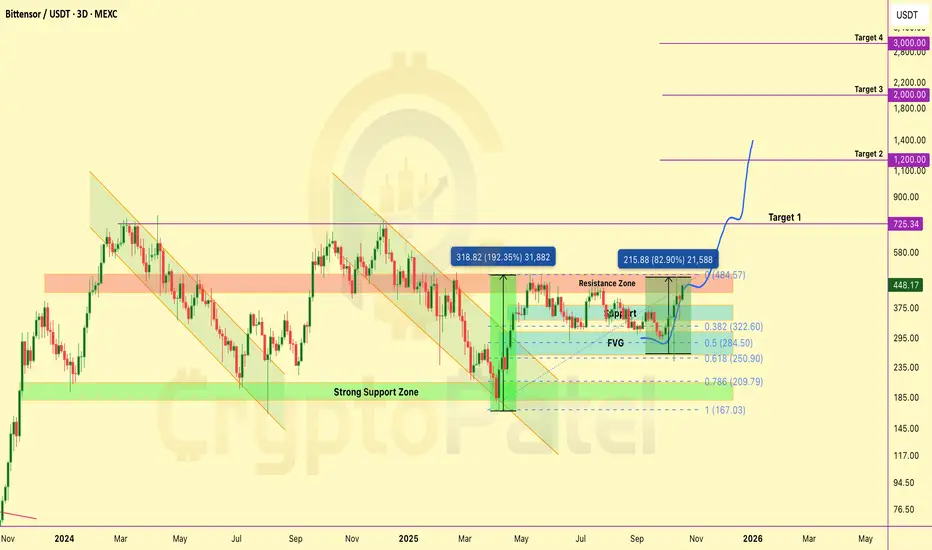
$TAO: +80% IN 14 DAYS - INSTITUTIONAL ACCUMULATION PLAYGETTEX:TAO : +80% IN 14 DAYS - INSTITUTIONAL ACCUMULATION PLAY
Performance Update:
Entry execution: +80% unrealized gains
Institutional bid confirmed (Grayscale allocation)
Position Framework:
Entry Zones:
Primary: $180-$200 ✅
Secondary: $250-$300 ✅
Profit Targets: → $750 → $1,200 → $2,000 (6.6x →
See all editors' picks ideas
Adaptive Volume Delta Map---
📊 Adaptive Volume Delta Map (AVDM)
What is Adaptive Volume Delta Map (AVDM)?
The Adaptive Volume Delta Map (AVDM) is a smart, multi-timeframe indicator that visualizes buy and sell volume imbalances directly on the chart.
It adapts automatically to the best available data resolution

Dynamic Equity Allocation Model"Cash is Trash"? Not Always. Here's Why Science Beats Guesswork.
Every retail trader knows the frustration: you draw support and resistance lines, you spot patterns, you follow market gurus on social media—and still, when the next bear market hits, your portfolio bleeds red. Meanwhile, institution

First Passage Time - Distribution AnalysisThe First Passage Time (FPT) Distribution Analysis indicator is a sophisticated probabilistic tool that answers one of the most critical questions in trading: "How long will it take for price to reach my target, and what are the odds of getting there first?"
Unlike traditional technical indicators

PongExperience PONG! The classic arcade game, now on your charts!
With this indicator, you can finally achieve your lifelong dream of beating the Markets. . . at PONG!
Pong is jam-packed with features! Such as:
2 Paddles
A moving dot
Floating numbers
The idea of a net
This indicator is solel

Options Max Pain Calculator [BackQuant]Options Max Pain Calculator
A visualization tool that models option expiry dynamics by calculating "max pain" levels, displaying synthetic open interest curves, gamma exposure profiles, and pin-risk zones to help identify where market makers have the least payout exposure.
What is Max Pain?
Max

Volume Profile 3D (Zeiierman)█ Overview
Volume Profile 3D (Zeiierman) is a next-generation volume profile that renders market participation as a 3D-style profile directly on your chart. Instead of flat histograms, you get a depth-aware profile with parallax, gradient transparency, and bull/bear separation, so you can see w

RiskMetrics█ OVERVIEW
This library is a tool for Pine programmers that provides functions for calculating risk-adjusted performance metrics on periodic price returns. The calculations used by this library's functions closely mirror those the Broker Emulator uses to calculate strategy performance metrics (

Simple Decesion Matrix Classification Algorithm [SS]Hello everyone,
It has been a while since I posted an indicator, so thought I would share this project I did for fun.
This indicator is an attempt to develop a pseudo Random Forest classification decision matrix model for Pinescript.
This is not a full, robust Random Forest model by any stretch o

Tick CVD [Kioseff Trading]Hello!
This script "Tick CVD" employs live tick data to calculate CVD and volume delta! No tick chart required.
Features
Live price ticks are recorded
CVD calculated using live ticks
Delta calculated using live ticks
Tick-based HMA, WMA, EMA, or SMA for CVD and price
Key tick levels (S

analytics_tablesLibrary "analytics_tables"
📝 Description
This library provides the implementation of several performance-related statistics and metrics, presented in the form of tables.
The metrics shown in the afforementioned tables where developed during the past years of my in-depth analalysis of various str

See all indicators and strategies
Community trends
Camlin Fine Sciences Ltd – Trendline Breakout from Demand Zone 📈 Camlin Fine Sciences Ltd – Trendline Breakout from Demand Zone | 🟡 Quarterly Volume Spike
🧠 Educational Analysis
Camlin Fine Sciences (NSE:CAMLINFINE) has been consolidating within a broad demand zone, following an extended decline from its prior swing highs.
This week’s price action shows a bre

MANGALAM CEMENT : DECENDING TRAINGLE BREAKOUT The stock of Mangalam Cement is consolidating from Sept 2024 , taking support at 680 multiple times with decending traingle formation . On 23 Oct , the stock came out of this consolidation with good volume.
If the stock stays above 760 , move towards 880 and 1000 is possible in near term.
The RSI
HFCL Technical Snapshot – A Dual Support Setup in PlayHFCL Ltd. is currently trading around ₹77.12 and presenting an interesting technical setup for chart watchers and swing traders. On the weekly timeframe, the stock is attempting to respect two key support zones simultaneously:
🟢 Weekly trendline support: This trendline has held firm across multiple
BUY TODAY SELL TOMORROW for 5%DON’T HAVE TIME TO MANAGE YOUR TRADES?
- Take BTST trades at 3:25 pm every day
- Try to exit by taking 4-7% profit of each trade
- SL can also be maintained as closing below the low of the breakout candle
Now, why do I prefer BTST over swing trades? The primary reason is that I have observed that

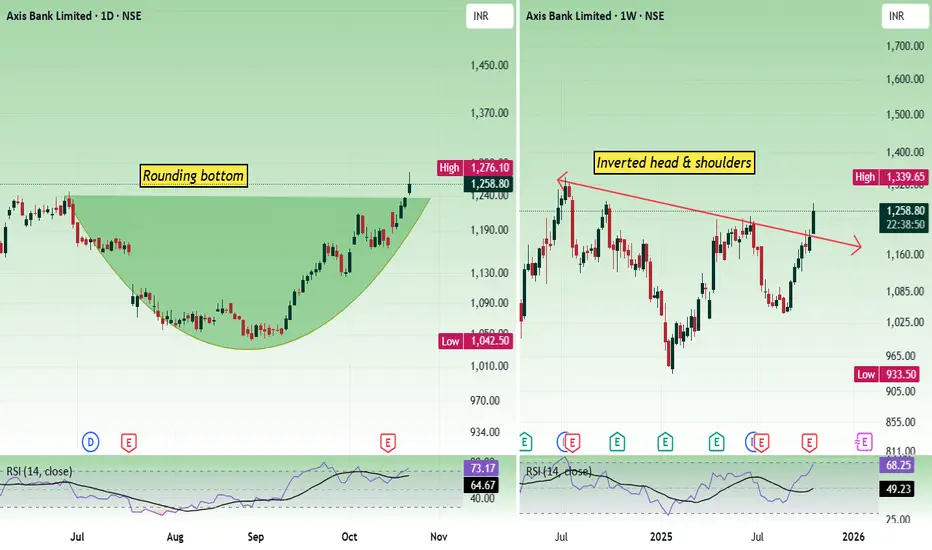
Axis bank - Multi time frame analysisIn the daily time frame, the price has formed a rounding bottom pattern. In the weekly time frame, the price has formed an inverted head and shoulders pattern. Both are bullish patterns.
As long as the price is sustained above 1200, bulls have the chance to move the price up.
Price can bounce from t
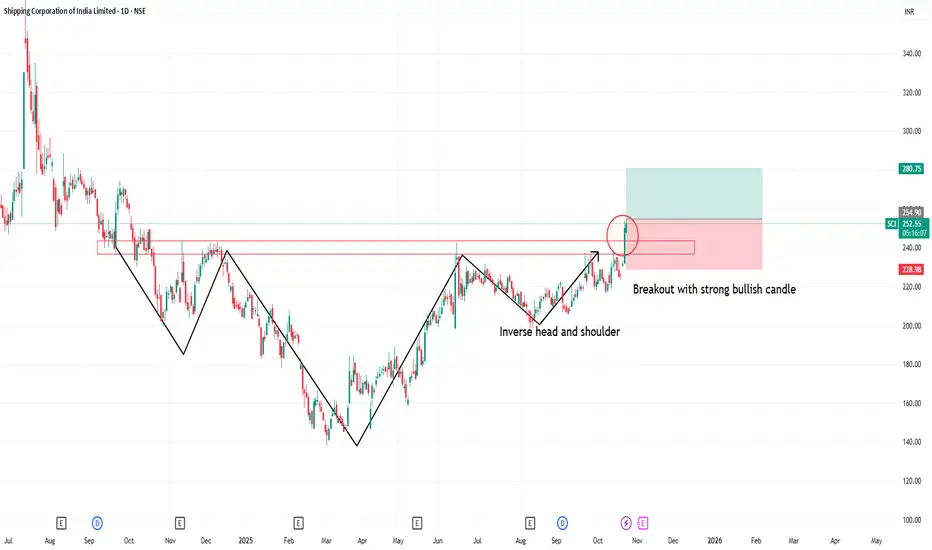
Strong breakout in SCI (Inverse head and shoulder )Strong breakout in SCI
Inverse head and shoulder pattern breakout
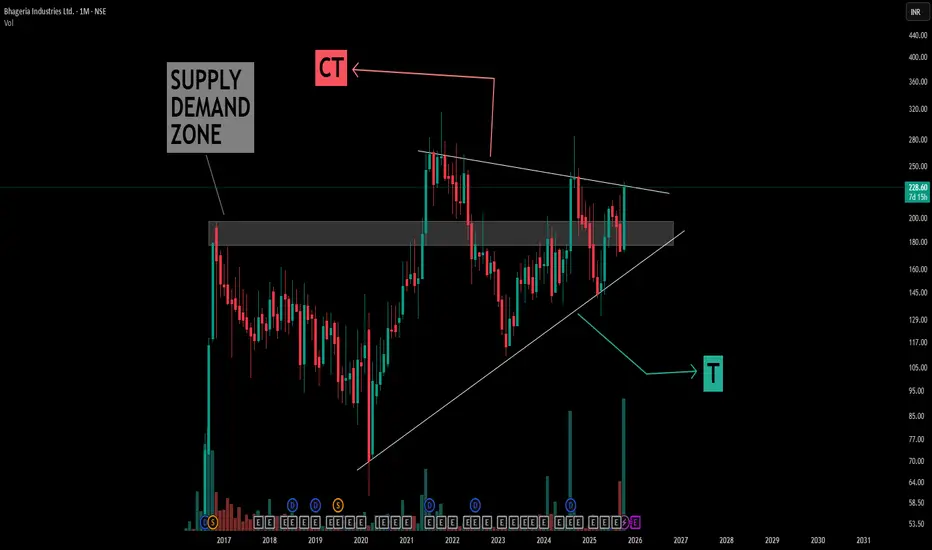
Understanding Symmetrical Triangle Patterns in depthThis chart illustrates a classic example of a symmetrical triangle pattern formed over several years, with simple compression trendline (CT) and trigger (T) lines drawn in white for clarity.
Key learning points from the structure:
- Symmetrical Triangle Formation: The pattern is defined by convergi
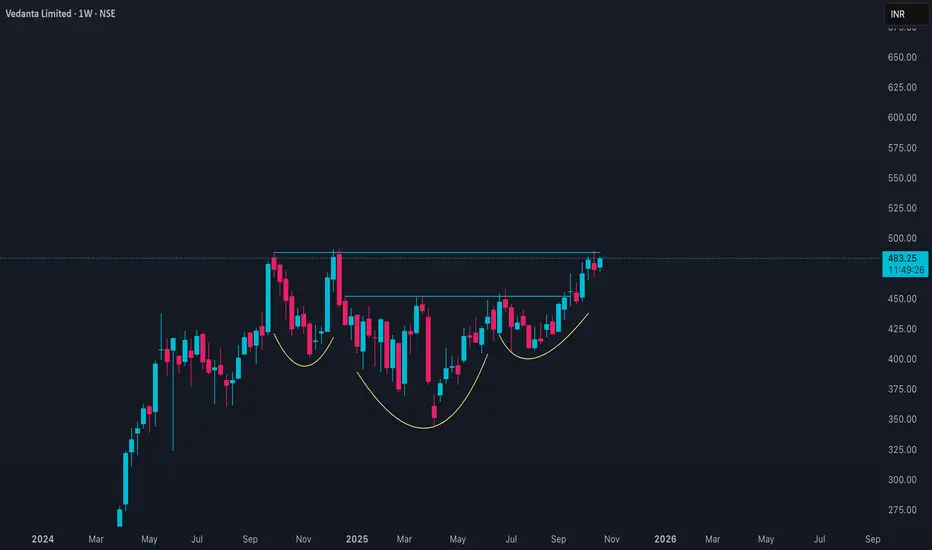
VEDL Price ActionAs of October 23, 2025, **Vedanta Limited (VEDL)** closed at around **₹483.25**, up approximately **1.6%** from the previous close near ₹475.65. The stock traded within a range of ₹474.65 to ₹484.85 during the day, reflecting sustained buying interest and moderate volatility.
Vedanta's market capit
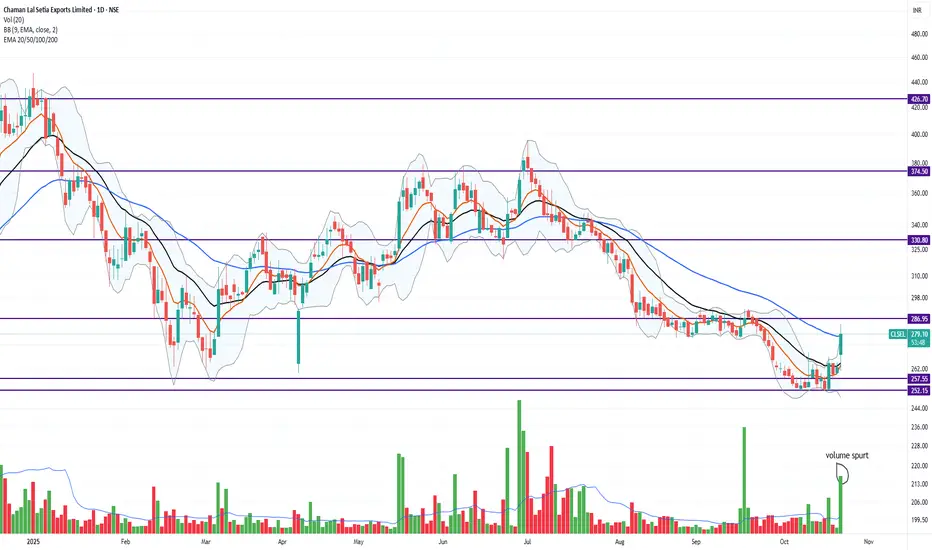
Stock where Promoter, DII and FII increasing StakeIntroduction:
Chaman Lal Setia Exports Limited (CLSE) was incorporated in Amritsar, Punjab in 1994 by Mr. Chaman Lal Setia and his sons. It’s one of the oldest Rice Millers cum Exporters of Basmati rice of all varieties from India.
The company is engaged in the business of milling and processi
Torrent Power - Short Term Investment IdeasTorrent Power Limited - Technical Analysis Report
Current Market Price: 1,328.40
Opportunity: The Stock is Trading at 40% discount to intrinsic value, presenting a potential value investment in the #Integrated #powersector.
Technical Setup: Stock testing critical 20 #EMA support on monthly timefr

See all stocks ideas
Today
DRREDDYDr. Reddy's Laboratories Ltd.
Actual
—
Estimate
16.99
INR
Today
TRIDENTTrident Limited
Actual
—
Estimate
—
Today
BAJAJ_AUTOBajaj Auto Limited
Actual
—
Estimate
87.28
INR
Today
KRYSTALKrystal Integrated Services Ltd.
Actual
—
Estimate
—
Today
N
NAZARANazara Technologies Ltd.
Actual
—
Estimate
−0.09
INR
Today
STYLAMINDStylam Industries Limited
Actual
—
Estimate
22.10
INR
Today
INFIBEAMInfibeam Avenues Ltd.
Actual
—
Estimate
0.20
INR
Today
AARTIDRUGSAarti Drugs Limited
Actual
—
Estimate
4.90
INR
See more events
Community trends
Here me out $JTOThat's the idea
JITO is the MEV engine of Solana. They have a great frywheel. JITO SOL is gaining prominence via institutional adoption. It helps them have more say in validated decisions, which allows them to route their bundles and soon their BAM-enabled application control execution transactions

$LTC ACCUMULATION PHASE IS OVER: Ready to $500?🚨 CRYPTOCAP:LTC ACCUMULATION PHASE IS OVER 🚨
✅ Strong bounce from 7-YEAR trend line support
✅ Soon Break out 4-YEAR descending wedge
✅ Re-accumulation zone: COMPLETE
1️⃣ Target 1: $216 (+129%)
2️⃣ Target 2: $388 (+311%)
3️⃣ Target 3: $532 ALL-TIME HIGH (+464%)
👉 Last time this pattern played ou

Bitcoin Bybit chart analysis October 23
Hello
It's a Bitcoin Guide.
If you "follow"
You can receive real-time movement paths and comment notifications on major sections.
If my analysis was helpful,
Please click the booster button at the bottom.
This is Bitcoin's 30-minute chart.
There's a Nasdaq release coming up at 11:00 AM.
At

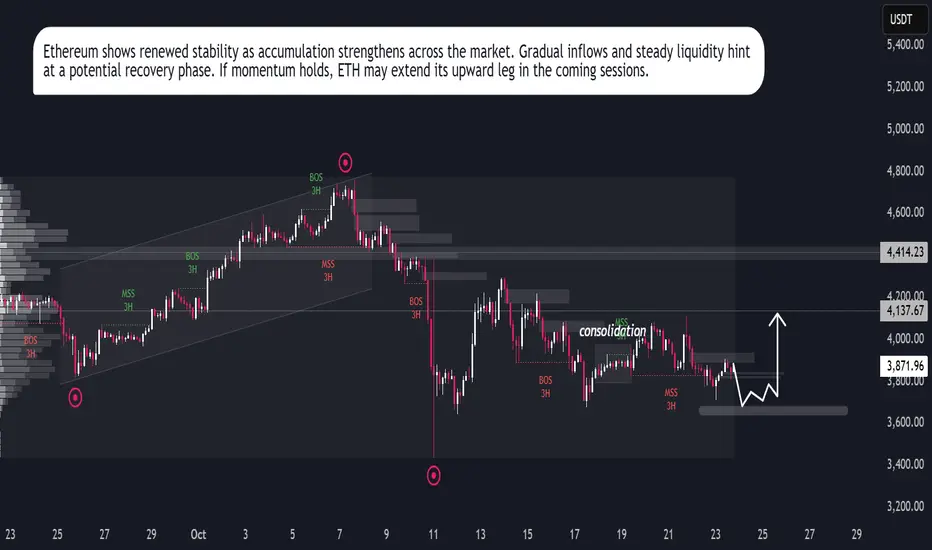
ETH Eyes Upside RunEthereum shows signs of regaining strength after a prolonged corrective phase. The asset is currently stabilizing, supported by gradual inflows from institutional participants and renewed investor accumulation. Market behavior indicates controlled volatility, suggesting a preparation phase before a

BTC/USDT (Bitcoin vs Tether).....BTC/USDT (Bitcoin vs Tether) on the 1-hour timeframe (Binance).
Here’s what the technicals show:
A clear ascending trendline has been broken downward.
Price is retesting the broken support (now resistance) around 108,800–109,000.
There’s a bearish continuation setup after the sharp drop from the

Corrective Rise Up | Daily chartBitcoin seems to be forming a diametric pattern and we've entered Wave F
Wave F itself will be a corrective leg and is related in price to Wave B.
Long positions could be taken on dips.
The move will be invalidated below 103,500

ZEC has broken and retest trendline can reach very soon to 212 $ZEC has broken and retest trendline can reach very soon to 212 $ in upcoming days. this confidence comes from multiple rejection at top. This is not a financial advice for taking traded, be responsible for your trade.

BTCMarket Structure
A clear Break of Market Structure (BMS) occurred to the upside, confirming a shift from bearish to bullish momentum.
The chart shows a sequence of Higher Highs (HH) and Higher Lows (HL) — classic uptrend confirmation.
The latest HH was formed around 111,800–112,000, and price is

BTC 1 Month Time Frame 📊 1-Month Price Overview
Current Price: $110,933 USD
1-Month Change: Approximately -1.60%
Recent High: $126,272 USD on October 5, 2025
Recent Low: $103,632.70 USD
Average Price: $114,099 USD
🔮 Market Sentiment & Forecast
Analyst Sentiment: Despite recent declines, the overall sentiment remain
See all crypto ideas
XAGUSD (Silver/USD) 1-hour chart...XAGUSD (Silver/USD) 1-hour chart, here’s what I can observe and infer about potential target levels:
---
🔍 Chart Summary:
My using Ichimoku Cloud and trendlines.
Price is currently around $49.10.
The chart shows two target points drawn:
1. First Target Point: Around $51.90 – $52.00
2. Secon

A possible Sell Entry and a bullish trend after thatA possible Sell Entry and a bullish trend after that.


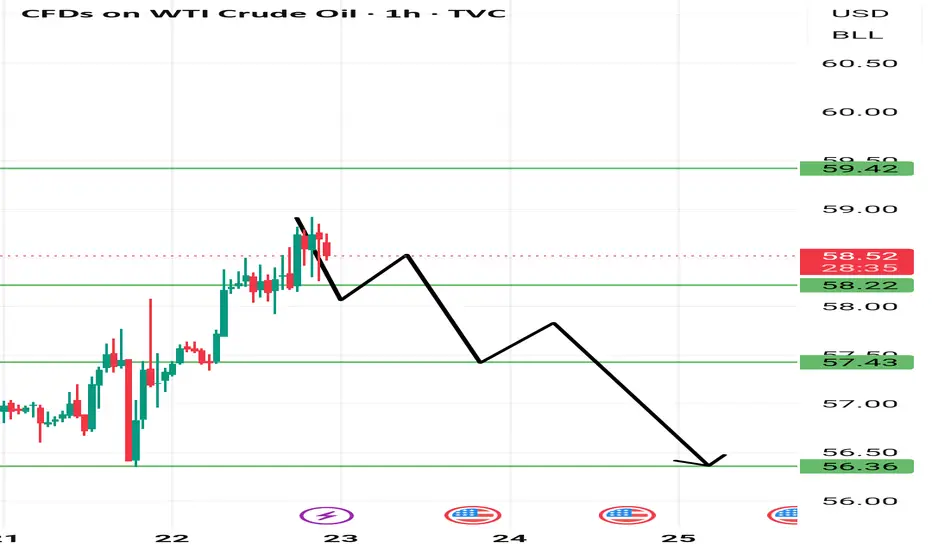
USOIL shortUs oil is in downtrend on hourly time frame. The price is at a key level at 200 ema hourly. Good short opportunity. Tp1 and tp2 are marked
GOLD - ENTERS COREECTION PHASESymbol - XAUUSD
Gold is currently undergoing a corrective phase following approximately six weeks of aggressive upward movement. Price action is forming a consolidation range while continuing to pressure the support zone.
The recent record breaking rally became overheated, prompting profit-taking

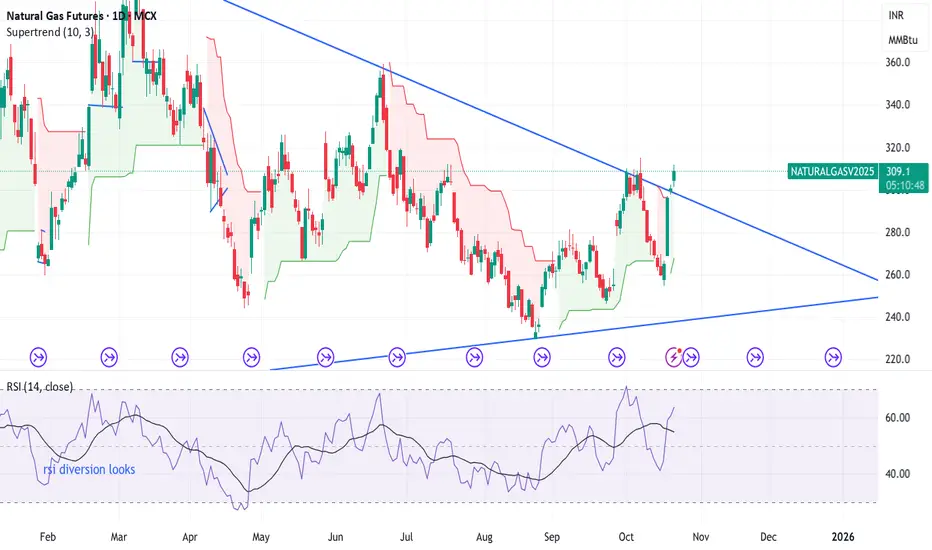
natural mcx update after triangle breakout mcx natural gas triangle breakout ------- on daily chart seen clear break triangle pattern or now looks prices up side till 330--345--360++++ very soon here .
trading ideas---- aggressive trader can buy with closing base sl 298 or let see where lvl to move
XAUUSDWe have a consolidation at the bottom of the week. Selling momentum is down.
Friday could be reversal. Taking out the previous week low liquidity and then reversal.

In depth analysis on XAUUSD: 23/10/25It will be a detailed analysis of XAUUSD after a deep fall in prices. There is confusion in the market, and this chart will turn this chaos into clarity for all.
3 types of setups are shared with all possible trends. This leaves no room for confusion.

GOLD SHOWING A GOOD UP MOVE WITH 1:10 RISK REWARD GOLD SHOWING A GOOD UP MOVE WITH 1:10 RISK REWARD
DUE TO THESE REASON
A. its following a rectangle pattern that stocked the market
which preventing the market to move any one direction now it trying to break the strong resistant lable
B. after the break of this rectangle it will boost the market

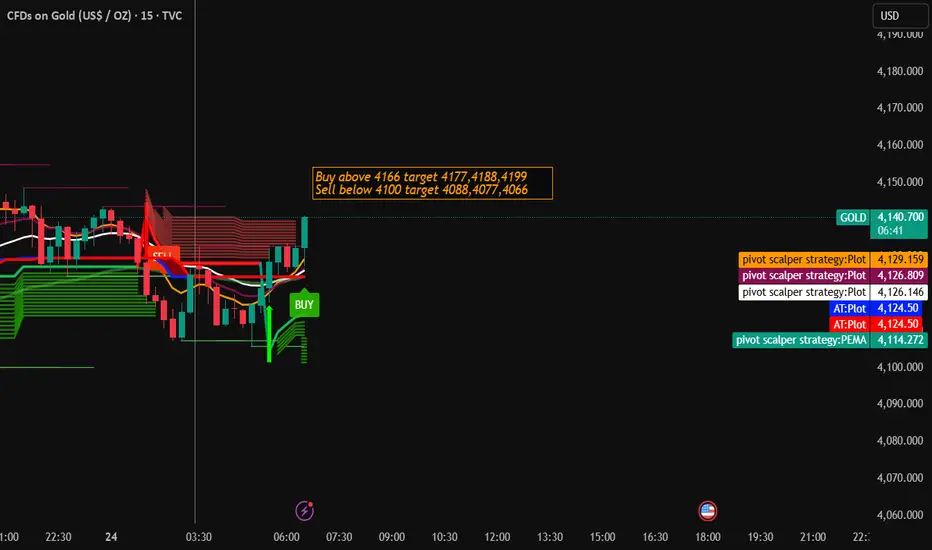
Gold Trading Strategy for 24th October 2025📊 TVC:GOLD (XAUUSD) INTRADAY TRADE SETUP
🟢 BUY SETUP:
🔹 Entry: Buy above the high of the 15-minute candle if it closes above $4166
🎯 Targets:
➡️ T1: $4177
➡️ T2: $4188
➡️ T3: $4199
🛡️ Stop Loss: Below $4155 (or as per your risk tolerance)
🔴 SELL SETUP:
🔹 Entry: Sell below the low of the 1-hou
See all futures ideas
EUR/USD (Euro vs US Dollar) chart on the 2-hour timeframe...EUR/USD (Euro vs US Dollar) chart on the 2-hour timeframe, here’s a detailed breakdown of what my setup is showing and the likely target levels 👇
---
🧭 Chart Overview:
Current price: ≈ 1.1608
My using Ichimoku Cloud, trendlines, and measured move projections.
The chart shows a breakout from a

EURUSD MULTI TIME FRAME ANALYSISHello traders , here is the full multi time frame analysis for this pair, let me know in the comment section below if you have any questions , the entry will be taken only if all rules of the strategies will be satisfied. wait for more price action to develop before taking any position. I suggest yo

EURCAD - APPROACHES KEY LIQUIDITY ZONESymbol - EURCAD
EURCAD is currently undergoing a correction towards a key liquidity zone within the context of a broader and well established bullish trend. The question remains - will the bulls step in around the 1.6175 area?
EURCAD is retracing toward a strong support zone near 1.6175, contribut

GBP-USD AnalysisGBP-USD is in a Channel in 1-Hr TF and if it Breaks the FVG Area then Target Supply may be Achieved and that to strong Up Move or Reversal as the Target Supply Area is in a Strong Support Zone.

USDCHF Long SetupPrice has formed a session low within the previous weekly low, creating a strong support area. This low also aligns with the Psychological Line, adding confluence and increasing the probability of a bullish reaction.
📊 Confluences:
Session Low inside Previous Weekly Low
Within Psychological Line


Buy Trade - EUR/AUDGreetings to everyone!
You can place a buy trade on EUR/AUD and check out my chart for the ideal entry, stop-loss & target placement.
Remember :-
* Move your SL to breakeven once the trade reaches 1:1 R.
* Aim for a minimum reward of 1:1.5 R.
* Don't risk more than 3% of your total margin.

EURUSD for Next Week ->13 OCTLooking for some sell from first zone of supply but clearly we might running out of liquidity. Might grab some liquidity on Top of first supply zone to go lower.

See all forex ideas
| - | - | - | - | - | - | - | - | ||
| - | - | - | - | - | - | - | - | ||
| - | - | - | - | - | - | - | - | ||
| - | - | - | - | - | - | - | - | ||
| - | - | - | - | - | - | - | - | ||
| - | - | - | - | - | - | - | - | ||
| - | - | - | - | - | - | - | - | ||
| - | - | - | - | - | - | - | - | ||
| - | - | - | - | - | - | - | - |
Trade directly on the supercharts through our supported, fully-verified and user-reviewed brokers.


