#DCBBANK - BreakOut in DTF with Volume Script: DCBBANK
Key highlights: 💡⚡
📈 C&H BreakOut in Daily Time Frame
📈 Volume spike during Breakout
📈 Base BreakOut
📈 RS Line making 52WH
📈 MACD Crossover
BUY ONLY ABOVE 200 DCB
⏱️ C.M.P 📑💰- 199.62
🟢 Target 🎯🏆 – 12%
⚠️ Stoploss ☠️🚫 – 6%
⚠️ Important: Market conditions are BAD, Avoid entering

The best trades require research, then commitment.
Get started for free$0 forever, no credit card needed

Scott "Kidd" PoteetPolaris Dawn astronaut

Where the world does markets
Join 100 million traders and investors taking the future into their own hands.

JINDALSTEEL | Flag continuationStrong prior impulse, orderly flag structure
-RSI >50, EMAs rising, OBV confirms accumulation
-Sector tailwind: strength in metals
Trade plan:
-Buy > 1100 (volume confirmation required)
-SL: 1030
-Positional target: 1770
-R:R ≈ 1:11

IBEX ltd analysisJAN-2025
1. has got good move and then time correction.
2. Volume is contracting.
3. good momentum score, Good durabilty score.
2. quaterly profit & revenue has increased.
3. EPS has increased.
4. Debt has gone down.has low debt
5. No change in institution holding.
i am managing my risk by stop los

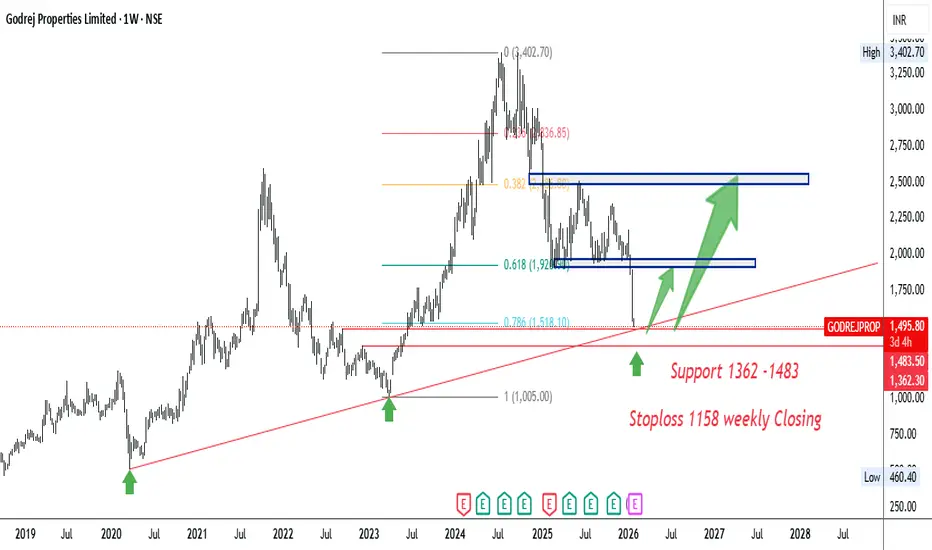
Positional Buy Godrej Properties.Buy Godrej Properties
Strong Retest Support of 1362-1483.
+
Trendline Support
+
Fibo 78.6 Support.
Stoploss 1158 weekly Closing.
Target should be 1900 and 2500
AXISBANK 40% upside possibility in 1-1.5 YearsAXISBANK 40% upside possibility in 1-1.5 Years
Fundamentals - Company has delivered good profit growth of 72.2% CAGR over last 5 years - Best among all Private banks.
Technical - Stock breaking from ATH backed with excellent Results.
LTP - 1325
Targets - 1850+
Timeframe - 1-1.5 Years.
Happy In

TATACONSUMER | Daily TF – RISING WEDGE BreakdownTATACONSUMER is showing short-term weakness after breaking below the rising trendline and failing to hold above 1160.
As long as price stays below this level, the probability increases for a move towards 1120–1100, which aligns with a higher time-frame Bullish Order Block (Demand Zone) and Fibonacc

ANGEL ONE cmp 2515 moving towards fresh 52w low @1808As you can see angel is in VCP pattern and nearest support are 1808 levels only expected it to reach there and this levels can act as good support for long term investment.

Canara Bank daily chartThe chart pattern Upward Parallel channel is seen .
Price is hovering around 20 and 50 EMA. Near term (next few days): Expect consolidation around 150–156.
A breakout above 156.80 could target 160–162, while a drop below 150 might lead to testing 148.
Key levels:
Support: 150 / 148.
Resistance:

UJJIVANSFB: Testing IPO High with Triple Top, Chart of the MonthFrom IPO Highs to Recovery: Is Ujjivan Small Finance Bank Finally Breaking Out After Six Years? After Posting Robust Q3 FY26 Numbers with asset quality improving and Micro Finance Cycle Turning Back. Let's Analyze in "Chart of the Month"
As per the Latest SEBI Mandate, this isn't a Trading/Inves

Bandhan Bank | Long-Term Downtrend | Decision ZoneBandhan Bank continues to trade inside a long-term falling channel, with price now near the lower boundary / support zone (~₹140–150).
This area is critical as it may act as either a base or a breakdown trigger.
🔍 Technical View:
• Strong descending channel intact
• Series of lower highs & lower lo

See all editors' picks ideas
Volume Cluster Profile [VCP] (Zeiierman)█ Overview
Volume Cluster Profile (Zeiierman) is a volume profile tool that builds cluster-enhanced volume-by-price maps for both the current market window and prior swing segments.
Instead of treating the profile as a raw histogram only, VCP detects the dominant volume peaks (clusters) insid

DeeptestDeeptest: Quantitative Backtesting Library for Pine Script
━━━━━━━━━━━━━━━━━━━━━━━━━━━━━━━━━━
█ OVERVIEW
Deeptest is a Pine Script library that provides quantitative analysis tools for strategy backtesting. It calculates over 100 statistical metrics including risk-adjusted return ratios (Sharpe

Arbitrage Detector [LuxAlgo]The Arbitrage Detector unveils hidden spreads in the crypto and forex markets. It compares the same asset on the main crypto exchanges and forex brokers and displays both prices and volumes on a dashboard, as well as the maximum spread detected on a histogram divided by four user-selected percenti

Multi-Distribution Volume Profile (Zeiierman)█ Overview
Multi-Distribution Volume Profile (Zeiierman) is a flexible, structure-first volume profile tool that lets you reshape how volume is distributed across price, from classic uniform profiles to advanced statistical curves like Gaussian, Lognormal, Student-t, and more.
Instead of forcin

Multi-Ticker Anchored CandlesMulti-Ticker Anchored Candles (MTAC) is a simple tool for overlaying up to 3 tickers onto the same chart. This is achieved by interpreting each symbol's OHLC data as percentages, then plotting their candle points relative to the main chart's open. This allows for a simple comparison of tickers to tr

Vdubus Divergence Wave Pattern Generator V1The Vdubus Divergence Wave Theory
10 years in the making & now finally thanks to AI I have attempted to put my Trading strategy & logic into a visual representation of how I analyse and project market using Core price action & MacD. Enjoy :)
A Proprietary Structural & Momentum Confluence System

Per Bak Self-Organized CriticalityTL;DR: This indicator measures market fragility. It measures the system's vulnerability to cascade failures and phase transitions. I've added four independent stress vectors: tail risk, volatility regime, credit stress, and positioning extremes. This allows us to quantify how susceptible markets are

Volatility Risk PremiumTHE INSURANCE PREMIUM OF THE STOCK MARKET
Every day, millions of investors face a fundamental question that has puzzled economists for decades: how much should protection against market crashes cost? The answer lies in a phenomenon called the Volatility Risk Premium, and understanding it may fundam

Volume Gaps & Imbalances (Zeiierman)█ Overview
Volume Gaps & Imbalances (Zeiierman) is an advanced market-structure and order-flow visualizer that maps where the market traded, where it did not, and how buyer-vs-seller pressure accumulated across the entire price range.
The core of the indicator is a price-by-price volume prof

Match Finder [theUltimator5]Match Finder is the dating app of indicators. It takes your current ticker and finds the most compatible match over a recent time period. The match may not be Mr. right, but it is Mr. right now. It doesn't forecast future connection, but it tells you current compatibility for today.
Jokes aside,

See all indicators and strategies
Community trends
#DCBBANK - BreakOut in DTF with Volume Script: DCBBANK
Key highlights: 💡⚡
📈 C&H BreakOut in Daily Time Frame
📈 Volume spike during Breakout
📈 Base BreakOut
📈 RS Line making 52WH
📈 MACD Crossover
BUY ONLY ABOVE 200 DCB
⏱️ C.M.P 📑💰- 199.62
🟢 Target 🎯🏆 – 12%
⚠️ Stoploss ☠️🚫 – 6%
⚠️ Important: Market conditions are BAD, Avoid entering
BUY TODAY SELL TOMORROW for 5% DON’T HAVE TIME TO MANAGE YOUR TRADES?
- Take BTST trades at 3:25 pm every day
- Try to exit by taking 4-7% profit of each trade
- SL can also be maintained as closing below the low of the breakout candle
Now, why do I prefer BTST over swing trades? The primary reason is that I have observed t

SbinThe daily time frame chart shows that the price is bouncing from the trend line support. In the lower time frame, the price has formed a rounding bottom.
Buy above 1048 with the stop loss of 1040 for the targets 1054, 1060, 1068 and 1076.
A rounding bottom pattern can form a candle if it has a pullb

Hindalco Industries Ltd Stock price will hit 1020-1035Hindalco Industries Ltd is well-positioned for a short-term long trade at ₹962, supported by favorable price and volume action. The setup indicates upside potential toward the ₹1,020–1,035 zone in the near term, making current levels an attractive entry for short-term traders.

Positional Buy Godrej Properties.Buy Godrej Properties
Strong Retest Support of 1362-1483.
+
Trendline Support
+
Fibo 78.6 Support.
Stoploss 1158 weekly Closing.
Target should be 1900 and 2500
Types of Breakout in the Markets ( Monthly Time Frame )In this video I will showcase different type of Breakouts you can see in the markets, mostly Horizontal types and Trendline Types but even inside them which ones are best to follow
I have used charts older than 3 months to showcase this information

ATH Breakout Pullback: Smart Money Reloading at Demand Zone?Price has corrected from an all-time high and is now revisiting a high-quality demand zone that played a key role in breaking previous highs. This is not a random pullback — this is a structurally important retest. Let’s decode what the chart is really saying using pure Supply & Demand and Price Act

DLF going to touch 613DLF is currently entering a critical price cluster between 611 – 620. This zone will likely dictate the trend for the coming days.
The Pivot Point: 613 (Mean Level)
Bullish Scenario: A sustained move above 613 backed by strong volume confirmation and a breakout of the descending trendline could tri

BEL 1 Day Time Frame 📌 📊 BEL 1‑Day Key Technical Levels
Approx Current Price (latest quotes today):
Around ₹415–₹419 range on NSE/BSE today (daily range seen ~₹415.85–₹424.55).
📈 How to Read These Levels (Daily Chart)
Bullish bias: Price holding above Pivot (~₹403–₹417) and especially above R1 (~₹409–₹421) suggests s

MFSL at Channel Support — Bounce or Breakdown?MFSL is moving inside a well-defined rising channel, showing a healthy and controlled uptrend.
The stock has respected this structure multiple times, with buyers stepping in near the lower support and selling pressure appearing near the upper resistance.
Currently, price is approaching the lower b

See all stocks ideas
Tomorrow
ROLEXRINGSRolex Rings Limited
Actual
—
Estimate
1.50
INR
Tomorrow
SANGHIINDSanghi Industries Limited
Actual
—
Estimate
—
Tomorrow
ABDLAllied Blenders and Distillers Limited
Actual
—
Estimate
2.11
INR
Tomorrow
VEDLVedanta Limited
Actual
—
Estimate
14.50
INR
Tomorrow
AMBUJACEMAmbuja Cements Limited
Actual
—
Estimate
4.41
INR
Tomorrow
APOLLOPIPEApollo Pipes Ltd.
Actual
—
Estimate
0.50
INR
Tomorrow
RECLTDREC Limited
Actual
—
Estimate
16.28
INR
Tomorrow
SKIPPERSkipper Ltd
Actual
—
Estimate
5.53
INR
See more events
Today
D
DIGILOGICDigilogic Systems Ltd.
Exchange
BSE
Offer price
1.135
USD
Today
S
SHADOWFAXShadowfax Technologies Limited
Exchange
BSE
Offer price
1.353
USD
Tomorrow
K
KRMAYURVEDKRM Ayurveda Ltd.
Exchange
NSE
Offer price
1.40 - 1.47
USD
Jan 30
300449Hannah Joseph Hospital Limited
Exchange
BSE
Offer price
0.73 - 0.76
USD
See more events
Community trends
Bitcoin Is Reacting, Not Breaking, Patience Before the Next MoveWhen I look at this chart, I don’t see panic or trend failure. I see price pulling back into a clearly defined demand area within a rising structure and responding from it. That matters. If sellers were truly in control, price wouldn’t pause here, it would slice through demand without hesitation. In

BTC 4H UpdateAre we breaking out or faking out? 📉📈
Bitcoin is at a massive crossroads today, and the $91k level is the only thing that matters right now. We’ve seen some intense "chop" as the market prepares for today's FOMC decision.
My Technical Take:
Bullish Scenario: We need a clean flip of $91,195. If we

$PUMP MACRO SETUP | 1,000%+ UPSIDE IF HTF BASE HOLDSNYSE:PUMP MACRO SETUP | 1,000%+ UPSIDE IF HTF BASE HOLDS
#PUMP Is Trading Inside A HTF Accumulation Zone After Completing A Long-Term Descending Wedge, Signaling A Potential Macro Trend Reversal.
Technical Structure:
✅ Multi-Month Descending Wedge Breakout Confirmed
✅ Clean Breakout + Retest Of H

(FOMC) Bitcoin Bybit chart analysis JENUARY 28Hello
It's a Bitcoin Guide.
If you "follow"
You can receive real-time movement paths and comment notifications on major sections.
If my analysis was helpful,
Please click the booster button at the bottom.
This is a 30-minute Bitcoin chart.
The FOMC will announce interest rates at 4:00 AM tomor

Weekly Long Setup | Jan 20th 2026 | Valid Until Weekly ClosePrice might retrace to a strong pivot zone (marked by the red box).
Structure remains bullish on HTF with potential for continuation after pullback.
The green box represents a high-probability long opportunity with tight risk control.
Watch for price reaction within the red zone. Entry only if con

#BNB/USD Buy Trade Setup.Here’s an up-to-date BNB/USD Buy trade outlook (technical + fundamental) to help you assess whether positioning for a Upside makes sense right now.
Thank You......


AVNT future potential level?This AVNTUSDT structure is tightening fast and when compression reaches this level, the next expansion usually isn’t small.
Price is approaching a decision point that could define the next multi-week move.
📌 Pattern Overview
AVNT is currently trading inside a descending wedge, a structure often see

BTC/USD 1 Month Time Frame 📈 Real‑Time BTC/USD Snapshot
Bitcoin live price (BTC → USD):
≈ $89,200 – $89,300 USD based on recent aggregated market data.
Over the past month, Bitcoin’s price has fluctuated between:
High ≈ $97,759
Low ≈ $86,181
with a net mild upside in the 30‑day range.
📊 Key 1‑Month Support & Resistance L

BTCUSD ShortBitcoin is in downtrend on 15 mins timeframe. Price can ve shorted at the levels marked after confirmation. Targets mentioned

See all crypto ideas
XAUUSD – Brian | M45 Technical Analysis— Buyers Still in Control Above 5,200
Gold continues to trade firmly above the 5,000 milestone, with price action confirming strong bullish acceptance at higher levels. On the M45 timeframe, the market remains in an expansion phase, supported by aggressive buying volume and well-defended value area

XAUUSD (H2) - Liam Plan (Jan 28)XAUUSD (H2) – Liam Plan (Jan 28)
New ATH, strong safe-haven flow | Follow trend, buy FVG pullbacks only
Quick summary
Gold continues to print new all-time highs as global capital rotates into safe-haven assets amid persistent economic and geopolitical uncertainty tied to recent US policy decision

GOLD (XAUUSD) Retracement Buy Zones-Long Bias Only**Description:**
Gold is currently in a bullish structure and I am waiting for a **healthy retracement into my marked demand zones**.
My plan is simple: **ONLY look for BUY opportunities** from these zones and ignore sells.
Price previously respected this area as support and also aligns with struct

Gold at ATH before FOMC shakeout first or straight breakout?🧭 Macro Snapshot
Donald Trump maintains a hardline stance, increasing military presence in the Middle East → geopolitical risk remains elevated.
Tonight’s key focus: Federal Reserve
Political pressure and questions around Fed independence.
DXY continues to weaken, retesting major historical supp

XAUUSD – Bullish Continuation, ATH Expansion Still in PlayGold continues to trade within a strong bullish channel, maintaining its ATH expansion structure. The recent pullback is corrective in nature and shows clear signs of liquidity absorption rather than distribution.
On the macro side, sustained USD weakness, safe-haven flows, and a still-cautious Fed

Gold Trading Strategy for 28th January 2026🟡 GOLD ($) TRADING PLAN
📊 TREND TRADING (Intraday)
📈 BUY SETUP
🟢 Condition:
➡️ Buy above the high of 30-min candle
➡️ Candle must close above $5244
🎯 Targets:
💰 $5255
💰 $5266
💰 $5277
🛑 Stop Loss:
🔻 Below the low of the breakout candle
📉 SELL SETUP
🔴 Condition:
➡️ Sell below the low of 1-hour ca

4H Rejection Block & Return to EquilibriumGold (XAUUSD) has rallied aggressively but is now showing signs of exhaustion as it taps into the supply zone around the 5080-5100 level. We are seeing a rejection on the 4H timeframe, suggesting a potential shift in momentum.

Gold Analysis & Trading Strategy | January 27–28Gold Analysis & Trading Strategy | January 27–28
🔥Congratulations to all members who followed our trading signals.
The long positions opened around 5050 have successfully captured over 500+ pips in profit!👏👏👏
✅ 4-Hour Chart (H4) Analysis
From the 4-hour timeframe, gold remains within a clear bullis

Scalping Silver: Precision Entries with TXG System Silver: Riding the Bull Run & Catching the Reversal (Full Cycle Analysis)
We are looking at a complete volatility cycle on Silver Mini Futures (15m) using the TradeX Guru (TXG) Ecosystem.
1. The Setup (The Rally): Earlier in the session, the TXG system identified a strong "BULLISH" expansio

CRUDE OIL Moving towards 6700+CRUDE OIL Moving towards 6700+ after 5 Years ... Are we near the breakout of CRUDEOIL?
Crude OIL MCX is seen rising towards 6700+ Level post correction for 5 Months.
We seen big Rally in 2020-2021 on Crude OIL post COVID - post that we have seen 4 Years of correction on it. Now are we ready for up

See all futures ideas
GBP/AUD: Corrective Rally, Downtrend IntactGBP/AUD is trading in a clear bearish Elliott Wave structure on the 4H timeframe. The market has already completed a strong impulsive decline and is currently moving in a Wave 4 corrective pullback, which is happening inside a downward channel and near key Fibonacci retracement levels. This correcti

GBPUSD – Support Holding, Watching Reaction From RangeGBP/USD has reacted from a well-defined support zone, an area where buyers have stepped in multiple times before. Price is currently trading between clear support and resistance, indicating a short-term range environment.
As long as this support holds, upside reactions toward the resistance zone re

CHFJPY 4HR T/F ANALYSIS----
chfjpy 4hr t/f analysis----- in this image we have a new retesting area which are sell side retesting here we do measure top recent demand and demand will be also completed so now we can see recent full supply here so we can go with supply let`s see---

#GBP/USD Sell Trade Scenario.Here’s an up-to-date GBP/USD Sell trade outlook (technical + fundamental) to help you assess whether positioning for a Downside makes sense right now.
Thank You......

DAILY FOREX SCAN Session – 20 (28.01.26)Scanning multiple forex pairs to filter high-quality trade setups. No trades are forced—only structure-based opportunities.
Note: There may be a delay in this video due to upload processing time.
Disclaimer: FX trading involves high leverage and substantial risk, and losses can exceed your initial

AUDNZD just touched a sensitive areaThe AUDNZD pair is currently testing a highly sensitive zone that has historically acted as a powerful springboard for price action. We are at a "make or break" junction, watch these levels closely!
1. If the price successfully holds its ground and continues to trade above 1.1565, the historical de

Kiwi Analysis: Bullish ContinuationThe NZD/USD has exhibited strong bullish momentum over the last few days, successfully climbing out of the 0.5980 consolidation zone. We are currently seeing a classic technical setup: the Break and Retest of a key structural level.

GBPUSD-Retracement Set up.(Not Trend Reversal)
GBPUSD is currently moving bullish, mainly driven by **USD weakness** rather than strong GBP strength.
This move is considered a **retracement**, not a full bearish structure change.
🔹 **Bias:**
➡️ Overall move is corrective
➡️ Bearish continuation only after retracement zones are reached
### 🎯

UPDATE on previous EURUSD BULLISH IDEA!The price has claimed the highs which was a major level I marked and presented at :- 1.19206.
The TRADE IDEA is COMPLETE!
Congratulations to whoever took this.

See all forex ideas
| - | - | - | - | - | - | - | - | ||
| - | - | - | - | - | - | - | - | ||
| - | - | - | - | - | - | - | - | ||
| - | - | - | - | - | - | - | - | ||
| - | - | - | - | - | - | - | - | ||
| - | - | - | - | - | - | - | - | ||
| - | - | - | - | - | - | - | - | ||
| - | - | - | - | - | - | - | - | ||
| - | - | - | - | - | - | - | - |
Trade directly on Supercharts through our supported, fully-verified, and user-reviewed brokers.


