TSM | Bullish Scenario After Liquidity Reaction
NYSE:TSM
Bias: Bullish
Price is currently reacting from a liquidity-driven area. If price retraces toward the 340 zone and holds structure, I will look for bullish continuation aligned with higher-timeframe context.
Invalidation: Acceptance below 318 would negate the bullish scenario.
Upsid

Alibaba : Ready for another 65% + move Hi friends,
Alibaba is a perfect stock to play AI and China tech boom .
Target & Stoploss are mentioned on the self explanatory chart .
Note : I am not SEBI registered advisor . Please consider my analysis for education purpose only .

Johnson & Johnson extends the uptrend,1 Price has been trending higher for months with repeated, orderly pauses
2 Each consolidation formed at a higher level and resolved to the upside
3 The latest push was steeper, increasing the chance of another pause
4 So far, pauses have looked constructive rather than distributive
5 Silent Flow is

AAPLAAPL | 1D | Aggressive BUY Setup
📌 Buy only above blue line (262.17) on strong close.
🛑 Stop Loss below red line (255.50) to control risk.
🎯 Minimum Target: Green line (275.38); further upside possible if momentum sustains.
📊 Price attempting base formation after decline
📈 RSI near oversold zone,

MSTR: Dead man walking ?Right Shoulder negates on Weekly close above $200.
Neckline at $100.
🌇☘️🈶😄🍩🎲

Brinks company analysisI am going to buy this stock because of following reason.
1. Stock has given good move
2. stock is created good based of 3 weeks long.
3. Stock has broken out with good volumn.
4. Stock has seen consistent growth in last 8 quarters.
5. high financial strength, mid valuation, good momentum score
6. q

Navigating the Correction and Targeting the Next HurdleSMCI appears to be in the final stages of a significant corrective phase on the monthly and daily charts, following a strong impulse move. This analysis suggests we are working within a larger corrective structure, potentially a flat pattern that began in early 2025
Current Position: The stock pric

Breakout in Coca ColaThe stock formed a triangle and gave a breakout. The levels marked with red lines will act as a support in case we see a retreat to breakout levels. Expecting the stock to be overall in bull trend in next months

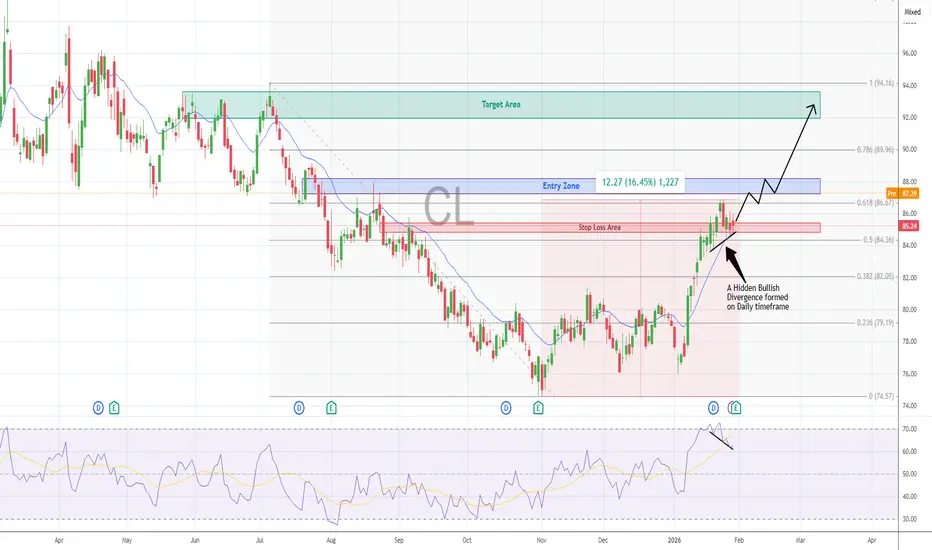
Colgate Palmolive Analysis* The primary trend of the stock is bullish, although prices witnessed a bearish retracement for over a year (Sep 2024 - Oct 2025)
* Since strong Q3 earnings (Oct 2025), a bullish pull-back could be seen, and prices rose more than 16.5% in over +3 months
* Recently prices tested fib level 0.618 (
ANET | No Fireworks, Just Higher Prices to 178 target📡 Arista Networks, Inc. (ANET)
Calm Pullback, Serious Business | Bullish Continuation Setup
🧠 Let’s be honest…
Not every stock needs fireworks to make money.
Some just do the work quietly — and ANET is one of them.
After a healthy reset, Arista is back above key value and VWAP, telling us somethi

See all popular ideas
Community trends
Stock collections
All stocksTop gainersBiggest losersLarge-capSmall-capLargest employersHigh-dividendHighest net incomeHighest cashHighest profit per employeeHighest revenue per employeeMost activePre-market gainersPre-market losersPre-market most activePre-market gapAfter-hours gainersAfter-hours losersAfter-hours most activeUnusual volumeMost volatileHigh betaBest performingHighest revenueMost expensivePenny stocksPink sheetOverboughtOversoldAll-time highAll-time low52-week high52-week lowSee all
Today
EPCEdgewell Personal Care Company
Actual
−0.16
USD
Estimate
−0.16
USD
Today
WATWaters Corporation
Actual
4.53
USD
Estimate
4.51
USD
Today
LLoews Corporation
Actual
2.14
USD
Estimate
—
Today
CNACNA Financial Corporation
Actual
1.16
USD
Estimate
1.29
USD
Today
APOApollo Global Management, Inc. (New)
Actual
2.47
USD
Estimate
2.04
USD
Today
DTDynatrace, Inc.
Actual
0.44
USD
Estimate
0.41
USD
Today
BDXBecton, Dickinson and Company
Actual
2.91
USD
Estimate
2.81
USD
Today
SBHSally Beauty Holdings, Inc. (Name to be changed from Sally Holdings, Inc.)
Actual
0.48
USD
Estimate
0.46
USD
See more events
Sector 10 matches | Today | 1 week | 1 month | 6 months | Year to date | 1 year | 5 years | 10 years |
|---|---|---|---|---|---|---|---|---|
| Electronic Technology | ||||||||
| Technology Services | ||||||||
| Finance | ||||||||
| Health Technology | ||||||||
| Retail Trade | ||||||||
| Producer Manufacturing | ||||||||
| Consumer Non-Durables | ||||||||
| Energy Minerals | ||||||||
| Consumer Durables | ||||||||
| Consumer Services |