Part 2 Master Candlestick PatternTypes of Options and Market Participants
1. Call Options (Right to Buy)
A Call Option gives the holder the right to buy an asset at a strike price. Investors use calls when they expect prices to rise.
Example: Buying a TCS ₹3,000 Call at ₹100 premium means you profit if TCS rises above ₹3,100 before expiry.
2. Put Options (Right to Sell)
A Put Option gives the holder the right to sell at a strike price. Used when expecting prices to fall.
Example: Buying Infosys ₹1,500 Put at ₹50 premium pays off if Infosys drops below ₹1,450.
3. Option Market Participants
Hedgers: Reduce risk by using options as insurance. (e.g., farmer hedging crop price, or investor protecting stock portfolio).
Speculators: Bet on price movements to earn profits.
Arbitrageurs: Exploit price differences across markets.
Writers (Sellers): Earn premium by selling options but take on higher risks.
Psychology & Discipline in Option Trading
Trading is not just math. It’s mindset.
Fear of Missing Out (FOMO): Leads to impulsive trades.
Over-Leverage: Options tempt traders with small premiums, causing overtrading.
Discipline: Setting stop-loss, position sizing, and risk management is crucial.
Patience: Most successful option traders focus on probability, not prediction.
X-indicator

Support & Resistance Levels for Today’s Market1. Introduction: Why Support & Resistance Matter
In trading, one of the most powerful and time-tested concepts is support and resistance (S&R). Whether you are a beginner exploring intraday charts or a seasoned trader looking at weekly setups, S&R levels act like the invisible walls of the market.
Support is a price zone where buyers step in, halting a decline.
Resistance is a zone where sellers emerge, stopping an advance.
These levels reflect the psychology of crowds, institutional behavior, and liquidity zones. Without them, trading would feel like driving without brakes or signals.
Every day, traders mark fresh S&R levels based on the previous day’s highs, lows, closes, option data, and market structure. That’s why they’re so critical in today’s market outlook.
2. The Psychology Behind Support & Resistance
To understand why these levels work, we need to dig into trader psychology:
Support Zones: Imagine a stock falling from ₹200 to ₹180. Many buyers who missed at ₹200 now feel ₹180 is a “cheap” price, so they step in. Short-sellers also book profits. This creates buying demand → market stabilizes.
Resistance Zones: Suppose the same stock climbs back from ₹180 to ₹200. Traders who bought late at ₹200 earlier may exit to break even. Short-sellers also re-enter. Selling pressure builds → market stalls.
Thus, S&R levels form from collective trader memory. The more times a level is tested, the stronger it becomes.
3. How to Identify Support & Resistance Levels for Today
For daily trading, traders usually rely on:
(a) Previous Day High & Low
Yesterday’s high often acts as resistance.
Yesterday’s low often acts as support.
Example: If Nifty made a high of 24,200 yesterday, that zone may cap today’s rallies.
(b) Opening Price & First 15-Minute Range
The opening levels define intraday sentiment.
A breakout above the first 15-min high = bullish bias.
A breakdown below the first 15-min low = bearish bias.
(c) Moving Averages
20 EMA (Exponential Moving Average) is a strong intraday S/R level.
50 & 200 EMAs act as swing-level S/R.
(d) Pivot Points
Calculated from (High + Low + Close) / 3.
Traders use them to mark Support (S1, S2, S3) and Resistance (R1, R2, R3) levels.
(e) Volume Profile Zones
High Volume Nodes (HVN) = strong support/resistance.
Low Volume Nodes (LVN) = possible breakout/breakdown areas.
(f) Option Chain Data (OI)
In index trading (Nifty, Bank Nifty), strike prices with highest Call OI = resistance.
Strike prices with highest Put OI = support.
4. Types of Support & Resistance
(a) Horizontal Levels
Flat lines connecting multiple swing highs or lows. Most commonly used.
(b) Trendline Support/Resistance
Drawn diagonally across rising lows (support) or falling highs (resistance).
(c) Fibonacci Levels
Retracement levels (38.2%, 50%, 61.8%) often act as S&R.
(d) Dynamic Levels
Moving averages, VWAP, Bollinger bands that shift daily.
(e) Psychological Levels
Round numbers like Nifty 24,000 or Bank Nifty 50,000 act as magnets for price.
5. Why Support & Resistance Work Better in Today’s Market
Today’s markets (2025) are highly algorithm-driven, but even algo models respect liquidity zones → which are essentially S&R levels.
Retail traders watch them → self-fulfilling prophecy.
Institutions place big buy/sell orders near S&R → liquidity builds.
Option writers defend key strikes → market reacts.
So, S&R remains relevant even in the era of algo trading.
6. Trading Strategies Using Support & Resistance
Let’s break down practical intraday and swing strategies:
Strategy 1: Bounce from Support
Wait for price to test support (yesterday’s low, pivot S1, etc.).
Look for bullish candlestick pattern (hammer, engulfing).
Enter long trade → Stop loss below support → Target = resistance.
Strategy 2: Reversal at Resistance
Price approaches strong resistance.
Look for bearish rejection (shooting star, Doji).
Enter short trade → Stop loss above resistance → Target = support.
Strategy 3: Breakout of Resistance
Resistance is tested multiple times.
Strong volume breakout = momentum trade.
Example: Nifty crossing 24,200 with OI shift confirms breakout.
Strategy 4: Breakdown of Support
If support breaks with volume, fresh shorts open.
Example: Bank Nifty falling below 50,000 with heavy Put unwinding.
Strategy 5: Range Trading
If market is sideways, trade between support & resistance.
Buy near support → Sell near resistance.
7. Support & Resistance in Different Timeframes
1-Min / 5-Min Charts → For scalpers, short-term S&R.
15-Min / 1-Hour Charts → Best for intraday.
Daily Charts → Strong S&R for swing & positional trades.
Weekly Charts → Long-term zones watched by institutions.
For today’s market, intraday traders focus mainly on 15-min & hourly charts.
8. Common Mistakes Traders Make
Blindly Buying at Support / Selling at Resistance
Always confirm with volume & candlestick pattern.
Ignoring Breakouts & Breakdowns
Many traders keep waiting for a bounce but miss the trend.
Using Only One Tool
Combine pivots, moving averages, and OI for better accuracy.
Forgetting Stop Loss
S&R levels can break – never trade without a plan.
9. Case Study: Support & Resistance in Nifty (Example)
Suppose Nifty closed yesterday at 24,050 with a high of 24,200 and low of 23,950.
Support Zones for Today:
23,950 (yesterday’s low)
23,900 (Put OI support)
23,850 (pivot S1)
Resistance Zones for Today:
24,200 (yesterday’s high)
24,250 (Call OI buildup)
24,300 (pivot R1)
Trading Plan:
If Nifty sustains above 24,200 with volume → Buy for 24,300.
If Nifty falls below 23,950 → Short for 23,850.
This is exactly how professionals set up today’s market trade plan.
10. Advanced Insights: Volume Profile + Options Data
A modern trader should combine:
Volume Profile → Where most trading occurred yesterday.
Options OI Shifts → Which strikes are defended/attacked today.
Price Action Confirmation → Candlestick rejections, breakouts.
This 3-way approach increases accuracy.
Conclusion: Why Support & Resistance Will Never Die
Markets evolve – from floor trading to electronic, from manual to algo. But one thing remains timeless: human behavior. Fear, greed, profit-taking, and FOMO all play out at support and resistance levels.
For today’s market, S&R acts as your trading compass.
They guide your entries and exits.
They highlight where risk is lowest and reward is highest.
They help you trade with discipline instead of emotion.
Whether you are an intraday trader, a swing trader, or an investor, mastering support and resistance is like mastering the grammar of market language. Without it, you can’t construct profitable trades.

Breakouts & Fakeouts in Trading🔹 Introduction
Financial markets are like living organisms – constantly moving, adjusting, and reacting to news, emotions, and liquidity. For traders, one of the most exciting moments is when a stock, currency pair, commodity, or cryptocurrency seems to break out of its range. Breakouts often lead to big, sharp moves, offering opportunities for quick profits.
But here’s the catch: not every breakout is real. Many are fakeouts (false breakouts) designed by market dynamics, liquidity hunters, or big players to trap traders. The difference between making money and losing money often lies in identifying whether a breakout is genuine or false.
This article dives into:
What breakouts are
Why fakeouts happen
Chart examples (conceptually explained)
Tools to confirm breakouts
Trading strategies to avoid traps
Risk management for breakout traders
🔹 Part 1: What is a Breakout?
A breakout occurs when the price of an asset moves outside a defined support or resistance level with increased momentum.
✅ Common Types of Breakouts
Resistance Breakout – Price moves above a previously strong ceiling.
Support Breakout – Price falls below a previously strong floor.
Trendline Breakout – Price breaks out of a rising or falling trendline.
Chart Pattern Breakout – Price escapes from patterns like triangles, flags, rectangles, or head & shoulders.
Volatility Breakout – When price explodes after a period of consolidation (Bollinger Band squeeze).
Why traders love breakouts?
They indicate a new trend may begin.
They provide clear entry and exit levels.
They often come with higher volume, confirming market interest.
Example: If Nifty is stuck between 19,500–20,000 for weeks and suddenly crosses 20,000 with heavy volume, that’s a bullish breakout.
🔹 Part 2: What is a Fakeout?
A fakeout (false breakout) happens when price temporarily breaks a level, lures traders into positions, but then reverses back into the range.
Fakeouts are dangerous because:
Traders enter aggressively expecting a trend, but get stopped out.
Big players use fakeouts to hunt stop-losses of retail traders.
They often happen during low liquidity or news events.
Example: Price breaks above 20,000, attracts buyers, but quickly reverses to 19,800. That’s a bull trap fakeout.
🔹 Part 3: Why Do Fakeouts Happen?
Fakeouts are not random; they are part of market psychology and structure.
Liquidity Hunting (Stop Loss Hunting)
Smart money knows retail traders place stop-losses above resistance or below support.
They push prices just beyond those levels, trigger stop-losses, then reverse.
Low Volume Breakouts
If breakout happens without strong participation, it’s usually unsustainable.
News & Events
A sudden announcement can cause sharp moves, but once news fades, price falls back.
Algorithmic Manipulation
High-frequency traders may push price beyond levels to create artificial breakouts.
Market Sentiment & Greed
Traders chase breakouts blindly, creating temporary momentum before exhaustion.
🔹 Part 4: Spotting Genuine Breakouts vs Fakeouts
✅ Clues for Real Breakouts
High Volume: Breakouts with above-average volume are stronger.
Retest of Levels: After breakout, price pulls back to test old support/resistance, then resumes trend.
Strong Candle Closes: Large body candles closing beyond the level.
Market Context: Aligns with larger trend or macroeconomic strength.
❌ Signs of Fakeouts
Breakout with low or declining volume.
Long wicks (shadows) beyond resistance/support but weak closes.
Breakouts during off-market hours or thin liquidity.
Price immediately snaps back into range after breakout.
🔹 Part 5: Chart Patterns & Fakeouts
Range Breakouts
Markets consolidate between two levels.
Breakouts beyond range are powerful but also prone to fakeouts.
Triangle Breakouts
Symmetrical/ascending/descending triangles show compression.
Fakeouts are common before the “real” breakout.
Head & Shoulders Pattern
A breakdown below the neckline should confirm trend reversal.
Many times, price breaks below neckline but quickly recovers.
Flag & Pennant Patterns
Strong continuation patterns, but fake breakouts happen if volume is missing.
🔹 Part 6: Strategies to Trade Breakouts & Avoid Fakeouts
1. Wait for Candle Close Confirmation
Don’t jump in immediately; wait for the candle to close above/below the level.
2. Use Volume as Filter
Only trade breakouts with above-average volume.
3. Retest Strategy
Enter on pullback to old support/resistance (safer entry).
4. Multi-Timeframe Confirmation
If breakout is visible on both 1-hour and daily charts, it’s stronger.
5. Combine with Indicators
RSI divergence can warn of false breakout.
Moving averages can confirm trend direction.
6. Avoid News-Driven Breakouts
Trade technical breakouts, not temporary news spikes.
🔹 Part 7: Risk Management in Breakout Trading
Even the best trader cannot avoid fakeouts completely. That’s why risk management is key.
Position Sizing: Risk only 1–2% of account per trade.
Stop Loss Placement:
For upside breakout: place SL below breakout level.
For downside breakout: place SL above breakdown level.
Use Partial Profits: Book some profit early, trail the rest.
Don’t Chase Breakouts: If you miss the first entry, don’t enter late.
🔹 Part 8: Real-Life Examples
Example 1: Stock Breakout
Stock consolidates between ₹500–₹520 for 2 weeks.
Breaks ₹520 with high volume, rallies to ₹550. (Real breakout)
Example 2: Crypto Fakeout
Bitcoin breaks $30,000 resistance but fails to sustain.
Falls back to $29,000 within hours. (Bull trap fakeout)
Example 3: Forex False Breakdown
EUR/USD breaks below 1.1000, triggering short trades.
Reverses sharply to 1.1050. (Bear trap fakeout)
🔹 Part 9: Psychology Behind Breakouts & Fakeouts
Retail Traders: Chase price blindly.
Institutions: Create liquidity zones by triggering retail stop-losses.
Fear & Greed: Traders either fear missing out (FOMO) or panic at reversals.
Patience vs Impulsiveness: Successful traders wait for confirmation, while impulsive ones fall for fakeouts.
🔹 Part 10: Advanced Tips for Professionals
Volume Profile Analysis
See if breakout aligns with high-volume nodes (strong support/resistance).
Order Flow Tools (Level II Data, Footprint Charts)
Helps spot whether breakout is supported by real buying/selling.
Breakout with Trend Alignment
Always trade in direction of higher-timeframe trend.
Market Timing
Breakouts during main sessions (like US market open) are more reliable.
🔹 Conclusion
Breakouts & fakeouts are two sides of the same coin. While real breakouts can deliver powerful moves, fakeouts are equally common and dangerous. The key lies in:
Confirming with volume, retests, and candle closes.
Avoiding emotional FOMO trades.
Protecting capital with risk management.
If you understand the psychology behind breakouts and fakeouts, use confirmation tools, and trade with patience, you can avoid traps and capture the big trend moves that follow genuine breakouts.
Crypto Trading StrategiesChapter 1: Basics of Crypto Trading
1.1 What is Crypto Trading?
Crypto trading is the buying and selling of digital currencies like Bitcoin, Ethereum, or Solana with the goal of making profits. Trades can be short-term (minutes, hours, or days) or long-term (months or years).
1.2 Why Do People Trade Crypto?
High volatility = high profit potential
24/7 market availability
Variety of assets (over 25,000 coins/tokens)
No central authority (decentralization)
1.3 Types of Crypto Trading
Spot Trading: Buying and selling crypto for immediate delivery.
Futures & Derivatives: Speculating on price without holding the asset.
Margin Trading: Borrowing funds to trade larger positions.
Automated Trading (Bots/AI): Using algorithms to execute trades.
Chapter 2: Foundations of a Good Trading Strategy
2.1 Key Elements
Market Analysis (technical + fundamental)
Risk Management (stop-loss, position sizing)
Trading Psychology (discipline, patience)
Adaptability (adjusting strategies to market conditions)
2.2 Technical Tools
Candlestick patterns
Moving averages (MA, EMA)
RSI, MACD, Bollinger Bands
Volume profile and market structure
2.3 Risk Control
Never risk more than 1–2% of capital per trade.
Always set stop-loss orders.
Diversify across assets.
Chapter 3: Popular Crypto Trading Strategies
3.1 HODLing (Long-Term Holding)
Concept: Buy and hold crypto for years regardless of short-term fluctuations.
Best for: Investors who believe in long-term blockchain growth.
Pros: Easy, stress-free, low trading fees.
Cons: Vulnerable to market crashes.
3.2 Day Trading
Concept: Opening and closing positions within a day.
Tools Used: Technical analysis, chart patterns, high liquidity coins.
Pros: Daily income potential.
Cons: Stressful, requires screen time, risky.
3.3 Swing Trading
Concept: Capturing medium-term price swings (days to weeks).
Example: Buying Bitcoin after a pullback and selling after a breakout.
Pros: Less stressful than day trading.
Cons: Requires patience, overnight risks.
3.4 Scalping
Concept: Making dozens or hundreds of trades daily for small profits.
Tools: Bots, high liquidity exchanges, technical indicators.
Pros: Can accumulate profits quickly.
Cons: High fees, mentally exhausting.
3.5 Trend Following
Concept: "The trend is your friend." Trade in the direction of momentum.
Indicators: Moving averages, MACD, Ichimoku Cloud.
Pros: Effective in trending markets.
Cons: Doesn’t work well in sideways (range-bound) markets.
3.6 Breakout Trading
Concept: Entering trades when price breaks a key support/resistance level.
Example: Buying Bitcoin when it breaks $30,000 resistance.
Pros: Can catch big moves early.
Cons: False breakouts are common.
3.7 Arbitrage
Concept: Exploiting price differences between exchanges.
Types:
Exchange Arbitrage (Binance vs Coinbase)
Triangular Arbitrage (using three pairs)
Pros: Low risk if executed fast.
Cons: Requires speed, high capital.
3.8 Copy Trading / Social Trading
Concept: Following trades of professional traders via platforms.
Pros: Easy for beginners.
Cons: Risk if trader performs badly.
3.9 Algorithmic & Bot Trading
Concept: Automated execution using pre-set rules.
Pros: No emotions, works 24/7.
Cons: Needs technical knowledge, market risk.
3.10 News-Based Trading
Concept: Trading based on major announcements (ETF approvals, regulations, partnerships).
Pros: Can profit from volatility.
Cons: Markets react unpredictably.
Chapter 4: Advanced Crypto Trading Strategies
4.1 Using Leverage
Borrowed funds to trade bigger positions.
Example: 10x leverage means 1% move = 10% profit/loss.
Warning: Extremely risky, beginners should avoid.
4.2 Hedging
Using futures/options to protect long-term holdings.
Example: Holding Bitcoin but shorting futures to protect downside.
4.3 Dollar-Cost Averaging (DCA)
Investing small amounts regularly over time.
Pros: Reduces impact of volatility.
Cons: Slower gains in bull markets.
4.4 Yield Farming & Staking
Earning passive income by locking tokens.
Pros: Steady income.
Cons: Smart contract risks, token devaluation.
Chapter 5: Trading Psychology & Risk Management
5.1 Emotions in Trading
Fear & greed drive most mistakes.
Overtrading, revenge trading, panic selling = account killers.
5.2 Building Discipline
Have a written trading plan.
Stick to stop-loss and take-profit levels.
Avoid FOMO (fear of missing out).
5.3 Risk-Reward Ratio
Aim for at least 1:2 risk-reward ratio (risk $100 to make $200).
Chapter 6: Practical Tips for Crypto Traders
Trade only with money you can afford to lose.
Keep records of trades (trading journal).
Use reliable exchanges with strong security.
Learn continuously—crypto evolves fast.
Diversify between Bitcoin, altcoins, and stablecoins.
Conclusion
Crypto trading offers incredible opportunities—but also extreme risks. Without a strategy, traders often fall prey to volatility, scams, or emotions. By learning and applying structured crypto trading strategies like HODLing, day trading, swing trading, scalping, and advanced techniques like arbitrage or hedging, traders can approach the market with confidence.
Success in crypto doesn’t come overnight. It’s built through education, discipline, and consistent execution. The right strategy—combined with risk management and emotional control—can turn crypto from a gamble into a rewarding investment journey.

Entry to Exit: Step-by-Step Trade Management1. Introduction
Trading is not only about finding the right entry point—it’s about how you manage your trade once you’re inside the market. Many beginners spend countless hours searching for the “perfect” entry strategy, but professionals know that trade management is where the real game is won or lost.
Think of trading as a journey. Entry is the start, exit is the destination, and trade management is the road that connects the two. Without proper management, even the best entry signals can turn into losing trades. On the other hand, with disciplined management, even an average entry can become profitable.
In this guide, we’ll break down the entire trade lifecycle—from preparation to execution, from entry to exit—step by step.
2. Pre-Trade Preparation
Before entering a trade, preparation is key. Just like a pilot runs through a checklist before takeoff, a trader should have a trade checklist.
🔹 Market Research & Analysis
Study broader market trends (bullish, bearish, sideways).
Check fundamentals (earnings reports, economic news, sector performance).
Perform technical analysis (support/resistance levels, chart patterns, moving averages).
🔹 Building a Trade Plan
A trade without a plan is like sailing without a map. A strong trade plan includes:
Entry criteria – What signals will you wait for before entering?
Stop-loss level – Where will you cut the trade if it goes against you?
Target level – Where will you take profit?
Position size – How much capital will you risk?
🔹 Defining Risk per Trade
Professional traders don’t risk everything in one trade. A common rule is the 1-2% risk rule. For example:
If you have ₹1,00,000 capital and risk 1% per trade → max loss = ₹1,000.
This ensures survival even after multiple losing trades.
3. Entry Strategies
Your entry is the first step into the battlefield. A good entry maximizes reward while minimizing risk.
🔹 Types of Entries
Breakout Entries – Entering when price breaks a key resistance/support.
Pullback Entries – Waiting for price to retrace to a support/resistance level before entering.
Reversal Entries – Entering when trend shows signs of changing direction.
🔹 Confirmation Tools
Candlestick patterns (engulfing, hammer, doji).
Indicators (RSI for momentum, MACD for trend confirmation).
Volume analysis (rising volume = strong move).
🔹 Avoiding FOMO Entries
Jumping into trades without confirmation leads to poor risk-reward setups. Always stick to your predefined entry signals.
4. Stop Loss & Risk Management
Stop-loss is your insurance policy. Without it, one bad trade can wipe out weeks of profits.
🔹 Types of Stops
Hard Stop – Pre-set level, automatically exits trade.
Mental Stop – Decided in mind, but dangerous if emotions take over.
ATR Stop – Based on volatility (Average True Range).
🔹 Break-Even Adjustment
When trade moves in your favor, shift stop-loss to entry point → removes risk.
🔹 Risk-Reward Ratio (RRR)
Only take trades with minimum 1:2 or 1:3 ratio. Example: risk ₹1,000 for potential ₹2,000–₹3,000 gain.
5. Trade Monitoring & Mid-Trade Adjustments
Once in a trade, your job is to manage it intelligently.
🔹 When Market Moves in Your Favor
Use trailing stop-loss to lock profits.
Scale out gradually (book partial profits at key levels).
🔹 When Market Moves Against You
Never widen stop-loss (it increases risk).
Accept the loss gracefully—capital preservation is priority.
🔹 Scaling In & Out
Scaling in: Add to your position as trade confirms in your favor.
Scaling out: Reduce position gradually, booking partial profits while still staying in.
6. Trade Psychology
Emotions are the biggest enemy of traders. Fear and greed often sabotage good strategies.
🔹 Common Emotional Traps
Fear of Missing Out (FOMO) – Chasing trades without signals.
Fear of Loss – Closing positions too early.
Greed – Holding too long, ignoring exit plan.
🔹 Discipline Rules
Follow your plan, not your emotions.
Accept that losses are part of the game.
Think in terms of probabilities, not certainties.
7. Exit Strategies
A trade is not complete until you exit. Profits exist only when booked.
🔹 Exit Types
Target-Based Exit – Close trade when it hits your planned profit target.
Trailing Stop Exit – Ride trend while protecting profits.
Time-Based Exit – Exit if price doesn’t move within certain time.
🔹 Letting Profits Run
The hardest skill is to hold winners long enough while not giving back gains. Trailing stops help balance safety & profit.
🔹 Avoid Early Exits
Many traders exit too soon because of emotions. Always follow your planned exit rule, not short-term market noise.
8. Post-Trade Review
Every trade—win or lose—is a learning opportunity.
🔹 Trading Journal
Record every trade:
Entry, exit, stop-loss.
Reasons for trade.
Emotions felt.
Lessons learned.
🔹 Review Process
Analyze losing trades → were they due to bad setup or bad discipline?
Analyze winning trades → did you follow your plan, or was it luck?
Constantly refine your strategy.
9. Conclusion
Trade management is the bridge between analysis and profitability. The entry may give you the opportunity, but it’s management that determines the outcome.
Prepare before you trade.
Enter only with clear signals.
Manage risk with position sizing and stop-loss.
Control emotions during the trade.
Exit with discipline.
Learn from every trade.
By mastering trade management, you shift from gambling to professional trading. In the end, trading isn’t about predicting the market perfectly—it’s about managing uncertainty profitably, from entry to exit.
Part 10 Trading Master Class With ExpertsOptions in Hedging
Options are not only for speculation. Big institutions use them for hedging.
Portfolio Hedge: A fund holding ₹100 crore worth of Nifty stocks may buy Nifty puts. If the market crashes, puts rise in value, cushioning losses.
Corporate Hedge: A company expecting payment in USD may buy currency options to protect against rupee appreciation.
Commodity Hedge: A farmer may use options to lock in selling prices for crops.
Hedging reduces uncertainty and stabilizes income.
Options in Speculation
Speculators love options because:
Small premium = big exposure.
High leverage = high potential returns.
Flexibility to bet on direction, volatility, or time.
But speculation is risky. Most retail traders lose because they treat options as lottery tickets.
Options for Income Generation
Option sellers (writers) earn premium by providing liquidity to buyers.
Covered Call Writing: Regularly selling calls on owned stock generates income.
Cash-Secured Puts: Selling puts on stocks you’re willing to buy at lower prices.
Range-Bound Strategies (Iron Condors, Butterflies): Earn premium if stock stays within range.
Many professionals and institutions rely on option selling for consistent income.

Part 8 Trading Master Class With ExpertsNeutral Market Strategies
Sometimes traders expect the market to move sideways with low volatility. Options shine here:
Straddle: Buy a call & put at the same strike.
Profits if stock makes big move (up or down).
Expensive because of double premium.
Strangle: Buy OTM call & OTM put.
Cheaper than straddle.
Needs a strong move in any direction.
Iron Condor: Sell OTM call + sell OTM put + buy far OTM call + buy far OTM put.
Profits if stock stays within a range.
Popular income strategy.
Butterfly Spread: Combine calls or puts at 3 strike prices.
Best when expecting very little movement.
Advanced Strategies
Calendar Spread: Sell near-term option & buy long-term option at same strike.
Benefits from time decay differences.
Ratio Spread: Sell more options than you buy.
High-risk, high-reward.
Diagonal Spread: Mix of calendar & vertical spread.
Box Spread: Combination that locks in risk-free profit (used by arbitrageurs).
📌 Takeaway: Strategies allow traders to play in bullish, bearish, or neutral markets while controlling risk. Mastery of strategies separates professional traders from gamblers.

Part 7 Trading Master Class With ExpertsOptions vs. Futures vs. Stocks
Stocks: Simple ownership.
Futures: Obligation to buy/sell at a future date.
Options: Rights without obligation.
Options are less risky than futures (for buyers) but more complex.
Real-World Examples
Example 1: You buy Nifty 20,000 Call at ₹100 premium. Lot size = 50.
Cost = ₹5,000.
If Nifty rises to 20,200, your profit = ₹10,000 - ₹5,000 = ₹5,000.
If Nifty stays below 20,000, you lose only premium = ₹5,000.
Psychology & Risk Management
Options are not just math, they need psychology:
Don’t over-leverage.
Accept losses early.
Use stop-loss.
Stick to defined strategies.
Manage emotions of greed and fear.

Part 4 Learn Institutional Trading Option Greeks (Risk Measures)
Greeks are mathematical tools that measure how sensitive an option is to different factors:
Delta: Sensitivity to price change. (How much option moves if stock moves ₹1).
Gamma: Rate of change of delta.
Theta: Time decay (how much option loses value as expiry nears).
Vega: Sensitivity to volatility.
Rho: Sensitivity to interest rates.
Traders use Greeks to build precise strategies.
Option Strategies
Options can be combined into powerful strategies:
Single-leg: Buy call, Buy put, Sell call, Sell put.
Spreads: Bull call spread, Bear put spread.
Neutral strategies: Iron condor, Butterfly spread, Straddle, Strangle.
Advanced: Calendar spread, Ratio spread.
Each strategy suits different market conditions (bullish, bearish, sideways, volatile).

Part 2 Ride The Big MovesBasic Terminology
Before we dive deeper, let’s clear the basic terms in option trading:
Underlying Asset – The stock, index, commodity, or currency on which the option is based. Example: Nifty, Reliance, crude oil.
Option Contract – The agreement between buyer and seller of the option.
Call Option – Gives the holder the right (but not obligation) to buy the underlying asset at a fixed price before expiry.
Put Option – Gives the holder the right (but not obligation) to sell the underlying asset at a fixed price before expiry.
Strike Price – The price at which the option holder can buy (call) or sell (put) the underlying.
Expiry Date – The last date when the option can be exercised. In India, stock options usually expire monthly or weekly (for indices).
Premium – The price you pay to buy an option contract. It’s like a ticket fee for having the right to buy or sell in the future.
Lot Size – Each option contract is traded in fixed quantities called lots. Example: Nifty option lot = 50 units.
How Options Work
Imagine you want to buy a house worth ₹50 lakhs, but you’re unsure whether the price will rise or fall in the next 6 months. Instead of paying ₹50 lakhs now, you strike a deal with the owner:
You pay ₹2 lakhs today as a non-refundable fee (premium).
You get the right to buy the house anytime in the next 6 months at ₹50 lakhs (strike price).
Now:
If the house price rises to ₹60 lakhs, you can still buy it at ₹50 lakhs and make a profit.
If the house price falls to ₹45 lakhs, you can walk away. You lose only the ₹2 lakhs premium.
This is exactly how a call option works.
A put option is the reverse: you get the right to sell something at a fixed price, useful if you think prices will fall.
So options are all about rights, not obligations. The buyer has rights, the seller has obligations.

Inflation and Its Impact on Markets1. Understanding Inflation
1.1 Definition
Inflation is the rate at which the general level of prices for goods and services rises, eroding the purchasing power of money. If the inflation rate is 6% annually, an item costing ₹100 this year will cost ₹106 the next year, assuming all else remains equal.
1.2 Causes of Inflation
Economists generally classify inflation into two broad categories:
Demand-Pull Inflation – Occurs when aggregate demand in an economy outpaces aggregate supply. Example: rising consumer spending, government expenditure, or investment that pushes up prices.
Cost-Push Inflation – Triggered when production costs rise (e.g., due to higher wages, raw material costs, or supply chain disruptions), and businesses pass these costs onto consumers.
Other causes include monetary expansion (too much money chasing too few goods), structural bottlenecks, taxation policies, or geopolitical crises that disrupt supply chains.
1.3 Types of Inflation
Creeping Inflation: Mild (1–3% annually), often seen as healthy for growth.
Walking Inflation: Moderate (3–10% annually), may start hurting purchasing power.
Galloping Inflation: Double-digit inflation, destabilizes economies.
Hyperinflation: Prices rise uncontrollably (e.g., Zimbabwe, Venezuela).
Stagflation: Inflation combined with stagnation in economic growth and high unemployment (1970s U.S. example).
Deflation: Persistent fall in prices, often damaging as it discourages spending and investment.
1.4 Measuring Inflation
Common indicators include:
Consumer Price Index (CPI): Tracks retail prices of a basket of goods and services.
Wholesale Price Index (WPI): Measures price changes at the wholesale level.
Producer Price Index (PPI): Monitors prices from the producer’s perspective.
GDP Deflator: Broader measure of inflation in an economy.
2. Inflation and Its Impact on Financial Markets
Inflation has a multi-dimensional impact on different segments of financial markets. Let’s examine them one by one.
2.1 Impact on Stock Markets
Stocks represent ownership in companies, and inflation affects corporate earnings, investor sentiment, and valuation multiples.
Corporate Profits:
Rising inflation increases costs of raw materials, wages, and borrowing. If companies cannot pass these costs to consumers, their profit margins shrink.
Valuation Multiples:
Higher inflation leads to higher interest rates (central banks hike rates to control inflation). As rates rise, the present value of future cash flows declines, leading to lower stock valuations (P/E ratios fall).
Sectoral Impact:
Winners: Commodity producers (oil, metals, agriculture), energy firms, FMCG companies with strong pricing power.
Losers: Consumer discretionary, technology, and financials (due to margin pressure and higher cost of capital).
Investor Sentiment:
Inflation creates uncertainty. Equity markets often turn volatile during inflationary phases as investors reassess growth prospects.
Example: In the 1970s U.S., inflation was extremely high due to oil shocks, and stock markets delivered poor real returns.
2.2 Impact on Bond Markets
Bonds are highly sensitive to inflation because they provide fixed income.
Interest Rates and Yields: When inflation rises, central banks raise policy rates. This pushes bond yields up, causing bond prices to fall.
Real Returns: Inflation erodes the real return of fixed-income instruments. For example, if a bond yields 5% but inflation is 7%, the real return is –2%.
Inflation-Indexed Bonds: Governments issue instruments like TIPS (Treasury Inflation-Protected Securities) in the U.S. or Inflation-Indexed Bonds in India to protect investors.
Conclusion: High inflation is generally negative for bondholders, except for inflation-linked securities.
2.3 Impact on Currency Markets
Inflation has direct implications for currency values in the forex market.
Currency Depreciation: High inflation erodes purchasing power and often leads to depreciation of a country’s currency.
Interest Rate Differential: Central banks raise rates to curb inflation, which can temporarily strengthen a currency due to higher returns on domestic assets.
Trade Balance: Inflation makes exports costlier and imports cheaper, widening trade deficits, further pressuring the currency.
Example: Turkish lira has depreciated sharply in recent years due to persistently high inflation.
2.4 Impact on Commodity Markets
Commodities as Hedge: Commodities like gold, oil, and agricultural goods often perform well during inflationary periods, as they are tangible assets.
Input Cost Pressures: Rising commodity prices themselves fuel inflation, creating a feedback loop.
Energy Prices: Oil price shocks are among the most common triggers of global inflation.
2.5 Impact on Real Estate
Real estate is often seen as a hedge against inflation.
Positive Effects: Property values and rental incomes tend to rise with inflation, protecting investors.
Negative Effects: High interest rates increase mortgage costs, reducing affordability and slowing demand.
Commercial Real Estate: Long-term leases may lag inflation, impacting yields for landlords.
3. Inflation and Central Bank Policies
Central banks, such as the Federal Reserve (U.S.), European Central Bank (ECB), and Reserve Bank of India (RBI), play a pivotal role in managing inflation.
3.1 Tools of Monetary Policy
Interest Rate Hikes: To cool demand.
Open Market Operations: Controlling money supply.
Cash Reserve Ratio / Statutory Liquidity Ratio: Used by RBI to regulate liquidity.
Forward Guidance: Communicating policy stance to manage expectations.
3.2 Inflation Targeting
Many central banks adopt formal inflation targets (e.g., 2% in the U.S. and Eurozone, 4% in India) to maintain price stability.
3.3 Dilemma for Policymakers
Too Aggressive Tightening: Risks slowing growth or causing recession.
Too Soft: Risks runaway inflation.
4. Historical and Global Case Studies
4.1 The U.S. in the 1970s – Stagflation
Oil price shocks triggered high inflation + low growth.
Stock markets stagnated, bonds suffered, commodities soared.
4.2 Zimbabwe (2000s) – Hyperinflation
Prices doubled every few hours.
Currency lost value, people resorted to barter trade.
Financial markets collapsed.
4.3 India (2010–2013) – High Inflation Phase
CPI and WPI inflation soared due to food and fuel prices.
RBI raised rates multiple times, slowing growth.
Equity markets remained volatile, bond yields spiked.
4.4 Pandemic & Post-Pandemic (2020–2023)
Global supply chain disruptions + fiscal stimulus led to inflation surge.
Central banks responded with aggressive rate hikes.
Stock markets turned volatile, real estate demand shifted, commodity prices spiked.
5. Inflation and Investor Strategies
Investors cannot control inflation, but they can adapt strategies to protect their wealth.
5.1 Hedging Against Inflation
Commodities: Gold, silver, oil, agricultural products.
Real Assets: Real estate, infrastructure.
Equities: Companies with strong pricing power, dividend-paying stocks.
Inflation-Protected Bonds: TIPS, index-linked government securities.
5.2 Portfolio Diversification
Balancing equities, bonds, commodities, and alternative assets reduces the risk of inflation eroding overall portfolio value.
5.3 Sector Rotation
Moving investments into inflation-friendly sectors (energy, utilities, consumer staples) during high inflationary phases.
6. Broader Economic and Social Implications
Purchasing Power: Consumers struggle as essential goods (food, fuel) become costlier.
Wage-Price Spiral: Workers demand higher wages → businesses increase prices → further inflation.
Inequality: Inflation hurts low-income households more, as they spend a larger share of income on essentials.
Political Instability: Persistent inflation can lead to social unrest, protests, and government changes.
7. Conclusion
Inflation is a double-edged sword. Controlled inflation is a sign of a healthy, growing economy, ensuring that demand is strong and businesses are profitable. But when inflation becomes excessive or unpredictable, it erodes purchasing power, distorts investment decisions, destabilizes financial markets, and undermines trust in economic management.
Its impact on markets is wide-ranging:
Stocks face pressure due to higher costs and lower valuations.
Bonds lose value as yields rise.
Currencies depreciate if inflation is uncontrolled.
Commodities and real estate often benefit, acting as hedges.
For policymakers, investors, and ordinary citizens, understanding inflation is essential. It is not merely an economic indicator but a force that shapes market dynamics, business strategies, and household decisions. In an interconnected global economy, inflation in one part of the world can ripple across continents, influencing global capital flows and market stability.

Options vs Buying & Selling in TradingPart 1: Basics of Buying & Selling in Trading
1.1 How It Works
Buying (going long): The trader purchases an asset, expecting its price to rise. Profit comes from selling it later at a higher price.
Selling (going short): The trader sells an asset they don’t own (borrowing it from a broker), expecting its price to fall. Profit comes from buying it back later at a lower price.
Example:
If you buy 100 shares of Tata Steel at ₹120 and sell at ₹150, your profit = ₹30 × 100 = ₹3,000.
If you short 100 shares of Infosys at ₹1,500 and later buy them back at ₹1,400, your profit = ₹100 × 100 = ₹10,000.
1.2 Characteristics of Traditional Trading
Ownership: When you buy, you actually own the asset.
Unlimited upside, unlimited downside (in shorting): Long trades can theoretically go up infinitely, but short trades carry unlimited loss potential.
Capital intensive: You must pay the full value of the asset (unless using margin).
Time horizon: No expiry date; you can hold as long as you want.
1.3 Advantages
Simple and easy to understand.
Ownership benefits like dividends, voting rights in stocks.
No expiry pressure.
1.4 Risks
Large capital required.
Losses can be significant if the market goes against you.
Limited flexibility in terms of strategy.
Part 2: Basics of Options Trading
2.1 What Are Options?
Options are derivative contracts that derive value from an underlying asset (like stocks, indices, commodities, or currencies).
Call Option: Right to buy the asset at a fixed price (strike price).
Put Option: Right to sell the asset at a fixed price.
Options are rights, not obligations. The buyer of an option can choose whether to exercise it, while the seller (writer) is obligated to honor it.
2.2 Example of Options
Suppose Nifty is at 20,000.
You buy a Nifty 20,000 Call Option for a premium of ₹200.
If Nifty rises to 20,500 at expiry, the option’s value = 500. Profit = (500 – 200) = ₹300 per unit.
If Nifty falls to 19,500, you lose only the premium = ₹200.
2.3 Key Features
Leverage: Small premium controls a large value of the asset.
Limited risk for buyers: Maximum loss = premium paid.
Variety of strategies: Options allow profit from up, down, or sideways markets.
Time-bound: Every option has an expiry date.
2.4 Advantages
Cost-efficient way to take positions.
Hedging tool for managing risk.
Flexibility in designing strategies.
Defined risk when buying options.
2.5 Risks
For buyers: Premium decay (time value erosion).
For sellers: Potential unlimited losses.
Complexity compared to direct buying and selling.
Part 3: Options vs Buying/Selling – A Direct Comparison
Feature Traditional Buying/Selling Options Trading
Ownership Yes (when buying) No, it’s a contract
Capital Requirement High Low (premium only)
Leverage Limited (margin needed) Built-in leverage
Risk Unlimited (in shorting) Limited for buyers, unlimited for sellers
Profit Potential Unlimited upside (long) Defined, depending on strategy
Expiry None Always has expiry
Complexity Simple Complex
Uses Investing, long-term holding Hedging, speculation, income strategies
Part 4: Practical Use Cases
4.1 When to Use Traditional Buying & Selling
Long-term investing in stocks.
When you want ownership (e.g., dividends).
When you want simple exposure to price movements.
4.2 When to Use Options
Hedging: An investor holding a stock portfolio buys put options to protect against a fall.
Speculation: A trader buys calls when expecting a sharp rally.
Income generation: Selling options (like covered calls) to earn premiums.
Event trading: Using straddles/strangles during earnings announcements.
Part 5: Risk Management
5.1 In Buying/Selling
Use stop-loss orders.
Diversify portfolio.
Avoid over-leverage.
5.2 In Options
Stick to defined-risk strategies (like spreads).
Understand implied volatility.
Avoid naked option selling without capital cushion.
Part 6: Psychological Differences
Buying & Selling: Feels straightforward, intuitive. Less cognitive load.
Options: Requires strong understanding of Greeks (Delta, Gamma, Theta, Vega). Traders must accept probability-based outcomes.
Part 7: Real-Life Example Comparison
Imagine you expect Reliance to rise from ₹2,500 to ₹2,700.
Method 1 – Buying Shares:
Buy 100 shares @ ₹2,500 = ₹2,50,000 invested.
If price hits ₹2,700 → Profit = ₹20,000.
Risk: If it falls to ₹2,300 → Loss = ₹20,000.
Method 2 – Buying Call Option:
Buy Reliance 2,500 Call @ ₹50 premium = ₹5,000 invested.
If Reliance rises to ₹2,700, intrinsic value = ₹200. Profit = (200 – 50) × 100 = ₹15,000.
If Reliance falls to ₹2,300, loss = only premium ₹5,000.
Here, options gave higher percentage return with limited risk.
Part 8: Long-Term Perspective
Investors prefer buying & holding stocks, as they represent ownership in a growing business.
Traders often use options for short-term moves, hedging, and leverage.
Smart portfolios often combine both: owning core assets while using options for risk management.
Conclusion
Traditional buying and selling is like owning the road—it’s direct, long-term, and stable. Options are like renting a sports car for a specific race—cheaper, faster, but requiring skill and timing.
Neither is inherently better. It depends on:
Risk appetite
Capital available
Market view
Time horizon
Experience level
For beginners, direct buying and selling is a solid foundation. For advanced traders, options open new horizons of creativity and control.
Risk Smart, Grow Fast in TradingIntroduction
Trading has always been seen as a path to quick money, fast success, and even financial freedom. But the truth is that trading is not a get-rich-quick game. For every successful trader who grows fast, there are hundreds who lose money because they ignore the most important foundation of trading: risk management.
“Risk Smart, Grow Fast” is not just a catchy phrase. It’s a principle, a mindset, and a strategy. It means that if you manage your risks wisely, protect your capital, and make decisions with discipline, you can grow faster and more sustainably than if you blindly chase high returns. In fact, smart risk management is the engine that powers growth in trading.
This essay explores the philosophy, strategies, tools, and psychology behind trading with a “Risk Smart, Grow Fast” approach.
Part 1: Why Risk Management Is More Important Than Profit
Most new traders focus on one question: “How much can I make?” The right question, however, is: “How much can I lose if I’m wrong?”
In trading, risk always comes before reward. Here’s why:
Capital Preservation – Without capital, there’s no trading. Losing 50% of your account requires a 100% gain to break even. Protecting your downside ensures you stay in the game.
Compounding Effect – Smaller drawdowns allow compounding to work more efficiently. Even modest profits can grow exponentially when losses are controlled.
Emotional Stability – Large losses trigger fear, stress, and revenge trading. Smart risk control keeps emotions in check, enabling rational decision-making.
Sustainable Growth – Fast growth through reckless risk-taking often ends in collapse. True fast growth comes from controlled risk that compounds over time.
Key Idea: You cannot grow fast unless you manage risk smartly.
Part 2: What Does “Risk Smart” Really Mean?
Being risk smart doesn’t mean avoiding risk altogether. Trading is risk by nature; without risk, there is no reward. Instead, it means taking calculated risks that are aligned with your trading strategy, capital, and goals.
Core principles of being Risk Smart:
Position Sizing – Risking only a small percentage of your capital on each trade (usually 1–2%).
Stop Loss Discipline – Always knowing where you will exit if the trade goes wrong.
Diversification – Not putting all capital into one stock, sector, or instrument.
Risk/Reward Ratio – Ensuring potential reward is at least 2–3 times the risk.
Capital Allocation – Spreading money between short-term trades, long-term investments, and safe reserves.
Think of being risk smart like wearing a seatbelt while driving fast. You may enjoy the thrill of speed, but the seatbelt ensures survival if things go wrong.
Part 3: The Growth Mindset in Trading
While being risk smart focuses on protection, “grow fast” focuses on maximizing opportunities. Growth in trading is not just about profits, but also about knowledge, experience, and adaptability.
Components of the Growth Mindset:
Learning from Losses – Every loss is tuition. Smart traders don’t fear losses; they analyze them to refine strategies.
Adapting to Market Conditions – Markets change; strategies must evolve. What works in a trending market may fail in a choppy one.
Scaling Up Gradually – Growing fast doesn’t mean doubling your risk overnight. It means compounding small consistent gains until you can trade larger with confidence.
Leveraging Technology – Using charting tools, algo trading, backtesting, and data analytics to grow faster than traditional traders.
Mind and Body Discipline – Growth requires sharp focus, emotional control, and physical health. Trading is mental warfare; stamina matters.
Part 4: Balancing Risk and Growth
The challenge is balancing risk smart and grow fast. Too much focus on risk may lead to over-caution, missing opportunities. Too much focus on growth may cause reckless risk-taking.
Here’s how to strike the balance:
Risk Small, Scale Big – Start by risking 1–2% per trade. As your capital grows, absolute profits grow faster.
Compound Gains – Reinvest profits strategically instead of withdrawing all earnings.
Optimize Position Sizing – Adjust size based on volatility, conviction, and account size.
Use Asymmetric Setups – Look for trades where upside is significantly greater than downside.
Review Weekly, Act Daily – Analyze risk exposure weekly while executing growth trades daily.
Part 5: Practical Risk Smart Techniques
The 1% Rule – Never risk more than 1% of account value on a single trade.
Example: With $10,000 capital, maximum risk per trade = $100.
The 2:1 or 3:1 Rule – For every $1 risked, aim to make $2–$3.
Stop Loss & Trailing Stops – Set stop losses for protection and use trailing stops to lock profits as the trade moves in your favor.
Risk Diversification –
Across asset classes (stocks, forex, commodities, crypto).
Across sectors (IT, pharma, banking).
Across time horizons (scalping, swing, long-term).
Hedging with Options – Using protective puts or covered calls to cap downside risk.
Volatility Awareness – Adjusting position size based on market volatility (e.g., smaller trades during high VIX).
Part 6: Strategies to Grow Fast
Trend Following – Capturing large moves in trending markets. “The trend is your friend” until it bends.
Breakout Trading – Entering when price breaks major support/resistance levels with volume confirmation.
Swing Trading – Exploiting short- to medium-term price swings for consistent growth.
Position Trading – Holding positions for weeks/months based on macro or sectoral trends.
Leverage Smartly – Using moderate leverage to accelerate growth, but only when risk is tightly controlled.
Scaling In and Out – Adding to winning trades (pyramiding) and reducing exposure on uncertainty.
Part 7: Psychology of Risk Smart Growth
Trading success is 20% strategy and 80% psychology. To “risk smart, grow fast,” a trader must master their mind.
Discipline Over Impulse – Following the plan, not emotions.
Patience to Wait – Avoiding overtrading. Opportunities will always come.
Resilience to Losses – Viewing losses as part of the game, not personal failure.
Confidence Without Arrogance – Trusting your system but staying humble before markets.
Growth Mindset – Believing that skills improve with practice, not fixed by talent.
Part 8: Case Studies
Case 1: The Reckless Trader
Rahul had ₹5 lakhs and doubled it in 3 months by taking huge leveraged bets on penny stocks. But one wrong move wiped out 80% of his capital. His fast growth collapsed because he was not risk smart.
Case 2: The Risk Smart Trader
Anita had ₹5 lakhs too. She risked only 1% per trade, focused on high R/R setups, and compounded profits. In one year, she grew her account to ₹7.5 lakhs steadily. She didn’t double it overnight, but her growth was sustainable and replicable.
Lesson: Fast reckless growth often leads to collapse. Risk smart growth compounds wealth.
Part 9: Tools for Risk Smart Growth
Trading Journal – Records trades, mistakes, emotions, and improvements.
Risk Calculators – To determine position size before placing a trade.
Charting Platforms – TradingView, MetaTrader, NinjaTrader.
Backtesting Software – To validate strategies before applying real capital.
News & Data Feeds – For staying ahead of market-moving events.
AI & Algo Tools – Automating discipline and minimizing emotional decisions.
Part 10: The Roadmap to “Risk Smart, Grow Fast”
Foundation – Learn basics, risk management, and trading psychology.
System Development – Build and backtest your own trading strategy.
Capital Protection – Apply strict stop losses and position sizing.
Small Scale Trading – Start with small capital or paper trading.
Gradual Scaling – Increase trade size as consistency improves.
Compounding Phase – Reinvest profits to accelerate growth.
Mastery & Automation – Use technology and delegation for efficiency.
Conclusion
“Risk Smart, Grow Fast” is not just a slogan—it’s the essence of long-term trading success. The markets will always remain uncertain, volatile, and risky. But if you respect risk, embrace discipline, and use smart strategies, you can not only survive but thrive.
Fast growth in trading doesn’t come from reckless gambling—it comes from the slow magic of compounding, powered by smart risk management.
In the end, trading is like sailing. The winds of the market are unpredictable, but if you set your sails wisely, control your risks, and ride the waves with patience, you can reach your destination faster than you ever imagined.
Trading Master Class With ExpertsBeginner-Friendly Option Trading Strategies
Let us now study some beginner-friendly option trading strategies in detail.
Covered Call Strategy
Best for: Investors who already own shares.
Market Outlook: Neutral to slightly bullish.
How it works:
Buy or hold 100 shares of a company.
Sell (write) a call option on the same stock.
Example:
You own Infosys shares bought at ₹1600.
You sell a call option at strike ₹1700 for ₹30 premium.
Outcomes:
If Infosys stays below ₹1700, you keep the ₹30 premium (profit).
If Infosys rises above ₹1700, you must sell shares at ₹1700. You still make profit because your cost was ₹1600.
Pros:
Generates steady income.
Low risk.
Cons:
Your profit is capped if stock rises sharply.
Educational takeaway: A covered call is like earning rent on a property you own.
Protective Put Strategy
Best for: Investors who want insurance for their portfolio.
Market Outlook: Bullish, but with fear of downside risk.
How it works:
Buy shares of a company.
Buy a put option for protection.
Example:
You buy TCS shares at ₹3600.
You purchase a put option with strike ₹3500 for ₹50.
If TCS falls to ₹3300, your shares lose ₹300. But your put option gains value, limiting your losses.
Pros:
Acts like insurance.
Protects against big losses.
Cons:
Premium cost reduces net return.
Educational takeaway: A protective put is like buying health insurance—you hope not to use it, but it provides safety.

Part 2 Support and ResistenceRisk Management in Options for Beginners
Options are risky if not handled well. Here’s how beginners can manage risks:
Never trade with all capital – Use only 10-20% of portfolio in options.
Set stop-loss – Don’t let losses grow.
Choose liquid contracts – Always trade in Nifty, Bank Nifty, or large-cap stocks with high liquidity.
Understand time decay (Theta) – Options lose value as expiry approaches.
Avoid shorting naked options – Unlimited risk for beginners.
Common Mistakes Beginners Make
Buying out-of-the-money options hoping for jackpot.
Ignoring Greeks (Delta, Theta, Vega).
Overtrading with small capital.
Trading without a strategy.
Not exiting on time.
Tips for Beginners to Succeed
Start with paper trading before real money.
Focus on 1-2 simple strategies (covered call, spreads).
Learn technical + fundamental analysis.
Be disciplined—don’t chase quick money.
Track and review trades weekly.

Part 1 Support and ResistenceLong Straddle (High Volatility Bet)
Best for: Beginners who expect big move but don’t know direction.
Market Outlook: High volatility (e.g., before results, elections).
How it works:
Buy a call and a put at same strike price.
Example:
Nifty at 22,000.
Buy 22,000 call at ₹150.
Buy 22,000 put at ₹160.
Total cost = ₹310.
If Nifty moves strongly (up or down), one option gives profit. If Nifty stays flat, you lose premium.
✅ Pros: Profit in any direction.
❌ Cons: Expensive, loses money in sideways market.
Long Strangle (Cheaper Volatility Bet)
Similar to straddle but uses different strike prices.
Example: Buy 21,800 put + 22,200 call.
Cheaper than straddle but requires bigger move for profit.
Iron Condor (Sideways Market Strategy)
Best for: Beginners who think market will stay in range.
Market Outlook: Neutral.
How it works:
Sell an out-of-the-money call.
Buy a further out-of-the-money call.
Sell an out-of-the-money put.
Buy a further out-of-the-money put.
This creates a “range” where you earn profit.
✅ Pros: Works best in stable market.
❌ Cons: Complicated, limited profit.

PCR Trading Strategies Beginner-Friendly Option Trading Strategies
Here are the most important beginner strategies every new trader should know.
Covered Call Strategy (Low-Risk Income Strategy)
Best for: Beginners who already own stocks.
Market Outlook: Neutral to slightly bullish.
How it works:
You own 100 shares of a stock.
You sell a call option on the same stock.
Example:
You own Infosys shares at ₹1600.
You sell a call option with strike price ₹1700 for a premium of ₹30.
If Infosys stays below ₹1700, the option expires worthless, and you keep ₹30 per share as profit.
If Infosys rises above ₹1700, you sell at ₹1700 (still a profit because you bought at ₹1600).
✅ Pros: Steady income, limited risk.
❌ Cons: Profit capped if stock rallies big.
Protective Put (Insurance Strategy)
Best for: Investors who fear stock downside.
Market Outlook: Bullish but worried about risk.
How it works:
You own stock.
You buy a put option as insurance.
Example:
You own TCS shares at ₹3600.
You buy a put option at strike ₹3500 for ₹50 premium.
If TCS falls to ₹3300, your loss on stock is ₹300, but your put option gains value, protecting you.
✅ Pros: Protects against big losses.
❌ Cons: Premium cost reduces profits.

Part 1 Master Candlestick PatternRisk Management for Beginners
Risk management is the most important subject in options education. Even the best strategy fails without discipline.
Rules for beginners:
Never invest all capital in options (limit to 10–20%).
Always use stop-loss orders.
Trade in liquid contracts (like Nifty, Bank Nifty, large-cap stocks).
Understand Greeks (Delta = direction, Theta = time decay, Vega = volatility).
Avoid selling naked options (unlimited risk).
Common Mistakes Beginners Make
Buying cheap out-of-the-money options – They look attractive but often expire worthless.
Ignoring time decay – Options lose value daily.
Overtrading – Too many trades cause losses.
No exit plan – Holding losing positions too long.
Chasing quick profits – Leads to gambling behavior.
Educational Tips for Success
Start with paper trading to learn without risk.
Focus on 1–2 simple strategies first (covered call, spreads).
Keep a trading journal to track mistakes.
Read about market psychology.
Remember: protecting capital is more important than chasing profits.

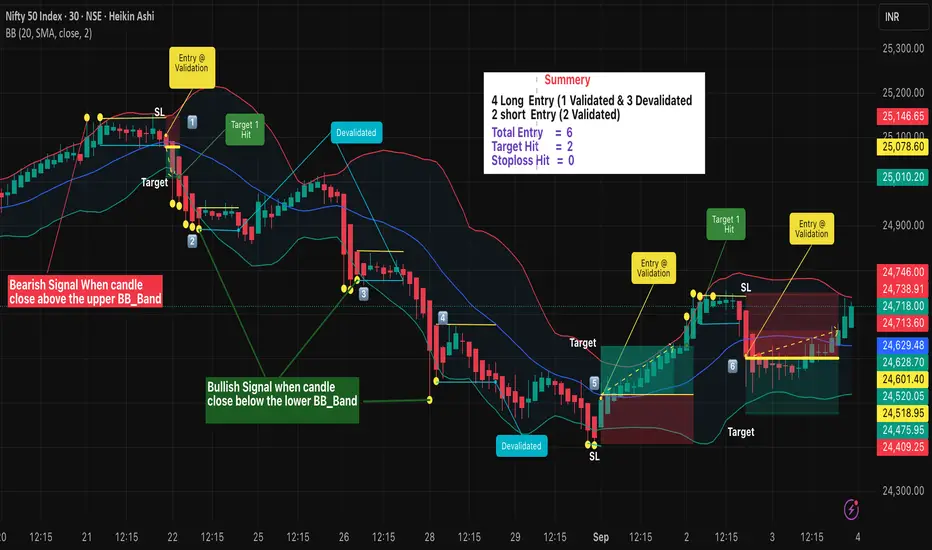
Heikin Ashi with Bollinger Bands – Rule-Based Reversal Strategy🔹 Intro / Overview
The Bollinger Bands are one of the most widely used indicators for identifying overbought and oversold market conditions.
They consist of an upper band, middle band (SMA), and lower band that expand and contract based on volatility.
In this setup, we focus on Bullish and Bearish signals generated when price closes outside the bands.
Heikin Ashi Chart In this idea Apply Boolinger band on Heikinashi chart to capture reversal signals.Heikin Ashi candles help reduce market noise, providing smoother price action and clearer trend signals.
When combined with Bollinger Bands, they offer disciplined entries, defined stop losses, and structured target management.
---
📖 How to Use
🔴 Bearish Signal - Appears after a uptrend
- Trigger → Candle closes above the Upper Band. (Signal candle)
- Candle High = Devalidation line.
- Candle Low = Validation line.
- Entry Confirmed → When price closes below the validation line.
- ❌ No Entry → If price moves above the devalidation line before validation.
🟢 Bullish Signal - Appears after a downtrend
- Trigger → Candle closes below the Lower Band. (Signal candle)
- Candle High = Validation line.
- Candle Low = Devalidation line.
- Entry Confirmed → When price closes above the validation line.
- ❌ No Entry → If price moves below the devalidation line before validation.
- 👉🏼 RESET → if Another New Trigger Comes Before Validation-Devalidation, the system RESET Validation and devalidation line to new values.
---
🎯 Trading Plan
- Entry → On validation close (Bearish: below signal Candle Low, Bullish: signal Candle above High).
- Stop Loss (SL) → Signal candle low for Bullish, signal candle high for Bearish.
- Target → 1R (equal to risk: Entry–SL distance).
- Remaining Lots → Trail with ATR, Fibonacci, Box Trailing, or structure-based stops for extended moves.
---
📊 Chart Explanation
1️⃣ 🛑Bearish Signal →
- Candle validated as price closed below the validation line .
- 🎯 Target 1 achieved, remaining lots managed with trailing methods. Exit may occur at swing bottom with best trailing method.
2️⃣ 🟢 Bullish Signal →
- ❌ Candle Devalidated as price closed below the devalidation line . . no Entry
3️⃣ 🟢Bullish Signal →
- ❌ Candle Devalidated as price closed below the devalidation line . . no Entry
4️⃣ 🟢Bullish Signal →
- ❌ Candle Devalidated as price closed below the devalidation line . . no Entry
5️⃣ 🟢Bullish Signal →
- Candle validated as price closed above the validation line
- 🎯 Target 1 achieved, remaining lots managed with trailing methods. Exit may occur at swing top with best trailing method.
6️⃣ 🛑Bearish Signal →
- Candle validated as price closed below the validation line .
-Still active during trading hours, monitoring continues.
---
👀 Observation
- Bearish signals are more effective during strong uptrends when volatility peaks.
- Bullish signals work best at market bottoms or oversold conditions.
- Early invalidations prevent false entries.
- Trailing stops allow scaling out while capturing bigger moves.
---
❗ Why It Matters?
- Provides rule-based trading using Bollinger Bands, not just blind signals.
- Validation & devalidation ensure disciplined entries.
- Helps traders avoid chasing moves by waiting for confirmation.
- Enhances risk management with clear SL & trailing systems.
---
🎯 Conclusion
The Bollinger Band Strategy offers structured bullish & bearish setups.
By combining validation lines, devalidation rules, and trailing systems, traders can capture high-probability trades while avoiding false signals.
🔥 Patterns don’t predict. Rules protect. 🚀
⚠️ Disclaimer
📘 For educational purposes only · 🙅 Not SEBI registered · ❌ Not a buy/sell recommendation · 🧠 Purely a learning resource · ❌ Not financial advice.
Quantitative Trading1. Introduction to Quantitative Trading
Quantitative trading, often called “quant trading”, refers to the use of mathematical models, statistical techniques, and computer algorithms to identify and execute trading opportunities in financial markets. Unlike traditional trading, where decisions may rely heavily on human intuition or fundamental analysis (such as studying company balance sheets or industry trends), quant trading uses data-driven models to make objective, systematic, and automated decisions.
At its core, quantitative trading answers a simple question:
Can we use numbers, patterns, and algorithms to predict price movements and make profitable trades?
Over the past few decades, quant trading has transformed financial markets. Large hedge funds, investment banks, and proprietary trading firms heavily rely on it to generate profits. In fact, some of the world’s most successful funds—such as Renaissance Technologies’ Medallion Fund—are almost entirely quant-driven.
2. The Evolution of Quantitative Trading
2.1 Early Beginnings
Quant trading is not entirely new. Even in the 1970s and 1980s, traders began using computers to run backtests and automate parts of their strategies. The Black-Scholes model (1973), which priced options mathematically, is often considered the birth of modern quant finance.
2.2 Rise of Computers and Data
In the 1990s, as computing power grew and financial markets digitized, quant trading became more widespread. Firms started processing huge amounts of tick-by-tick data to uncover hidden patterns.
2.3 High-Frequency Trading (HFT)
By the 2000s, high-frequency trading exploded. These strategies used ultra-fast algorithms to execute thousands of trades per second, capitalizing on micro-price movements.
2.4 Today’s Era
Now, quant trading has matured into multiple branches—statistical arbitrage, algorithmic execution, machine learning-driven strategies, and hybrid approaches. Artificial Intelligence (AI) and Big Data have added new layers, allowing traders to incorporate alternative data (like social media sentiment, satellite images, or shipping data) into their models.
3. Core Principles of Quantitative Trading
To understand quant trading, we need to break down its building blocks:
3.1 Data
The lifeblood of quant trading is data. Types of data include:
Market Data: Prices, volumes, bid-ask spreads, order books.
Fundamental Data: Earnings reports, balance sheets, macroeconomic indicators.
Alternative Data: Social media sentiment, credit card spending, satellite images, Google search trends.
3.2 Hypothesis and Strategy
Every quant strategy starts with a hypothesis. For example:
Stocks that fall sharply in one day tend to bounce back the next day (mean reversion).
Momentum stocks (those rising consistently) may keep rising for some time.
Statistical relationships exist between two correlated assets, like crude oil and airline stocks.
3.3 Mathematical Models
These hypotheses are turned into models using:
Statistics: Regression analysis, correlation, co-integration.
Probability: Predicting the likelihood of price changes.
Optimization: Determining the best allocation of capital across trades.
Machine Learning: Using algorithms like random forests, neural networks, or reinforcement learning to identify patterns.
3.4 Backtesting
Before risking real money, strategies are tested on historical data. The process checks:
Did the strategy work in the past?
Was it profitable after accounting for transaction costs?
How risky was it? (volatility, drawdowns, maximum loss)
3.5 Execution
Execution is the process of turning a signal into an actual trade. Execution itself can be algorithmic—using smart order routing, VWAP (Volume-Weighted Average Price) algorithms, or iceberg orders (which hide large trades).
3.6 Risk Management
Risk control is central to quant trading. Strategies are designed with limits:
Position Sizing: How much capital to allocate per trade.
Stop-Loss: Automatically cutting losses when prices move against you.
Diversification: Spreading across multiple assets, sectors, or markets.
4. Types of Quantitative Trading Strategies
Quant trading covers a wide spectrum of strategies:
4.1 Statistical Arbitrage
Exploiting price inefficiencies between related securities. Example:
If two historically correlated stocks diverge in price, a quant may short the overperformer and buy the underperformer, expecting reversion.
4.2 Trend Following
Strategies that bet on continuation of price momentum. Example:
Buy when the 50-day moving average crosses above the 200-day moving average.
4.3 Mean Reversion
Based on the belief that prices revert to their average. Example:
If a stock deviates 2 standard deviations from its mean, short it (if above) or buy it (if below).
4.4 High-Frequency Trading (HFT)
Ultra-fast algorithms that trade in microseconds. Types include:
Market Making: Posting continuous buy and sell quotes to profit from bid-ask spreads.
Latency Arbitrage: Exploiting delays in data transmission.
Event-Driven Trading: Reacting instantly to news releases or earnings announcements.
4.5 Machine Learning & AI-Driven
Using algorithms like neural networks or reinforcement learning to detect complex, non-linear relationships in data. Example:
Predicting intraday stock price direction using Twitter sentiment and order book dynamics.
4.6 Quant Macro
Models that trade currencies, bonds, and commodities based on global economic indicators like interest rates, inflation, or GDP growth.
4.7 Options & Derivatives Trading
Quant strategies often involve options due to their complexity. For instance:
Volatility Arbitrage: Exploiting differences between implied and realized volatility.
5. Tools and Technologies in Quant Trading
Quantitative trading is powered by technology. Some common tools include:
Programming Languages: Python, R, C++, Java, MATLAB.
Data Platforms: Bloomberg, Refinitiv, Quandl, Tick Data providers.
Trading Platforms: Interactive Brokers, MetaTrader, FIX protocol systems.
Libraries & Frameworks:
Python: Pandas, NumPy, Scikit-learn, PyTorch, TensorFlow.
R: Quantmod, xts, caret.
Databases: SQL, MongoDB, time-series databases.
Execution Infrastructure: Low-latency connections, co-located servers near exchanges.
6. Advantages of Quantitative Trading
Objectivity: Decisions are based on models, not emotions.
Speed: Algorithms execute trades far faster than humans.
Scalability: One model can trade across hundreds of securities simultaneously.
Backtesting: Strategies can be validated before deployment.
Diversification: Easier to spread across multiple asset classes.
7. Challenges and Risks of Quantitative Trading
Overfitting: A model may look great on past data but fail in real markets.
Market Changes: Patterns may stop working as markets evolve.
Data Quality Issues: Inaccurate or incomplete data leads to wrong signals.
High Competition: Many firms run similar models, reducing profitability.
Execution Costs: Transaction costs, slippage, and latency can eat profits.
Black-Box Risk: Complex models (especially AI) may make trades that are hard to interpret.
8. Risk Management in Quantitative Trading
Risk management is non-negotiable. Techniques include:
Value at Risk (VaR): Measuring the maximum expected loss at a given confidence level.
Stress Testing: Simulating extreme market conditions.
Stop-Losses and Circuit Breakers: Automatic exit rules to prevent catastrophic losses.
Capital Allocation Rules: Ensuring no single trade wipes out the portfolio.
9. Real-World Examples
9.1 Renaissance Technologies
Perhaps the most famous quant firm. Its Medallion Fund reportedly generates over 30–40% annual returns, net of fees, by using secretive statistical models.
9.2 Two Sigma
Another large quant fund that integrates AI, big data, and distributed computing to identify global trading opportunities.
9.3 Citadel Securities
A market-making giant using advanced quantitative models for execution and liquidity provision.
10. Ethical and Regulatory Aspects
Quant trading has sparked debates:
Fairness: Is HFT giving large firms an unfair edge?
Market Stability: Algorithms may trigger flash crashes (e.g., May 2010 Flash Crash).
Transparency: Regulators worry about opaque AI-driven “black-box” strategies.
Regulations: Different countries regulate algorithmic trading differently (e.g., SEBI in India, SEC in the U.S.).
Conclusion
Quantitative trading represents the intersection of finance, mathematics, statistics, and computer science. It replaces gut-feeling decisions with systematic, data-driven approaches, creating a more efficient and liquid marketplace.
However, quant trading is not risk-free. Over-reliance on models, data biases, or sudden market regime shifts can lead to large losses. Successful quant traders balance mathematical rigor with risk management, adaptability, and technological innovation.
As markets evolve, quantitative trading will continue to expand—shaped by AI, machine learning, alternative data, and possibly even quantum computing. The future belongs to those who can combine creativity with computation, turning raw numbers into actionable strategies.
Zero-Day Option Trading – A Complete GuideIntroduction
In the ever-evolving world of financial markets, few innovations have captured as much attention in recent years as Zero-Day-to-Expiration (0DTE) options, often called zero-day options. These are options contracts that expire on the same day they are traded. While options have existed for decades, the rise of same-day expirations has changed the dynamics of short-term trading, introducing new opportunities as well as new risks.
For traders seeking quick profits, hedging opportunities, or exposure to rapid intraday movements, zero-day options have become a favored tool. But they also come with significant dangers, often magnified compared to traditional options. Understanding how they work, why they have become so popular, and what strategies traders use is essential for anyone interested in modern derivatives trading.
This article explores zero-day option trading in detail, covering their mechanics, advantages, risks, strategies, psychology, and impact on markets.
1. What Are Zero-Day Options?
Options are derivative contracts that give the buyer the right, but not the obligation, to buy (call option) or sell (put option) an underlying asset at a predetermined price (strike price) before or on expiration. Traditionally, options had expiration cycles that were weekly or monthly.
Zero-Day Options (0DTE): These are options that expire on the same day they are traded. If you buy or sell such an option at 9:30 AM when the market opens, it will expire by the market close that same day.
Origins: Initially, exchanges like the Chicago Board Options Exchange (CBOE) offered weekly options on popular indices like the S&P 500 (SPX). Over time, demand for shorter expirations grew, leading to daily expirations. Today, in major U.S. indices, traders can find options expiring every trading day.
Key Example: The most liquid zero-day options are SPX 0DTE options, which allow traders to speculate or hedge intraday moves of the S&P 500.
In essence, 0DTE options compress what used to be a weeks-long or months-long trade into just a few hours.
2. Why Have Zero-Day Options Become Popular?
Several factors have fueled the explosion of interest in zero-day trading:
Rise of Retail Traders: Platforms like Robinhood and Zerodha have democratized access, allowing small traders to speculate intraday with relatively low capital.
Volatility Opportunities: Daily market fluctuations create many chances for fast profits.
Low Premiums: Because these contracts have almost no time value, their premiums are much cheaper than longer-term options, making them attractive to small traders.
Hedging Flexibility: Institutional players use 0DTE options to hedge positions in real-time without holding long-dated contracts.
Algorithmic Trading: Quant funds and high-frequency traders (HFTs) use 0DTE contracts to profit from micro-movements.
In short, they offer speed, flexibility, and leverage—three qualities traders love.
3. Characteristics of Zero-Day Options
Zero-day options differ from regular options in several ways:
Time Decay (Theta): Extremely rapid. An option may lose 50% of its value within an hour.
Implied Volatility (IV): Priced based on near-term expectations; sudden spikes can dramatically move premiums.
Gamma Risk: Very high. Small moves in the underlying asset lead to disproportionately large changes in option prices.
Liquidity: Typically very high in indices like SPX and Nifty Bank in India, enabling easy entry and exit.
Settlement: Most are cash-settled in indices, reducing delivery risk.
These properties make them both powerful trading tools and dangerous traps.
4. Advantages of Zero-Day Option Trading
High Leverage: Small premium outlay, large exposure.
Quick Turnaround: Ideal for intraday traders who want same-day settlement.
Hedging Capability: Institutions hedge unexpected intraday risks.
Lower Capital Requirement: No need to lock money for weeks.
Multiple Expiration Choices: Ability to tailor trades to exact days of market events (Fed meeting, earnings, etc.).
5. Risks of Zero-Day Option Trading
Despite the allure, 0DTE options are not for the faint-hearted:
Near-Total Premium Loss: Out-of-the-money contracts can expire worthless within hours.
Emotional Stress: Requires rapid decision-making; mistakes are common.
Gamma Squeeze Risk: Sudden moves cause exponential losses for sellers.
Limited Recovery Time: Unlike longer options, there’s no time to wait for reversal.
Overtrading: Easy access and cheap premiums tempt traders into gambling.
This is why professional traders often warn beginners against 0DTE trading unless they fully understand the risks.
6. Strategies in Zero-Day Option Trading
6.1 For Buyers
Directional Bets: Buy calls if bullish, puts if bearish. Best suited when expecting large intraday moves.
Lottery Tickets: Out-of-the-money calls/puts bought cheaply in hope of a big payoff.
6.2 For Sellers
Iron Condors / Spreads: Collect premiums by selling options with defined risk. Effective in low-volatility environments.
Straddles / Strangles: Sell both calls and puts to benefit from time decay, but risky if the market moves sharply.
Scalping with Credit Spreads: Institutions often sell 0DTE spreads to collect small but consistent income.
6.3 Advanced
Gamma Scalping: Adjusting delta exposure dynamically as prices move.
Event Plays: Trading around economic announcements (Fed rate decisions, jobs data, RBI policy in India).
7. Psychology of Zero-Day Trading
Trading 0DTE options is as much about psychology as strategy:
Discipline: Entering and exiting trades quickly.
Risk Control: Position sizing is critical since losses can escalate rapidly.
Avoiding Addiction: The lottery-like thrill can lead to compulsive trading.
Emotional Balance: Traders must accept frequent small losses and avoid revenge trading.
8. Institutional vs. Retail Participation
Retail Traders: Generally buyers, attracted to low-cost “lottery” trades.
Institutions: Primarily sellers or hedgers, using spreads and systematic strategies. They often exploit retail demand.
This asymmetry explains why retail often loses money while institutions profit consistently.
9. Zero-Day Options in India
In India, the NSE (National Stock Exchange) has introduced same-day weekly options expiries for Nifty and Bank Nifty. Every day now has an expiry, mirroring the U.S. trend.
Retail participation has surged due to low premiums.
Brokers have reported record turnover in Bank Nifty 0DTE contracts.
Regulators are closely monitoring systemic risks.
This trend is reshaping intraday derivatives trading in India.
10. Criticism and Concerns
Market Stability Risks: Some analysts argue that widespread 0DTE trading increases volatility.
Retail Losses: Evidence suggests most small traders lose money due to poor risk management.
Speculative Nature: Critics compare it to gambling, given how quickly money can be lost.
Despite these concerns, exchanges continue to expand offerings due to high demand.
Conclusion
Zero-day option trading is one of the most exciting yet dangerous developments in modern financial markets. It has transformed options into ultra-short-term instruments, blending elements of speculation, hedging, and high-frequency trading. For disciplined traders who understand risk, 0DTE options offer powerful opportunities. For undisciplined traders, they can be financial landmines.
In summary:
They offer speed, leverage, and flexibility.
They come with extreme risks, especially for retail traders.
Their rise is reshaping both U.S. and Indian derivatives markets.
Ultimately, success in zero-day options lies in combining knowledge, strategy, and psychology—while never forgetting the golden rule of trading: preserve capital first, seek profits second.
Part 9 Trading Masterclass With ExpertsIntroduction to Options
An option is a type of derivative contract. A derivative derives its value from an underlying asset, which could be a stock, index, commodity, currency, or bond. When you buy or sell an option, you don’t directly own the asset but instead own the right to buy or sell it at a pre-agreed price within a specific period.
At its core, an option is a contract between two parties:
The buyer (holder) of the option, who pays a premium for rights.
The seller (writer) of the option, who receives the premium and carries obligations.
Unlike shares, where ownership is straightforward, options deal with probabilities, rights, and conditions. This makes them flexible but also more complex.
Key Features of Options
Before diving deeper, let’s simplify the main features:
Underlying Asset – The financial instrument on which the option is based (e.g., Reliance Industries stock, Nifty50 index).
Strike Price (Exercise Price) – The price at which the underlying asset can be bought or sold.
Expiration Date (Maturity) – The last date the option can be exercised.
Option Premium – The cost of buying the option, paid upfront by the buyer to the seller.
Right but Not Obligation – The buyer can choose to exercise the option but is not compelled to.

Part 4 Institutional Trading Intermediate Strategies
(a) Bull Call Spread
Buy a call at lower strike and sell a call at higher strike.
Reduces cost but caps profit.
Good for moderately bullish markets.
(b) Bear Put Spread
Buy a put at higher strike, sell a put at lower strike.
Used in moderately bearish markets.
(c) Straddle
Buy one call and one put at the same strike and expiry.
Profits if stock makes a big move in either direction.
Expensive, requires high volatility.
(d) Strangle
Buy OTM call + OTM put.
Cheaper than straddle but needs a larger price move.
(e) Iron Condor
Combination of bull put spread + bear call spread.
Profits when price stays in a range.
Great for low-volatility environments.
