Fundamental Analysis in Trading1. Introduction to Fundamental Analysis
Fundamental analysis is based on the principle that a stock or asset has a true intrinsic value. The market price can often deviate from this intrinsic value due to short-term sentiment, speculation, or market inefficiencies. By analyzing the underlying factors that drive a company’s performance, traders can determine whether a stock is undervalued, overvalued, or fairly priced.
1.1 Difference Between Fundamental and Technical Analysis
Fundamental Analysis (FA): Focuses on why a stock should rise or fall over the long term. Considers financial statements, economic conditions, and industry trends.
Technical Analysis (TA): Focuses on how a stock moves in the short term. Uses charts, patterns, and indicators to predict price movements.
While TA is more suited for short-term traders, FA is preferred by long-term investors or swing traders who want to understand the real value of an asset.
2. Key Components of Fundamental Analysis
Fundamental analysis can be divided into microeconomic and macroeconomic factors.
2.1 Microeconomic Factors
These relate to the company or asset itself, including:
Financial statements: Balance Sheet, Income Statement, and Cash Flow Statement.
Management quality: Experience, track record, and corporate governance.
Products and services: Market demand, competitive edge, and innovation.
Competitive position: Market share, brand strength, and barriers to entry.
Profitability and growth potential: Revenue growth, margins, and scalability.
2.2 Macroeconomic Factors
These relate to the broader economy, affecting all companies in a sector or region:
GDP growth: Indicates overall economic health.
Interest rates: Affect borrowing costs and investment attractiveness.
Inflation: Influences consumer spending and company costs.
Exchange rates: Important for companies with international operations.
Political stability and regulations: Impact business operations and investor confidence.
3. Financial Statements and Their Importance
Financial statements are the core of fundamental analysis. They provide quantitative data about a company’s performance and financial health.
3.1 Income Statement
The income statement (profit and loss statement) shows a company’s revenue, expenses, and profit over a period.
Revenue (Sales): Total income from products/services.
Cost of Goods Sold (COGS): Direct costs of production.
Gross Profit: Revenue minus COGS.
Operating Expenses: Marketing, salaries, R&D.
Net Income: Profit after all expenses and taxes.
Example:
A company with growing revenue and net income over 5 years indicates strong operational performance.
3.2 Balance Sheet
The balance sheet provides a snapshot of a company’s assets, liabilities, and equity at a point in time.
Assets: Resources the company owns (cash, inventory, equipment).
Liabilities: Debts or obligations (loans, accounts payable).
Equity: Owners’ stake in the company (Assets − Liabilities).
Example:
High cash reserves and low debt often indicate a financially stable company.
3.3 Cash Flow Statement
This statement tracks cash inflows and outflows in three categories:
Operating Activities: Cash from core business operations.
Investing Activities: Cash spent or earned on assets and investments.
Financing Activities: Cash from loans, dividends, or share issuance.
Example:
A company may report profits but have negative cash flow, signaling potential liquidity issues.
4. Key Financial Metrics for Analysis
Several ratios and metrics help traders interpret financial statements:
4.1 Profitability Ratios
Gross Margin: Gross Profit ÷ Revenue × 100
Indicates how efficiently a company produces goods.
Net Margin: Net Income ÷ Revenue × 100
Shows overall profitability.
Return on Equity (ROE): Net Income ÷ Shareholders’ Equity
Measures how effectively shareholders’ money generates profit.
4.2 Liquidity Ratios
Current Ratio: Current Assets ÷ Current Liabilities
Shows short-term debt-paying ability.
Quick Ratio: (Current Assets − Inventory) ÷ Current Liabilities
More stringent liquidity check.
4.3 Debt Ratios
Debt-to-Equity (D/E): Total Debt ÷ Shareholders’ Equity
Measures financial leverage.
Interest Coverage Ratio: EBIT ÷ Interest Expense
Assesses ability to pay interest.
4.4 Efficiency Ratios
Inventory Turnover: COGS ÷ Average Inventory
Indicates how quickly inventory sells.
Receivables Turnover: Net Credit Sales ÷ Average Accounts Receivable
Shows efficiency in collecting payments.
5. Valuation Methods
After analyzing financial health, the next step is valuation, which estimates the stock’s intrinsic value.
5.1 Discounted Cash Flow (DCF)
DCF estimates the present value of future cash flows:
Project future cash flows.
Discount them using a required rate of return.
Sum the discounted cash flows to get intrinsic value.
Insight: If DCF value > market price → undervalued; if DCF < market price → overvalued.
5.2 Price-to-Earnings (P/E) Ratio
P/E ratio = Market Price ÷ Earnings per Share (EPS)
High P/E → Market expects growth, or stock is overvalued.
Low P/E → Potential undervaluation, or growth concerns.
5.3 Price-to-Book (P/B) Ratio
P/B ratio = Market Price ÷ Book Value per Share
Useful for asset-heavy industries.
Low P/B can indicate undervaluation.
5.4 Dividend Discount Model (DDM)
DDM values companies based on future dividends:
Estimate future dividends.
Discount them to present value.
Suitable for stable dividend-paying companies.
5.5 Other Ratios
EV/EBITDA: Enterprise Value ÷ Earnings Before Interest, Taxes, Depreciation, and Amortization.
PEG Ratio: P/E ÷ Earnings Growth Rate, adjusts for growth expectations.
6. Industry and Sector Analysis
Analyzing a company in isolation is not enough. Industry and sector trends can significantly affect performance.
Growth Industry: Fast-growing sectors like technology may justify high valuations.
Mature Industry: Slower growth sectors may offer stability and dividends.
Competitive Landscape: Number of competitors, entry barriers, and pricing power.
Cyclical vs Non-Cyclical: Cyclical industries (automobiles, real estate) follow the economy, while non-cyclical (food, healthcare) remain stable.
Example:
During an economic boom, cyclicals may outperform, whereas during recessions, defensive stocks are preferred.
7. Economic and Market Factors
Fundamental analysis also incorporates macroeconomic indicators:
7.1 GDP Growth
Strong GDP growth generally supports corporate profits and stock market performance.
7.2 Inflation
High inflation increases costs, potentially squeezing margins.
7.3 Interest Rates
Rising rates increase borrowing costs and reduce spending. Conversely, lower rates stimulate growth.
7.4 Currency Fluctuations
Important for exporters/importers, affecting revenue and costs.
7.5 Political and Regulatory Environment
Government policies, taxes, and regulations can significantly impact profitability and risk.
8. Qualitative Analysis
Numbers alone are not enough. Qualitative factors help complete the picture:
Management Quality: Leadership vision, integrity, and experience.
Brand Strength: Customer loyalty and reputation.
Innovation & R&D: Ability to stay ahead of competition.
Corporate Governance: Ethical practices, transparency, and accountability.
Example:
Two companies with similar financials may differ in future prospects based on leadership quality and innovation.
9. Steps to Apply Fundamental Analysis in Trading
Define your objective: Long-term investment vs short-term swing trading.
Select the company: Choose based on industry preference or market trends.
Collect financial data: Annual reports, quarterly statements, and filings.
Analyze financials: Use ratios, margins, and cash flow statements.
Perform valuation: Apply DCF, P/E, P/B, or other methods.
Assess macro factors: Consider economic, political, and market conditions.
Check qualitative factors: Leadership, brand, innovation, and governance.
Compare with peers: Relative valuation within the industry.
Make a decision: Buy, hold, or avoid based on intrinsic value vs market price.
10. Advantages of Fundamental Analysis
Provides a deep understanding of a company’s true value.
Helps in identifying long-term investment opportunities.
Reduces reliance on market sentiment and short-term volatility.
Useful for risk management by identifying financially weak companies.
Can identify undervalued stocks with potential for growth.
Conclusion
Fundamental analysis is a cornerstone of intelligent investing. By combining financial metrics, qualitative evaluation, and macroeconomic understanding, traders can make informed decisions that go beyond market noise. While it requires patience and diligence, FA provides a roadmap for sustainable investment and risk management.
When applied carefully, it helps traders identify undervalued stocks, avoid risky bets, and build a portfolio with long-term growth potential. Remember, in trading, knowledge is power, and fundamental analysis gives you the power to see beyond the price chart.
X-indicator
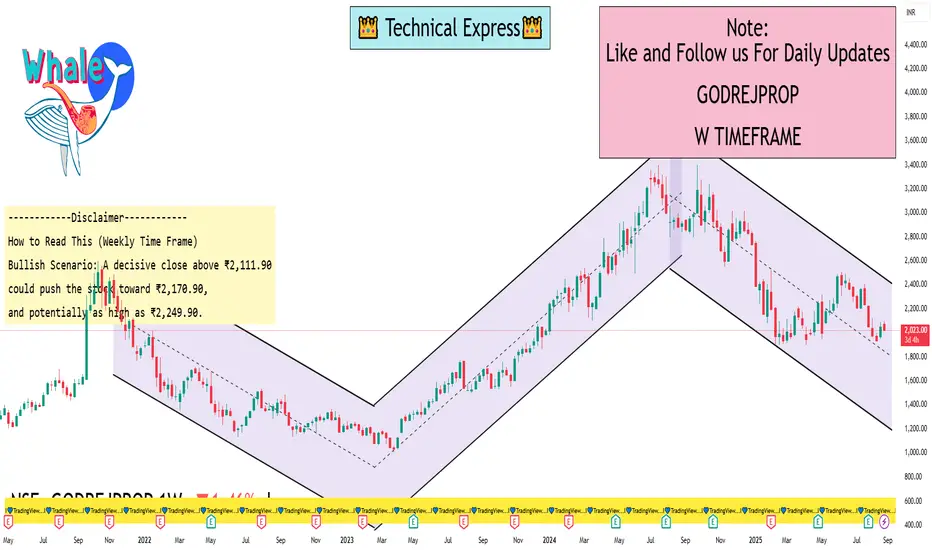
Godrej Properties Ltd 1 Week ViewWeekly Support & Resistance Levels
From EquityPandit (for the week August 25–29, 2025):
Immediate Resistance (R1): ₹ 2,111.90
Main Resistance (R2): ₹ 2,170.90
Max Resistance (R3): ₹ 2,249.90
Immediate Support (S1): ₹ 1,973.90
Major Support (S2): ₹ 1,894.90
Deep Support (S3): ₹ 1,835.90
Weekly Pivot Points (TopStockResearch):
Pivot Level: ₹ 2,032.90 (midpoint)
Weekly S1: ₹ 1,973.90
Weekly S2: ₹ 1,894.90
Weekly R1: ₹ 2,111.90
Weekly R2: ₹ 2,170.90
How to Read This (Weekly Time Frame)
Bullish Scenario: A decisive close above ₹2,111.90 could push the stock toward ₹2,170.90, and potentially as high as ₹2,249.90.
Bearish Scenario: A breakdown below ₹1,973.90 puts ₹1,894.90 and further down ₹1,835.90 into sharper focus.
Range-Bound: As long as the stock trades between roughly ₹1,974–₹2,112, it may remain in a consolidation phase.
Risk Management in Trading1. Introduction: Why Risk Management Matters
Trading in the stock market, forex, commodities, or crypto can be exciting. The charts move, opportunities appear every second, and profits can be made quickly. But at the same time, losses can also come just as fast. Many traders, especially beginners, enter the market thinking only about profits. They study chart patterns, indicators, or even copy trades from others. But what most ignore at the beginning is the one factor that separates successful traders from unsuccessful ones: Risk Management.
Risk management is not about how much profit you make; it’s about how well you protect your money when things go wrong. Trading is not about being right every time. Even the best traders in the world lose trades. What makes them profitable is that their losses are controlled and their winners are allowed to grow.
Without risk management, even the best strategy will eventually blow up your account. With risk management, even an average strategy can keep you in the game long enough to learn, improve, and grow your capital.
2. What is Risk Management in Trading?
Risk management in trading simply means the process of identifying, controlling, and minimizing the amount of money you could lose on each trade.
It’s not about avoiding risk completely (that’s impossible in trading). Instead, it’s about managing risk in such a way that:
No single trade can wipe out your account.
You survive long enough to take advantage of future opportunities.
You build consistency over time instead of gambling.
Think of trading like driving a car. Speed (profits) is fun, but brakes (risk management) keep you alive.
3. The Golden Rule of Trading: Protect Your Capital
The first rule of trading is simple: Don’t lose all your money.
If you lose 100% of your capital, you are out of the game forever.
Here’s the reality of losses:
If you lose 10% of your account, you need 11% profit to recover.
If you lose 50%, you need 100% profit to recover.
If you lose 90%, you need 900% profit to recover.
This shows how dangerous big losses are. The more you lose, the harder it becomes to get back to break-even. That’s why smart traders focus less on “How much profit can I make?” and more on “How much loss can I tolerate?”
4. Key Elements of Risk Management
Let’s go step by step through the major pillars of risk management in trading:
a) Position Sizing
This is about deciding how much money to risk in a single trade. A common rule is:
Never risk more than 1–2% of your account on one trade.
Example:
If your account size is ₹1,00,000 and you risk 1% per trade → maximum loss allowed = ₹1,000.
This way, even if you lose 10 trades in a row (which happens sometimes), you’ll still have 90% of your capital left.
b) Stop Loss
A stop loss is a price level where you accept that your trade idea is wrong and you exit automatically.
Without a stop loss, emotions take over. Traders hold losing trades, hoping they’ll turn profitable, but often the losses grow bigger.
Always set a stop loss before entering a trade.
Respect it. Don’t move it further away.
Example:
If you buy a stock at ₹500, you might set a stop loss at ₹480. If price drops to ₹480, your loss is controlled, and you live to trade another day.
c) Risk-to-Reward Ratio
Before entering any trade, ask yourself: Is the reward worth the risk?
If your stop loss is ₹100 away, your target should be at least ₹200 away. That’s a 1:2 risk-to-reward ratio.
Why is this important?
Because even if you win only 40% of your trades, you can still be profitable with a good risk-to-reward system.
Example:
Risk ₹1,000 per trade, aiming for ₹2,000 reward.
Out of 10 trades:
4 winners = ₹8,000 profit
6 losers = ₹6,000 loss
Net profit = ₹2,000
This shows you don’t need to win every trade. You just need to control losses and let winners run.
d) Diversification
Don’t put all your money in one stock, sector, or asset. Spread your risk.
If one trade goes bad, others can balance it.
Avoid overexposure in correlated assets (like buying 3 IT stocks at once).
e) Avoiding Over-Leverage
Leverage allows you to control big positions with small money. But leverage is a double-edged sword: it multiplies both profits and losses.
Beginners often blow accounts using high leverage. Rule of thumb:
Use leverage cautiously.
Never take a position so big that one wrong move wipes out your account.
5. Psychological Side of Risk Management
Risk management is not only about numbers; it’s also about mindset and discipline.
Greed makes traders risk too much for quick profits.
Fear makes them close trades too early or avoid good opportunities.
Revenge trading happens after a loss, when traders try to win it back immediately by increasing position size. This often leads to bigger losses.
Good risk management keeps emotions under control. When you know that your maximum loss is limited, you trade with a calm mind.
6. Practical Risk Management Techniques
Here are some practical tools and methods traders use:
Fixed % Risk Model – Always risk a fixed percentage (like 1% per trade).
Fixed Amount Risk Model – Always risk a fixed rupee amount (like ₹500 per trade).
Trailing Stop Loss – Adjusting stop loss as price moves in your favor, to lock in profits.
Daily Loss Limit – Stop trading for the day if you lose a set amount (say 3% of account). This prevents emotional overtrading.
Portfolio Heat – Total risk across all open trades should not exceed 5–6% of account.
7. Common Mistakes Traders Make in Risk Management
Not using stop losses.
Risking too much in one trade.
Moving stop losses further away to “give trade more room.”
Trading with borrowed money.
Doubling position after a loss (“martingale” strategy).
Ignoring position sizing.
These mistakes often lead to blown accounts.
8. Case Studies
Case 1: Trader Without Risk Management
Rahul has ₹1,00,000. He risks ₹20,000 in one trade (20% of account). If he loses 5 trades in a row, his account goes to zero. Game over.
Case 2: Trader With Risk Management
Anita has ₹1,00,000. She risks only 1% per trade (₹1,000). Even if she loses 10 trades in a row, she still has ₹90,000 left to keep trading and learning.
Who will survive longer? Anita.
And survival is the key in trading.
9. Risk Management Beyond Single Trades
Risk management is not only about one trade, but also about your whole trading career:
Set Monthly Risk Limits → e.g., stop trading if you lose 10% in a month.
Keep Emergency Funds → Never put all life savings into trading.
Withdraw Profits → Don’t leave all profits in the trading account. Take some out regularly.
Review Trades → Keep a trading journal to learn from mistakes.
10. The Connection Between Risk Management & Consistency
Consistency is what separates professionals from gamblers. Professional traders don’t look for a “big jackpot trade.” Instead, they look for consistent growth.
Risk management provides that consistency by:
Preventing big drawdowns.
Allowing small steady growth.
Giving confidence in the system.
Trading is like running a business. Risk management is your insurance policy. No business survives without managing costs and risks.
Final Thoughts
Risk management may not sound exciting compared to finding “hot stocks” or “sure-shot trades.” But in reality, it’s the most important part of trading.
Think of it this way:
Strategies may come and go.
Indicators may change.
Markets may behave differently.
But risk management principles stay the same.
The traders who last years in the market are not the ones who find secret formulas. They are the ones who respect risk.
If you master risk management, you can survive long enough to improve, adapt, and eventually succeed. Without it, no matter how smart or lucky you are, the market will take your money.
Part 2 Trading Master Class With ExpertsOptions in Indian Markets
In India, options are traded on NSE and BSE, primarily on:
Index Options: Nifty, Bank Nifty (most liquid).
Stock Options: Reliance, TCS, Infosys, etc.
Weekly Expiry: Every Thursday (Nifty/Bank Nifty).
Lot Sizes: Fixed by exchanges (e.g., Nifty = 50 units).
Practical Example – Nifty Options Trade
Scenario:
Nifty at 20,000.
You expect big movement after RBI policy.
Strategy: Buy straddle (20,000 call + 20,000 put).
Cost = ₹200 (call) + ₹180 (put) = ₹380 × 50 = ₹19,000.
If Nifty moves to 20,800 → Call worth ₹800, Put worthless. Profit = ₹21,000.
If Nifty stays at 20,000 → Both expire worthless. Loss = ₹19,000.

PCR Trading StrategyKey Terms in Options Trading
Before diving into strategies, let’s master some core concepts:
Underlying Asset: The stock/index/commodity on which the option is based.
Strike Price: The price at which the option can be exercised.
Expiration Date: The date on which the option contract ends.
Premium: The price paid by the option buyer to the seller (writer) for the contract.
In-the-Money (ITM): Option has intrinsic value (profitable if exercised).
At-the-Money (ATM): Underlying price = Strike price.
Out-of-the-Money (OTM): Option has no intrinsic value yet (not profitable to exercise).
Lot Size: Options are traded in lots (e.g., Nifty option has a fixed lot of 50 units).
Leverage: Options allow control of large positions with smaller capital.
How Options Work
Options are like insurance. Imagine you own a house worth ₹50 lakh and buy insurance. You pay a small premium so that if the house burns down, you can recover your value. Similarly:
A call option is like paying for the right to buy a stock cheaper later.
A put option is like insurance against stock prices falling.

Futures Trading ExplainedIntroduction
Futures trading is one of the most powerful financial instruments in the world of investing and trading. Unlike traditional stock buying where you own a piece of a company, futures are derivative contracts that allow you to speculate on the price movement of commodities, currencies, indices, and financial assets without owning them directly.
The futures market plays a crucial role in global finance by providing price discovery, risk management (hedging), and speculative opportunities. From farmers locking in prices for crops to institutional traders speculating on crude oil, futures are everywhere in the financial ecosystem.
In this guide, we’ll explore futures trading in detail, covering everything from the basics to advanced strategies, with real-world examples.
1. What are Futures?
A futures contract is a legally binding agreement to buy or sell an underlying asset at a predetermined price at a specific time in the future.
Key points:
Underlying asset: The thing being traded (wheat, crude oil, gold, stock index, currency, etc.).
Standardized contract: The size, quality, and delivery date are pre-defined by the exchange.
Leverage: Traders can control large positions with small capital (margin).
Cash-settled or physical delivery: Some futures end with cash settlement, others with delivery of the actual asset.
For example:
A wheat farmer agrees to sell 1000 bushels of wheat at $7 per bushel for delivery in 3 months. The buyer agrees to purchase it. Regardless of where the price goes, both are bound to the contract terms.
2. History and Evolution of Futures
Futures are not new – they date back centuries.
Japan (1700s): The Dojima Rice Exchange in Osaka is considered the birthplace of futures. Rice merchants used contracts to stabilize income.
Chicago Board of Trade (1848): Modern futures trading started in the U.S. with grain contracts.
20th Century: Expansion into metals, livestock, and energy.
Late 20th to 21st Century: Financial futures (currencies, indices, interest rates) became dominant.
Today, futures are traded worldwide on major exchanges like CME (Chicago Mercantile Exchange), ICE (Intercontinental Exchange), and NSE (National Stock Exchange of India).
3. Futures vs. Other Instruments
To understand futures better, let’s compare them with other markets:
Futures vs. Stocks
Stocks = Ownership of a company.
Futures = Contract to trade an asset, no ownership.
Stocks are unleveraged by default; futures use leverage.
Futures vs. Options
Options = Right but not obligation.
Futures = Obligation for both buyer and seller.
Options limit risk (premium paid); futures have unlimited risk.
Futures vs. Forwards
Forwards = Customized, private contracts (OTC).
Futures = Standardized, exchange-traded, regulated.
4. How Futures Trading Works
Let’s break down the mechanics:
a) Contract Specifications
Every futures contract specifies:
Underlying asset (Gold, Nifty index, Crude oil, etc.)
Contract size (e.g., 100 barrels of oil)
Expiration date (e.g., March 2025 contract)
Tick size (minimum price movement)
Settlement type (cash/physical)
b) Margin and Leverage
Traders don’t pay full value; they post margin (a percentage, usually 5–15%).
Example: 1 crude oil futures contract = 100 barrels. If price = $80, contract value = $8,000. Margin required may be $800. You control $8,000 with just $800.
c) Mark-to-Market (MTM)
Futures are settled daily. Profits and losses are adjusted every day.
If your trade is in profit, money is credited; if in loss, debited.
d) Long and Short Positions
Long = Buy (expecting price rise).
Short = Sell (expecting price fall).
Unlike stocks, short selling in futures is easy because contracts don’t require ownership of the asset.
5. Participants in Futures Market
The market brings together different players:
Hedgers – Reduce risk.
Example: A farmer sells wheat futures to lock in price; an airline buys crude oil futures to hedge fuel cost.
Speculators – Profit from price movements.
Traders, investors, hedge funds.
They provide liquidity but assume higher risk.
Arbitrageurs – Exploit price differences.
Example: Buy in spot market and sell futures if mispricing exists.
6. Types of Futures Contracts
Futures are available across asset classes:
a) Commodity Futures
Agricultural: Wheat, corn, soybeans, coffee.
Energy: Crude oil, natural gas.
Metals: Gold, silver, copper.
b) Financial Futures
Index futures (Nifty, S&P 500).
Currency futures (USD/INR, EUR/USD).
Interest rate futures (10-year bond yields).
c) Other Emerging Futures
Volatility index futures (VIX).
Crypto futures (Bitcoin, Ethereum).
7. Futures Trading Strategies
Futures are flexible and allow many trading approaches:
a) Directional Trading
Going long if expecting price rise.
Going short if expecting price fall.
b) Hedging
Farmers hedge crop prices.
Exporters/importers hedge currency fluctuations.
Investors hedge stock portfolios with index futures.
c) Spread Trading
Buy one contract, sell another.
Example: Buy December crude oil futures, sell March crude oil futures (calendar spread).
d) Arbitrage
Exploiting mispricing between spot and futures.
Example: If Gold futures are overpriced compared to spot, arbitrageurs sell futures and buy spot.
e) Advanced Strategies
Pairs trading: Trade correlated futures.
Hedged positions: Combining futures with options.
8. Advantages of Futures Trading
High Leverage: Amplifies potential returns.
Liquidity: Major futures markets have deep liquidity.
Transparency: Regulated by exchanges.
Flexibility: Can trade both rising and falling markets.
Hedging tool: Reduces risk exposure.
9. Risks in Futures Trading
While powerful, futures are risky:
Leverage risk: Losses are amplified just like profits.
Volatility risk: Futures can swing widely.
Margin calls: If losses exceed margin, traders must add funds.
Liquidity risk: Some contracts may have low volume.
Unlimited losses: Unlike options, risk is not capped.
Example: If you short crude oil at $80 and it rises to $120, your losses are massive.
10. Practical Example of Futures Trade
Imagine you believe gold prices will rise.
Gold futures contract size: 100 grams.
Current price: ₹60,000 per 10 grams → Contract value = ₹600,000.
Margin requirement: 10% = ₹60,000.
You buy one contract at ₹60,000.
If gold rises to ₹61,000 → Profit = ₹1,000 × 10 = ₹10,000.
If gold falls to ₹59,000 → Loss = ₹10,000.
A small move in price leads to large gains or losses due to leverage.
Conclusion
Futures trading is a double-edged sword – a tool of immense power for hedging and speculation, but equally capable of wiping out capital if misused. Traders must understand contract mechanics, manage leverage wisely, and apply strict risk management.
For professionals and disciplined traders, futures offer unparalleled opportunities. For careless traders, they can be disastrous.
The bottom line:
Learn the basics thoroughly.
Start small with proper risk controls.
Treat futures trading as a skill to master, not a gamble.
If used smartly, futures trading can become a gateway to financial growth and protection against market uncertainty.
Trading Master Class With ExpertsTips for Beginners in Options Trading
Start with buying calls/puts before selling.
Trade liquid instruments like Nifty/Bank Nifty.
Learn Greeks slowly, don’t jump into complex strategies.
Avoid naked option selling without hedging.
Paper trade before risking real capital.
Role of Volatility in Options
Volatility is the lifeblood of options.
High Volatility = Expensive Premiums.
Low Volatility = Cheap Premiums.
Traders often use Implied Volatility (IV) to decide whether to buy (when IV is low) or sell (when IV is high).
Mastering Options
Options are like a Swiss Army Knife of trading—one tool with multiple uses: speculation, hedging, and income generation. But with great power comes great responsibility.
To succeed in options trading:
Understand the basics thoroughly.
Start small and simple.
Master risk management.
Use strategies suited to your market outlook.
Keep emotions under control.
With practice and discipline, options can become a game-changer in your trading journey.

Part 6 Learn Institutional TradingOptions in Indian Markets
In India, options are traded on NSE and BSE, primarily on:
Index Options: Nifty, Bank Nifty (most liquid).
Stock Options: Reliance, TCS, Infosys, etc.
Weekly Expiry: Every Thursday (Nifty/Bank Nifty).
Lot Sizes: Fixed by exchanges (e.g., Nifty = 50 units).
Practical Example – Nifty Options Trade
Scenario:
Nifty at 20,000.
You expect big movement after RBI policy.
Strategy: Buy straddle (20,000 call + 20,000 put).
Cost = ₹200 (call) + ₹180 (put) = ₹380 × 50 = ₹19,000.
If Nifty moves to 20,800 → Call worth ₹800, Put worthless. Profit = ₹21,000.
If Nifty stays at 20,000 → Both expire worthless. Loss = ₹19,000.
Option Trading Psychology
Patience: Many options expire worthless, don’t chase every trade.
Discipline: Stick to stop-loss and position sizing.
Avoid Greed: Sellers earn small consistent income but risk blow-up if careless.
Stay Informed: News, earnings, and events impact volatility.

Part 4 Learn Institutional TradingIntermediate Option Strategies
Straddle – Buy Call + Buy Put (same strike/expiry). Best for high volatility.
Strangle – Buy OTM Call + Buy OTM Put. Cheaper than straddle.
Bull Call Spread – Buy lower strike call + Sell higher strike call.
Bear Put Spread – Buy higher strike put + Sell lower strike put.
Advanced Option Strategies
Iron Condor – Sell OTM call + OTM put, hedge with farther strikes. Good for sideways market.
Butterfly Spread – Combination of multiple calls/puts to profit from low volatility.
Calendar Spread – Buy long-term option, sell short-term option (same strike).
Ratio Spread – Sell multiple options against fewer long options.
Hedging with Options
Options aren’t just for speculation; they’re powerful hedging tools.
Portfolio Hedge: If you own a basket of stocks, buying index puts protects against a market crash.
Currency Hedge: Importers/exporters use currency options to lock exchange rates.
Commodity Hedge: Farmers hedge crops using options to lock minimum prices.

Part 3 Learn Institutional TradingOption Greeks – The Science Behind Pricing
Options pricing is influenced by multiple factors. These sensitivities are known as the Greeks:
Delta – Measures how much option price changes with stock price.
Gamma – Rate of change of Delta.
Theta – Time decay (options lose value daily).
Vega – Sensitivity to volatility.
Rho – Sensitivity to interest rates.
Example: A call option with Delta = 0.6 means for every ₹10 rise in stock, option premium increases by ₹6.
Basic Option Strategies (Beginner Level)
Buying Calls – Bullish bet.
Buying Puts – Bearish bet.
Covered Call – Hold stock + sell call for extra income.
Protective Put – Own stock + buy put for downside insurance.

Indicators & Oscillators in Trading1. Introduction
In the world of financial markets, traders are constantly searching for ways to gain an edge. While fundamental analysis looks at company earnings, news, and economic trends, technical analysis focuses on price action, patterns, and market psychology.
At the core of technical analysis lie Indicators and Oscillators. These are mathematical calculations based on price, volume, or both, designed to give traders insights into the direction, momentum, strength, or volatility of a market.
In simple words, Indicators help you see the invisible — they take raw price data and transform it into something more structured, often plotted on a chart to highlight opportunities. Oscillators, on the other hand, are a special category of indicators that move within a fixed range (like 0 to 100), helping traders identify overbought and oversold conditions.
Understanding them is crucial because they:
Improve trade timing.
Help confirm signals.
Prevent emotional decision-making.
Allow traders to recognize trends earlier.
2. What Are Indicators?
Indicators are mathematical formulas applied to a stock, forex pair, commodity, or index to make market data easier to interpret.
For example, a simple indicator is the Moving Average. It takes the average of closing prices over a set number of days and smooths out fluctuations. This makes it easier to see the underlying trend.
Indicators can be broadly categorized into two groups:
Leading Indicators – Predict future price movements.
Example: Relative Strength Index (RSI), Stochastic Oscillator.
These give signals before the trend actually changes.
Lagging Indicators – Confirm existing price movements.
Example: Moving Averages, MACD.
They follow price action and confirm that a trend has started or ended.
3. What Are Oscillators?
Oscillators are a subcategory of indicators that fluctuate within a defined range. For example, the RSI ranges from 0 to 100, while the Stochastic Oscillator ranges from 0 to 100 as well.
Traders use oscillators to identify:
Overbought conditions (when prices may be too high and due for correction).
Oversold conditions (when prices may be too low and due for a bounce).
The key difference between indicators and oscillators is that while all oscillators are indicators, not all indicators are oscillators. Oscillators usually appear in a separate window below the price chart.
4. Types of Indicators
Indicators can be classified based on their purpose:
A. Trend Indicators
These show the direction of the market.
Moving Averages (SMA, EMA, WMA)
MACD (Moving Average Convergence Divergence)
ADX (Average Directional Index)
B. Momentum Indicators
These measure the speed of price movements.
RSI (Relative Strength Index)
Stochastic Oscillator
CCI (Commodity Channel Index)
C. Volatility Indicators
These show how much prices are fluctuating.
Bollinger Bands
ATR (Average True Range)
Keltner Channels
D. Volume Indicators
These use traded volume to confirm price moves.
OBV (On-Balance Volume)
VWAP (Volume Weighted Average Price)
Chaikin Money Flow
5. Popular Indicators Explained
Let’s break down some of the most commonly used indicators:
5.1 Moving Averages
Simple Moving Average (SMA): Average of closing prices over a period.
Exponential Moving Average (EMA): Gives more weight to recent data, reacts faster.
Use: Identify trend direction, support, and resistance.
Example: If the 50-day EMA crosses above the 200-day EMA (Golden Cross), it’s a bullish signal.
5.2 MACD (Moving Average Convergence Divergence)
Consists of two EMAs (usually 12-day and 26-day).
A signal line (9-day EMA of MACD) generates buy/sell signals.
Use: Trend-following, momentum strength.
Example: When MACD crosses above signal line → Buy signal.
5.3 RSI (Relative Strength Index)
Range: 0 to 100.
Above 70 = Overbought.
Below 30 = Oversold.
Use: Identify reversals, divergence signals.
Example: RSI above 80 in a strong uptrend may still rise, so context matters.
5.4 Stochastic Oscillator
Compares a closing price to a range of prices over a period.
Range: 0 to 100.
Signals:
Above 80 = Overbought.
Below 20 = Oversold.
Special feature: Generates crossovers between %K and %D lines.
5.5 Bollinger Bands
Consist of a moving average and two standard deviation bands.
Bands expand during volatility, contract during consolidation.
Use:
Price near upper band = Overbought.
Price near lower band = Oversold.
5.6 Average True Range (ATR)
Measures volatility, not direction.
Higher ATR = High volatility.
Lower ATR = Low volatility.
Use: Set stop-loss levels, position sizing.
5.7 OBV (On-Balance Volume)
Combines price movement with volume.
Rising OBV = buyers in control.
Falling OBV = sellers in control.
6. Combining Indicators
No single indicator is perfect. Traders often combine two or more indicators to filter false signals.
Example Strategies:
RSI + Moving Average: Identify oversold conditions only if price is above the moving average (trend filter).
MACD + Bollinger Bands: Use MACD crossover as entry, Bollinger Band touch as exit.
Volume + Trend Indicator: Confirm trend direction with volume support.
7. Advantages of Using Indicators & Oscillators
Clarity – Simplifies raw data into easy-to-read signals.
Discipline – Reduces emotional trading.
Confirmation – Supports price action with mathematical evidence.
Adaptability – Works across stocks, forex, commodities, crypto.
8. Limitations
Lagging nature: Most indicators follow price, not predict it.
False signals: Especially in sideways markets.
Over-reliance: Blind faith in indicators leads to losses.
Conflicting results: Different indicators may show opposite signals.
9. Best Practices for Traders
Keep it simple: Use 2–3 reliable indicators instead of clutter.
Understand context: RSI at 80 in a strong bull run may not mean “sell.”
Combine with price action: Indicators are tools, not replacements for reading charts.
Backtest strategies: Always test on historical data before applying in live trades.
Adapt timeframe: What works in daily charts may not work in 5-minute charts.
10. Real-World Example
Suppose a trader is analyzing Nifty 50 index:
50-day EMA is above 200-day EMA → Trend is bullish.
RSI is at 65 → Market is not yet overbought.
OBV is rising → Strong buying volume.
Bollinger Bands are expanding → High volatility.
Conclusion: Strong bullish momentum. Trader may enter long with stop-loss below 200-day EMA.
Conclusion
Indicators & Oscillators are like navigation tools for traders. They don’t guarantee profits but improve decision-making, discipline, and timing. The real skill lies in knowing when to trust them, when to ignore them, and how to combine them with price action and market context.
To master them:
Learn their math and logic.
Practice on historical charts.
Combine with market structure analysis.
Keep evolving as markets change.
A professional trader treats indicators not as magical prediction machines, but as assistants in understanding market psychology.
Global Events & Market ImpactIntroduction
Financial markets are like living organisms—sensitive, reactive, and constantly adapting to external influences. While company fundamentals, earnings, and investor psychology play a large role in stock price movements, global events often serve as the real catalysts for dramatic market swings.
A political decision in Washington, a sudden military conflict in the Middle East, a central bank announcement in Europe, or even a natural disaster in Asia can ripple across global financial markets within minutes. In today’s hyper-connected economy, where capital flows across borders instantly and news spreads in real time, no country or investor is fully insulated from worldwide developments.
This article explores in detail how different global events—ranging from geopolitical tensions, pandemics, and trade wars to central bank policies, technological revolutions, and climate change—affect financial markets. We’ll also study both short-term volatility and long-term structural shifts that such events trigger.
1. The Nature of Market Sensitivity to Global Events
Markets are essentially forward-looking. They do not simply react to present conditions but rather try to price in future risks and opportunities. This is why even rumors of a war, speculation about interest rate changes, or forecasts of a hurricane can cause markets to swing before the actual event occurs.
Three key characteristics define market responses to global events:
Speed – In the era of high-frequency trading and global media, reactions can happen within seconds.
Magnitude – The scale of reaction depends on how “systemic” the event is (for example, the 2008 financial crisis vs. a localized earthquake).
Duration – Some events cause short-term panic but markets recover quickly; others reshape the global economy for decades.
2. Categories of Global Events Affecting Markets
Global events can be broadly classified into several categories, each with distinct market impacts:
Geopolitical Events – wars, terrorism, political instability, sanctions, and diplomatic conflicts.
Economic Policies & Central Bank Decisions – interest rate changes, fiscal stimulus, tax reforms.
Global Trade & Supply Chain Disruptions – tariffs, trade wars, port blockages, shipping crises.
Natural Disasters & Climate Change – hurricanes, floods, wildfires, long-term climate risks.
Health Crises & Pandemics – global spread of diseases like COVID-19, SARS, Ebola.
Technological Disruptions – breakthroughs in AI, energy, and digital finance.
Commodity Shocks – sudden movements in oil, gold, or food prices.
Financial Crises & Systemic Shocks – banking collapses, currency devaluations, debt crises.
Let’s examine each in detail.
3. Geopolitical Events
Wars and Conflicts
Wars often cause energy and commodity prices to spike, especially when they involve major producers.
Example: The Russia-Ukraine war (2022) sent oil, gas, and wheat prices soaring, creating inflationary pressures worldwide.
Defense stocks usually rally, while riskier assets like emerging markets decline.
Political Instability
Elections, regime changes, and coups often create uncertainty.
Example: Brexit (2016) caused volatility in the pound sterling, reshaped European equity flows, and influenced global trade policy.
Terrorism
Major attacks (e.g., 9/11) often trigger immediate sell-offs in equity markets, with a flight to safe-haven assets like gold and US Treasury bonds.
4. Economic Policies & Central Banks
Interest Rate Decisions
Central banks like the US Federal Reserve, European Central Bank (ECB), and RBI (India) are powerful drivers of markets.
When rates rise, borrowing becomes expensive, which usually depresses stock markets but strengthens the currency.
Conversely, rate cuts often boost equities but weaken currencies.
Quantitative Easing (QE)
During crises (2008, COVID-19), central banks injected liquidity into markets, which drove asset prices upward.
Fiscal Stimulus & Taxation
Government spending plans, subsidies, or corporate tax cuts influence corporate earnings expectations and therefore stock valuations.
5. Global Trade & Supply Chains
Trade Wars
Example: The US-China trade war (2018–2019) disrupted global technology and manufacturing supply chains, causing volatility in stock markets and commodity markets.
Supply Chain Disruptions
COVID lockdowns in China created shortages in semiconductors and other goods, which impacted global auto and electronics industries.
Shipping & Logistics
Events like the Suez Canal blockage (2021) caused billions in losses and exposed how dependent markets are on smooth global logistics.
6. Natural Disasters & Climate Change
Natural Disasters
Hurricanes, tsunamis, or earthquakes often create localized stock market declines.
Example: The 2011 Japan earthquake & Fukushima nuclear disaster had global impacts on energy and auto supply chains.
Climate Change
Increasingly, investors are pricing climate risk into valuations.
Companies in fossil fuel industries face long-term risks, while renewable energy firms attract capital.
ESG (Environmental, Social, Governance) investing has emerged as a global trend.
7. Health Crises & Pandemics
COVID-19 (2020–2022)
One of the most impactful global events in modern history.
Stock markets initially crashed in March 2020 but rebounded sharply due to massive fiscal and monetary support.
Certain sectors like airlines, hotels, and oil were devastated, while tech and healthcare boomed.
Past Examples
SARS (2003) hit Asian markets temporarily.
Ebola (2014) affected African economies but had limited global effect compared to COVID.
8. Technological Disruptions
Innovations Driving Markets
The dot-com bubble (1999–2000) showed how technology hype can inflate markets.
More recently, AI and EV (Electric Vehicles) have created massive rallies in companies like Nvidia and Tesla.
Risks from Technology
Cyberattacks on financial institutions or major corporations can cause sudden market dips.
Example: Ransomware attacks or hacking of exchanges.
9. Commodity Shocks
Oil Price Volatility
Oil remains one of the most geopolitically sensitive commodities.
Example: The 1973 oil crisis caused stagflation globally.
In 2020, oil futures briefly turned negative due to demand collapse.
Gold as a Safe Haven
During uncertainty, gold prices usually rise.
Investors view it as a hedge against inflation, currency depreciation, and geopolitical risks.
Food Commodities
Droughts or export bans (e.g., India restricting rice exports) can push global food inflation higher.
10. Financial Crises & Systemic Shocks
Global Financial Crisis (2008)
Triggered by the collapse of Lehman Brothers, this event led to the worst global recession since the Great Depression.
Stock markets fell over 50%, but also created long-term changes in regulation and central bank behavior.
Asian Financial Crisis (1997)
Currency devaluations in Thailand, Indonesia, and South Korea triggered capital flight and market crashes.
European Debt Crisis (2010–2012)
Greece’s sovereign debt problems shook confidence in the Eurozone and created long-term structural reforms.
Conclusion
Global events are unavoidable in financial markets. While some are unpredictable “black swan” shocks, others evolve slowly, giving investors time to adjust. Understanding how markets react to wars, pandemics, central bank decisions, and technological disruptions can help investors navigate uncertainty more effectively.
In the short term, markets may appear chaotic. But history shows that crises often accelerate long-term transformations in economies and industries. The winners are those who maintain discipline, manage risk, and adapt strategies as global dynamics shift.

PCR Trading StrategyHow Options Work
Let’s break it down simply:
If you buy a call, you are betting that the price of the stock will go up.
If you buy a put, you are betting that the price of the stock will go down.
If you sell (write) a call, you are taking the opposite bet—that the stock won’t rise much.
If you sell (write) a put, you are betting that the stock won’t fall much.
Here’s a quick example:
Stock XYZ trades at ₹100.
You buy a 1-month call option with a strike price of ₹105 by paying a ₹5 premium.
If the stock rises to ₹120, your option is worth ₹15 (120 – 105). Since you paid ₹5, your profit = ₹10.
If the stock stays below ₹105, the option expires worthless, and you lose your premium of ₹5.
This example shows that options can magnify profits if you’re right, but they can also cause losses (limited to the premium paid for buyers, unlimited for sellers).
Types of Options
A. Call Options
Right to buy.
Used when you expect prices to rise.
Buyers have limited risk (premium) but unlimited upside.
Sellers (writers) have limited gain (premium received) but unlimited risk.
B. Put Options
Right to sell.
Used when you expect prices to fall.
Buyers have limited risk but big upside if stock falls sharply.
Sellers have limited gain (premium) but large risk if stock collapses.

Part 1 Support and Resistance1. Introduction to Options
In the world of financial markets, traders and investors use various tools to manage risk, speculate on price movements, or generate additional income. One of the most powerful and flexible tools is options trading.
An option is a financial derivative, which means its value is derived from another underlying asset. This underlying asset could be a stock, an index, a commodity, or even a currency. Unlike stocks, where you own a piece of the company, an option is a contract that gives you certain rights related to buying or selling the underlying asset at a specific price and within a specified time.
Options are incredibly versatile. Traders use them for hedging (protection against loss), speculation (betting on future price moves), or income generation (selling options for premiums). But with great flexibility comes complexity, and that’s why understanding option trading deeply is essential before jumping in.
2. Basic Terminology in Option Trading
Before diving deep, let’s clear some essential terms:
Call Option: A contract giving the right (not obligation) to buy an asset at a predetermined price (strike price) before expiration.
Put Option: A contract giving the right (not obligation) to sell an asset at a predetermined price before expiration.
Strike Price: The fixed price at which the option holder can buy (for calls) or sell (for puts) the underlying.
Premium: The cost of purchasing an option contract. This is the price paid upfront by the buyer to the seller (writer).
Expiration Date: The date when the option contract expires. After this, the option becomes worthless if not exercised.
In the Money (ITM): An option that has intrinsic value. For calls, when the stock price > strike price. For puts, when stock price < strike price.
Out of the Money (OTM): An option with no intrinsic value (only time value). For calls, stock price < strike price. For puts, stock price > strike price.
At the Money (ATM): When the stock price and strike price are roughly equal.
Option Writer: The seller of the option contract. They receive the premium but take on obligation.
Lot Size: Options are traded in fixed quantities called lots (e.g., 50 or 100 shares per contract depending on the market).
Understanding these terms is like learning the alphabet before writing sentences—you need them to progress.

Part 3 Institutional Trading Why Traders Use Options
Options are powerful because they can serve three main purposes:
Hedging – Protecting an existing portfolio from adverse price moves.
Example: A long-term investor holding Infosys shares may buy a Put option to protect against a fall.
Speculation – Betting on market direction with limited capital.
Example: Buying a Call if you expect bullish momentum.
Income Generation – Selling options to collect premium regularly.
Example: Writing Covered Calls on stocks you own.
The same instrument (options) can be used very differently by traders with different goals. That’s why strategies matter.
Types of Option Strategies
Here’s the heart of the discussion: strategies.
Single-Leg Strategies (Simple & Beginner-Friendly)
a) Long Call (Buying a Call)
View: Bullish
Risk: Limited to premium paid
Reward: Unlimited (theoretically)
Example: Buy Reliance 2800 CE @ ₹50 → If Reliance goes to 2900, profit = ₹50.
b) Long Put (Buying a Put)
View: Bearish
Risk: Limited to premium paid
Reward: Large downside profit potential
Example: Buy Nifty 22,000 PE → If Nifty falls, profit rises.
c) Covered Call
View: Neutral to mildly bullish
How it works: Hold stock + Sell a Call option
Goal: Earn income from option premium
Risk: Stock falls significantly.
d) Cash-Secured Put
View: Neutral to bullish
How it works: Sell a Put with enough cash to buy stock if assigned.
Goal: Collect premium or buy stock cheaper.

Part 1 Trading Master Class Types of Option Strategies
Options allow traders to design strategies based on market view—bullish, bearish, or neutral. Some popular strategies:
A. Bullish Strategies
Long Call – Buy a call option to profit from price rise.
Bull Call Spread – Buy lower strike call, sell higher strike call to reduce cost.
Synthetic Long – Buy call + sell put = behaves like futures long.
B. Bearish Strategies
Long Put – Buy a put option to profit from fall.
Bear Put Spread – Buy higher strike put, sell lower strike put.
Synthetic Short – Sell call + buy put = behaves like futures short.
C. Neutral/Sideways Strategies
Straddle – Buy call and put at same strike (profit from volatility).
Strangle – Buy call and put at different strikes (cheaper than straddle).
Iron Condor – Sell OTM call & put, buy further OTM call & put (profit from low volatility).
D. Income/Theta Strategies
Covered Call – Hold stock + sell call option for extra income.
Cash-Secured Put – Sell put option while keeping cash aside to buy stock if assigned.

Part 2 Support And ResistanceWhy Options Exist?
Options exist to manage risk and to create trading opportunities. Think of them as financial insurance. Just like you pay a premium for car insurance to protect against damage, in options trading, investors pay a premium to protect themselves against adverse price moves.
For Hedgers: Options act as insurance. A stock investor can buy a put option to protect his portfolio if the market falls.
For Speculators: Options provide leverage. With small capital, traders can take large directional bets.
For Arbitrageurs: Options open opportunities to exploit price inefficiencies between the spot, futures, and options markets.
Key Terminologies in Option Trading
Before diving deep, let’s understand some essential terms:
Call Option: A contract that gives the buyer the right (but not the obligation) to buy an asset at the strike price before expiry.
Example: Buying a Reliance ₹2500 Call Option means you can buy Reliance shares at ₹2500 even if the market price rises to ₹2700.
Put Option: A contract that gives the buyer the right (but not the obligation) to sell an asset at the strike price before expiry.
Example: Buying a Nifty 19000 Put Option means you can sell Nifty at 19000 even if the market falls to 18500.
Premium: The price paid to buy the option contract.
Example: If a Nifty 20000 Call is trading at ₹150, that ₹150 is the premium.
Strike Price: The pre-decided price at which the option can be exercised.
Expiry Date: The last date on which the option contract is valid.
In-the-Money (ITM): Option that already has intrinsic value.
Example: Nifty at 20000 → 19500 Call is ITM.
Out-of-the-Money (OTM): Option that has no intrinsic value (only time value).
Example: Nifty at 20000 → 21000 Call is OTM.
At-the-Money (ATM): Option strike price is closest to current market price.
Lot Size: Options are traded in predefined lot sizes, not single shares.
Example: Bank Nifty option lot size = 15 units (as per 2025 rules).
Option Chain: A tabular representation showing available strikes, premiums, open interest, etc. for calls and puts.

Risk Management in TradingIntroduction
Trading is often seen as the art of predicting market moves, buying low, and selling high. Yet, the most successful traders will tell you that trading is not about prediction, it’s about protection. The markets are uncertain, and no strategy, indicator, or system can guarantee 100% accuracy. What separates consistently profitable traders from losing ones is not just their ability to analyze charts but their skill in managing risk.
Risk management is the backbone of long-term survival in trading. Without it, even the best strategies eventually fail. With it, even an average strategy can deliver consistent returns over time. In this guide, we’ll dive deep into what risk management is, why it matters, and the tools and techniques every trader must master.
Chapter 1: What is Risk in Trading?
Risk in trading refers to the possibility of losing money due to adverse market movements. Every trade carries uncertainty, and risk management is about controlling the size and impact of that uncertainty.
There are different types of risk in trading:
Market Risk (Price Risk):
The chance of prices moving against your trade. For example, buying a stock at ₹100 and it falls to ₹90.
Leverage Risk:
Using borrowed money or margin amplifies both gains and losses. A small price move can wipe out capital if leverage is excessive.
Liquidity Risk:
The inability to exit a position at the desired price due to low trading volume. This happens often in small-cap stocks or thinly traded futures.
Volatility Risk:
Sudden price swings can trigger stop losses or create unexpected losses, especially around news events.
Psychological Risk:
Emotional decisions – fear, greed, revenge trading – often increase losses.
Systemic Risk:
External shocks like economic crises, geopolitical tensions, or pandemics can affect all markets simultaneously.
In simple terms: Risk = Probability of Loss × Magnitude of Loss.
Chapter 2: Why Risk Management is the Core of Trading
Most beginners focus on finding the “perfect strategy.” They try indicators, signals, or tips. But even the most accurate strategies have losing trades.
Consider two traders:
Trader A: Has a 70% winning strategy but risks 20% of capital per trade.
Trader B: Has a 50% winning strategy but risks only 1% of capital per trade.
Who survives longer? Trader B. Why? Because Trader A only needs a short losing streak to blow up his account, while Trader B can survive hundreds of trades.
Risk management ensures three things:
Survival: You live to trade another day.
Consistency: Your equity curve grows steadily without wild drawdowns.
Confidence: Knowing losses are controlled reduces stress and emotions.
In short: Trading without risk management is gambling.
Chapter 3: The Mathematics of Risk
3.1 The Risk of Ruin
Risk of ruin means the probability of losing all your trading capital. If you risk too much per trade, your account may not survive inevitable losing streaks.
Example:
If you risk 20% per trade, a losing streak of just 5 trades wipes out 67% of your account. To recover, you would need a 200% gain!
But if you risk 1% per trade, even 20 consecutive losses only reduce your account by ~18%. That’s survivable.
3.2 Risk-Reward Ratio
The Risk-Reward Ratio (RRR) measures potential reward compared to risk.
If you risk ₹100 to make ₹200, your RRR is 1:2.
A higher RRR allows profitability even with a low win rate.
For example:
At 1:2 RRR, you need only 34% win rate to break even.
At 1:3 RRR, just 25% win rate keeps you profitable.
3.3 Position Sizing Formula
A popular formula is:
Position Size = (Account Size × Risk per Trade) ÷ Stop Loss (in points/value)
Example:
Account Size = ₹1,00,000
Risk per Trade = 1% = ₹1,000
Stop Loss = ₹10 per share
Position Size = 1000 ÷ 10 = 100 shares
This ensures you never lose more than ₹1,000 in that trade.
Chapter 4: Tools of Risk Management
4.1 Stop Loss
A stop-loss order closes your trade automatically at a pre-defined price to limit losses. Types:
Hard Stop: Fixed exit point.
Trailing Stop: Moves with price to lock profits.
4.2 Take Profit
Opposite of stop-loss – locks in gains at a target level.
4.3 Diversification
Never put all capital into one trade or one asset. Spread risk across instruments, sectors, or strategies.
4.4 Hedging
Using options, futures, or correlated assets to reduce risk. Example: Buying Nifty futures and buying a protective put option.
4.5 Risk per Trade Rule
Most professional traders risk 0.5% to 2% of capital per trade. This balance allows growth while protecting against drawdowns.
4.6 Daily Loss Limit
Set a maximum daily loss (e.g., 3% of account). If hit, stop trading for the day. This prevents emotional revenge trades.
Chapter 5: Psychological Aspects of Risk
Risk management is not just technical; it’s psychological. Many traders fail because of:
Overconfidence: After wins, increasing position size too aggressively.
Fear: Cutting winners too early or avoiding valid trades.
Greed: Holding losers, hoping they’ll turn profitable.
Revenge Trading: Trying to recover losses quickly, leading to bigger losses.
Good risk management enforces discipline. You follow rules, not emotions.
Chapter 6: Advanced Risk Management Strategies
6.1 Kelly Criterion
A mathematical formula to optimize bet size based on edge and win probability.
Formula: f = (bp – q) / b*
Where:
f = fraction of capital to risk
b = odds (reward/risk)
p = probability of win
q = probability of loss
Although powerful, many traders use a fraction of Kelly (half-Kelly) to reduce volatility.
6.2 Value at Risk (VaR)
Common in institutional trading. It estimates the maximum expected loss over a given period at a certain confidence level (e.g., 95%).
6.3 Volatility-Based Position Sizing
Adjust position size according to market volatility. If volatility is high, trade smaller; if low, trade larger.
6.4 Portfolio Risk Management
Beyond individual trades, manage total portfolio risk. For example:
Limit exposure to correlated trades (e.g., don’t go long on multiple IT stocks at once).
Set maximum portfolio drawdown (e.g., 10%).
Chapter 7: Real-Life Examples
Example 1: The Trader Without Risk Management
Rahul has ₹1,00,000. He risks ₹20,000 per trade. After just 5 consecutive losses, his account drops to ₹33,000. To recover, he now needs +200% returns. Emotionally shattered, Rahul quits trading.
Example 2: The Disciplined Trader
Priya also starts with ₹1,00,000. She risks 1% per trade = ₹1,000. After 5 losses, she still has ₹95,000. She survives, learns, improves her strategy, and grows steadily.
Moral: Survival > Prediction.
Chapter 8: Building a Personal Risk Management Plan
Every trader must design a plan tailored to their style. Key components:
Capital Allocation: How much capital to trade vs. keep in reserve.
Risk per Trade: Set a percentage (1–2%).
Stop Loss Rules: Fixed or ATR (Average True Range) based.
Position Sizing Method: Use formula or volatility-based sizing.
Diversification Rules: Limit exposure per sector/asset.
Daily & Weekly Loss Limits: Stop trading after exceeding them.
Review & Adaptation: Analyze performance monthly and adjust.
Chapter 9: Common Mistakes Traders Make
Trading without stop losses.
Risking too much on one trade.
Averaging down losing trades.
Ignoring correlation between trades.
Trading during high-impact news without preparation.
Not tracking risk metrics (drawdown, expectancy, RRR).
Chapter 10: Risk Management for Different Trading Styles
Day Traders: Must be strict with intraday stop losses and daily limits.
Swing Traders: Should focus on overnight gap risk and diversify across positions.
Long-Term Investors: Must manage concentration risk and rebalance portfolios.
Options Traders: Need to monitor Greeks (Delta, Gamma, Vega) for exposure.
Conclusion
Risk management is the invisible hand that shapes trading success. While strategies may change, markets may evolve, and tools may improve, the principle remains timeless: Control risk, and profits will take care of themselves.
Every trader faces uncertainty, but those who respect risk survive and thrive. Without risk management, trading becomes a casino. With it, trading becomes a business.
Futures & Derivatives TradingIntroduction
The financial world is full of instruments designed to manage risk, improve returns, or speculate on price movements. Among these, derivatives stand out as some of the most powerful yet complex tools. They have been both praised for providing risk management solutions and criticized for their misuse in speculative bubbles.
At the heart of derivative trading lies futures contracts, which are widely used in stock markets, commodities, currencies, and even cryptocurrencies today. For beginners, the idea of betting on future prices might seem abstract, but in practice, derivatives are an essential pillar of modern finance.
In this guide, we’ll break down what derivatives are, how futures work, their role in trading, strategies, advantages, risks, and real-world examples. By the end, you’ll have a strong grasp of this exciting domain.
1. What Are Derivatives?
A derivative is a financial contract whose value is derived from the price of an underlying asset.
Underlying assets can be stocks, bonds, commodities (gold, oil, wheat), currencies, indices (Nifty 50, S&P 500), or even interest rates.
The derivative itself has no intrinsic value—its worth comes purely from the asset it tracks.
Key Types of Derivatives:
Futures – Standardized contracts to buy/sell an asset at a predetermined future date and price.
Options – Contracts that give the buyer the right, but not the obligation, to buy/sell at a specific price within a certain period.
Forwards – Similar to futures but customized and traded over-the-counter (OTC).
Swaps – Agreements to exchange cash flows (e.g., fixed vs. floating interest rates).
Futures are the most actively traded derivatives worldwide, making them the cornerstone of modern derivative trading.
2. Understanding Futures Contracts
A futures contract is an agreement between two parties to buy or sell an asset at a future date for a price decided today.
Features of Futures:
Standardized: Contracts are uniform in terms of size, expiration date, and rules (unlike forwards).
Exchange-traded: Futures trade on regulated exchanges (like NSE in India, CME in the US).
Margin & Leverage: Traders don’t pay the full contract value upfront. Instead, they deposit a small margin, which allows them to control large positions with less capital.
Settlement: Contracts may be settled physically (actual delivery of the asset) or in cash (profit/loss paid without delivery).
Example:
Suppose you buy a Nifty 50 Futures contract at 22,000. If at expiry, Nifty is at 22,500:
You gain = 500 × lot size (say 50) = ₹25,000.
If Nifty falls to 21,800:
You lose = 200 × 50 = ₹10,000.
This leverage magnifies both profits and losses.
3. Why Futures & Derivatives Exist
Derivatives serve three main purposes:
Hedging (Risk Management)
Farmers use commodity futures to lock in crop prices.
Importers hedge currency risk using forex futures.
Stock investors hedge downside risk with index futures.
Speculation
Traders bet on the price direction of oil, stocks, or indices without owning them.
Speculators provide liquidity to the market.
Arbitrage
Traders exploit price differences between spot and futures markets for risk-free profit.
Without derivatives, markets would be less liquid, riskier, and less efficient.
4. Futures Market Structure
Futures trading involves multiple participants:
Hedgers – Reduce risk (e.g., a farmer locking wheat prices).
Speculators – Take risk to profit from price changes.
Arbitrageurs – Exploit mispricing between markets.
Exchanges – NSE, CME, ICE, etc., which standardize and regulate contracts.
Clearing Houses – Guarantee contract performance and manage counterparty risk.
This structure ensures trust, transparency, and liquidity.
5. Key Terminologies in Futures & Derivatives
Spot Price – Current market price of the underlying asset.
Futures Price – Price agreed for future delivery.
Margin – Initial deposit (usually 5-15% of contract value) to trade futures.
Mark-to-Market (MTM) – Daily settlement of profits/losses.
Lot Size – Minimum quantity per contract (e.g., Nifty Futures = 50 units).
Expiry Date – Last date on which the contract is valid.
Open Interest – Total outstanding contracts in the market.
6. Trading Futures: Step-by-Step
Let’s walk through how a futures trade happens:
Decide Asset: Choose whether to trade index, stock, commodity, or currency futures.
Select Contract: Pick expiry month (near-month, mid-month, far-month).
Check Margin: Ensure sufficient capital for margin requirements.
Place Order: Buy (long) if expecting rise, Sell (short) if expecting fall.
MTM Adjustments: Profits/losses credited daily to trading account.
Exit or Hold: Close position before expiry or hold till expiry for settlement.
This cycle repeats every expiry, creating continuous opportunities for traders.
7. Strategies in Futures Trading
(A) Hedging Strategies
Long Hedge: A company buying raw material futures to guard against price rise.
Short Hedge: A farmer selling wheat futures to protect against price fall.
(B) Speculative Strategies
Long Futures: Buy futures anticipating price increase.
Short Futures: Sell futures anticipating price decline.
(C) Spread Trading
Calendar Spread: Buy near-month futures, sell far-month futures.
Inter-Commodity Spread: Trade two related commodities (e.g., crude oil vs. heating oil).
(D) Arbitrage Strategies
Cash & Carry Arbitrage: Buy asset in spot, sell futures if futures are overpriced.
Reverse Arbitrage: Sell asset in spot, buy futures if futures are underpriced.
8. Futures in Different Markets
(i) Stock Index Futures
Most popular in India (Nifty, Bank Nifty).
Allow trading market direction without stock picking.
(ii) Single Stock Futures
Futures on individual stocks (e.g., Reliance, TCS).
Higher risk as volatility is stock-specific.
(iii) Commodity Futures
Gold, silver, crude oil, wheat, copper.
Essential for farmers, producers, and speculators.
(iv) Currency Futures
USD/INR, EUR/USD, GBP/INR.
Help businesses hedge forex risk.
(v) Interest Rate Futures
Bonds and Treasury futures.
Used by banks and institutions to manage interest rate risk.
(vi) Crypto Futures
Bitcoin, Ethereum futures on exchanges like CME and Binance.
Extremely volatile, attracting speculative traders.
9. Advantages of Futures & Derivatives
Leverage: Control large positions with small margin.
Liquidity: Futures markets are highly liquid.
Transparency: Exchange-traded and regulated.
Hedging: Protection against adverse price movements.
Arbitrage Opportunities: Ensure fair pricing between spot and futures.
10. Risks in Futures & Derivatives
Leverage Risk: Small price moves can cause huge losses.
Liquidity Risk: Some contracts may lack liquidity.
Market Risk: Prices may move unpredictably.
Margin Calls: Traders must add funds if losses reduce margin balance.
Speculative Excess: Misuse of leverage can lead to financial crises (e.g., 2008).
Conclusion
Futures & derivatives are double-edged swords. Used wisely, they provide powerful tools for hedging, speculation, and arbitrage. Misused, they can cause devastating losses.
For traders, understanding market structure, margin system, risk management, and strategies is key before jumping in. Futures are not just about predicting the market—they’re about managing uncertainty.
Whether you’re a farmer protecting crop prices, a company managing forex risk, or a trader chasing short-term profits, derivatives are central to modern finance. With discipline and knowledge, they can open doors to immense opportunities.
Price Action Trading Strategies1. Introduction to Price Action Trading
In the world of trading, countless strategies exist—some rely heavily on indicators, some on algorithms, and others on fundamental data. But one timeless method stands apart: Price Action Trading.
At its core, price action trading is the art of making trading decisions solely based on the movement of price on the chart, without depending too much on lagging indicators like RSI, MACD, or moving averages. Instead, traders read the raw story of the market through candlestick structures, patterns, and levels.
Think of it as reading a book. Every candle tells a story:
Who is stronger—buyers or sellers?
Is the market trending or consolidating?
Is there a potential reversal or continuation?
This method has been used for decades by professional traders because price is the ultimate truth. Indicators may lag, news may be noisy, but price always reflects what’s happening in real time.
2. Core Principles of Price Action
Before diving into strategies, let’s build the foundation.
(a) Market Structure
Price moves in waves—higher highs & higher lows in an uptrend, lower highs & lower lows in a downtrend. Recognizing market structure helps you avoid trading against the dominant flow.
(b) Support and Resistance
These are the backbone of price action trading:
Support: A price level where demand is strong enough to stop a fall.
Resistance: A level where supply is strong enough to cap a rise.
Traders often mark these levels on daily, 4H, or 1H charts to identify potential entry zones.
(c) Supply and Demand Zones
Instead of flat lines, advanced traders look at zones (rectangular regions) where large buying/selling orders entered the market. Price often reacts strongly when revisiting these zones.
(d) Candlestick Psychology
Candlesticks show battle outcomes between bulls and bears. For example:
Long wick at bottom = buyers rejected lower prices.
Engulfing candle = strong reversal signal.
Understanding this psychology forms the essence of price action trading.
(e) Trendlines & Channels
Drawing trendlines helps in identifying trend continuation and potential breakout points. Price often respects channels before making strong moves.
3. Key Tools of Price Action
Unlike indicator-heavy traders, price action traders rely mainly on the chart itself. Key tools include:
Candlestick Patterns (Doji, Pin Bar, Engulfing, etc.)
Chart Patterns (Head & Shoulders, Double Top/Bottom, Triangles, Flags)
Breakouts & Retests
Volume Analysis (optional but powerful to confirm breakouts)
These tools are combined to form actionable strategies.
4. Popular Price Action Patterns
(a) Pin Bar (Rejection Candle)
Long wick + small body.
Signals rejection of a price level.
Example: A bullish pin bar at support indicates buyers defending the zone.
(b) Engulfing Pattern
A candle completely engulfs the previous one.
Bullish engulfing after a downtrend = reversal to upside.
Bearish engulfing after an uptrend = reversal to downside.
(c) Inside Bar
Small candle within the previous candle’s range.
Indicates indecision, often followed by strong breakout.
(d) Double Top & Double Bottom
Double Top: Price tests a resistance twice but fails → bearish reversal.
Double Bottom: Price tests support twice but fails → bullish reversal.
(e) Head and Shoulders
Classic reversal pattern indicating exhaustion of trend.
Head & Shoulders Top → bearish reversal.
Inverse Head & Shoulders → bullish reversal.
5. Price Action Trading Strategies
Now, let’s explore actionable strategies.
Strategy 1: Support & Resistance Bounce
Mark strong daily/weekly support and resistance.
Wait for price to test these levels.
Look for candlestick confirmation (pin bar, engulfing).
Trade in the direction of rejection.
👉 Example: Bank Nifty tests 45,000 support and forms bullish engulfing → buy with stop-loss below support.
Strategy 2: Breakout and Retest
Markets often consolidate before breaking out strongly.
Steps:
Identify a consolidation range.
Wait for breakout (above resistance / below support).
Don’t jump immediately—wait for retest of the broken level.
Enter trade in breakout direction.
👉 Example: Nifty breaks out of 20,000, comes back to retest 20,000 → strong buy.
Strategy 3: Trendline Trading
Draw a trendline connecting higher lows in an uptrend or lower highs in a downtrend.
Buy near trendline support in uptrend, sell near trendline resistance in downtrend.
Look for pin bars or engulfing candles as confirmation.
Strategy 4: Supply & Demand Zone Trading
Mark zones where strong rallies or falls originated.
Wait for price to revisit those zones.
Look for candlestick rejection.
Enter with stop-loss beyond zone.
👉 Example: Reliance stock rallies from ₹2,200 to ₹2,400. Mark demand zone at ₹2,200–₹2,220. When price revisits, buy again.
Strategy 5: Inside Bar Breakout
Find inside bar pattern (consolidation).
Place buy stop above high, sell stop below low.
Whichever breaks, enter trade.
Works best in trending markets.
Strategy 6: Fake Breakout (Stop Hunt Strategy)
Institutions often trigger stop-losses before moving price in real direction.
Spot false breakouts near key levels.
Enter in opposite direction after quick rejection.
👉 Example: Price breaks below support, instantly reverses with bullish engulfing → buy.
Strategy 7: Multi-Timeframe Price Action
Identify higher timeframe trend (daily/4H).
Drop to lower timeframe (15M/1H) for entry.
Align both trends for high probability setups.
Strategy 8: Range Trading
In sideways markets, mark horizontal support & resistance.
Buy near support, sell near resistance.
Exit at opposite boundary.
Strategy 9: Pullback Entry
In a trending market, avoid chasing moves.
Wait for pullback to support (uptrend) or resistance (downtrend).
Enter when trend resumes.
👉 Example: Nifty rallies, pulls back to 20EMA, forms bullish engulfing → buy continuation.
Strategy 10: Price Action with Volume
Combine volume with candlestick setups.
Breakout + high volume = strong move.
Pin bar rejection + high volume = reliable reversal.
6. Risk Management in Price Action Trading
No strategy works without proper risk control.
Always use stop-loss (below support for buys, above resistance for sells).
Risk only 1–2% of capital per trade.
Use risk-to-reward ratio (R:R) of at least 1:2.
Avoid overtrading—wait for high-quality setups.
7. Psychology in Price Action
Price action requires patience. Unlike indicator traders, price action traders must wait for price to tell its story.
Key psychological rules:
Don’t predict; react.
Avoid FOMO (fear of missing out).
Stick to your trading plan.
Journal every trade for review.
8. Advantages of Price Action Trading
Works across all markets (stocks, forex, commodities, crypto).
No dependency on lagging indicators.
Helps understand real market psychology.
Clean charts → better decision-making.
9. Limitations of Price Action
Subjective → two traders may draw different support/resistance.
Requires experience & screen time.
False signals in volatile markets.
Needs discipline to wait for confirmation.
10. Conclusion
Price action trading is a timeless and powerful method for understanding market movements. It doesn’t rely on fancy indicators but instead focuses on the raw truth: the price itself.
Whether you trade intraday, swing, or positional, mastering price action strategies—support/resistance, breakouts, pin bars, engulfing patterns, supply-demand zones—can give you an edge.
But remember: strategies alone don’t guarantee profits. Discipline, risk management, and patience are equally important. Price action is like learning a new language—the more you practice, the more fluent you become in reading the market’s story.
Part 2 Master Candle Sticks PatternIntroduction to Options Trading
In the world of financial markets, options trading is considered one of the most powerful and flexible forms of trading. Unlike simple stock buying and selling, options allow traders to control larger positions with less capital, hedge their risks, and design strategies that fit different market conditions — bullish, bearish, or even sideways.
An option is essentially a contract that gives the buyer the right, but not the obligation, to buy or sell an asset at a specific price (called the strike price) within a given period of time.
If you buy an option, you are purchasing a right.
If you sell (or write) an option, you are giving someone else that right and taking on an obligation.
Options are traded on stocks, indexes (like Nifty 50 or Bank Nifty in India), commodities, currencies, and even cryptocurrencies in some global markets.
They are widely used by:
Investors to hedge portfolios.
Speculators to make money from price moves.
Institutions to manage large exposures.

Part 4 Learn Institutional TradingParticipants in Options Market
Hedgers: Farmers, companies, or investors protecting against risk. Example: An airline hedging fuel cost with options.
Speculators: Traders betting on market moves with limited capital.
Arbitrageurs: Exploit mispricing between options and underlying.
Why Trade Options?
✅ Advantages:
Leverage: Small premium can control large value.
Flexibility: Can profit in any market condition.
Defined Risk: Buyer’s maximum loss = premium paid.
Income Strategies: Writing options to earn premium.
❌ Risks:
Time Decay: Options lose value daily.
Complexity: Many moving factors (Greeks, volatility).
Unlimited Losses (for Sellers): If selling naked options.

Momentum Trading Strategies1. Introduction to Momentum Trading
If you’ve ever watched a cricket match where a batsman suddenly starts hitting boundaries one after another, you’ll notice something called momentum. Once the flow begins, it often continues until something major interrupts it. The same happens in stock markets.
Momentum trading is built on a simple idea:
👉 “Stocks that are moving strongly in one direction are likely to keep moving in that direction—at least for a while.”
In trading, momentum is like catching a moving train. Instead of trying to guess where the train will start or stop, you jump on when it’s already moving. Unlike long-term investing, where you analyze fundamentals deeply, momentum trading is more about riding the wave created by news, earnings, emotions, or institutional flows.
For example:
If Reliance stock is up 8% today on strong earnings and massive volume, a momentum trader might buy in, expecting further upside tomorrow or over the next week.
If crude oil prices fall sharply, a momentum trader might short oil stocks, assuming more selling pressure will follow.
So momentum trading isn’t about predicting the future—it’s about following what’s already happening.
2. The Psychology Behind Momentum
Markets are not purely logical. They are driven by human behavior—fear, greed, and herd mentality. Momentum thrives on these psychological forces:
Herd Behavior – When people see a stock rising, they rush in, fearing they’ll miss out (FOMO). This buying creates more buying.
Confirmation Bias – Traders look for news or charts that confirm their belief, reinforcing the trend.
Fear of Loss – When prices fall, investors panic and sell, creating downward momentum.
Overreaction – Markets often overreact to news—both positive and negative. Momentum traders exploit this by catching the exaggerated moves.
That’s why momentum works: people chase winners and dump losers.
3. Core Principles of Momentum Trading
To really get momentum trading, let’s simplify it into a few golden rules:
The Trend is Your Friend – Don’t fight against the flow. If Nifty is trending up with strong breadth, focus on long trades.
Volume Confirms Momentum – Price alone is not enough. A move backed by high trading volume signals real strength.
Momentum Has a Shelf Life – No stock rises forever. Momentum fades when buyers lose energy. So, entry and exit timing is crucial.
Relative Strength Matters – Stronger stocks outperform weaker ones, especially in bull markets. Momentum traders prefer leaders, not laggards.
Risk is Key – Since momentum can reverse sharply, strict stop-loss discipline is non-negotiable.
Think of momentum like surfing. You don’t control the wave—you just ride it until it fades, then exit before it crashes.
4. Popular Momentum Trading Strategies
Momentum isn’t one single style—it’s a family of approaches. Let’s explore the most widely used ones:
4.1 Breakout Trading
This is the classic momentum method. Traders wait for a stock to break above resistance or below support with strong volume.
Example:
Stock X is stuck between ₹100–₹110 for weeks.
Suddenly, it breaks above ₹110 with huge volume.
A momentum trader buys here, expecting ₹120, ₹125, or higher.
The psychology? Breakouts attract fresh buyers, and shorts are forced to cover—fueling momentum.
4.2 Moving Average Crossover Strategy
Traders use moving averages (like 20-day, 50-day, 200-day) to capture momentum.
If a short-term average (20-day) crosses above a longer one (50-day), it signals upward momentum.
If it crosses below, it signals downward momentum.
This strategy filters noise and captures medium-term trends.
4.3 Relative Strength Strategy
Momentum traders often compare how a stock is performing relative to the overall market or sector.
Example:
Nifty is up 1%, but Stock A is up 6%.
That relative strength suggests momentum, making Stock A a candidate for long trades.
The reverse works for shorting weak stocks in a weak market.
4.4 Intraday Momentum Scalping
Some traders capture quick bursts of momentum within minutes or hours. They trade news, economic data releases, or sudden volume spikes.
For instance, if Infosys announces strong guidance at 10 AM, intraday momentum traders jump in for a 2–3% move before it cools off.
4.5 News & Earnings-Based Momentum
Earnings season is a goldmine for momentum traders. Positive surprises often create upward momentum; negative surprises trigger downward spirals.
Example:
Company beats earnings estimates → stock gaps up 10%.
Traders buy expecting continued demand from institutions.
This “post-earnings drift” is a classic momentum phenomenon.
4.6 Sector Rotation Momentum
Big money often flows into specific sectors (IT, Banks, Pharma) during different phases of the economy.
Momentum traders ride the hot sector until it cools.
Example:
When RBI cuts rates, banking stocks rally for weeks.
A trader focuses on the strongest banks instead of random picks.
5. Technical Indicators Used in Momentum
Momentum trading heavily relies on technical analysis. Some widely used tools:
Relative Strength Index (RSI) – Measures speed of price movements. Above 70 = overbought, below 30 = oversold.
Moving Average Convergence Divergence (MACD) – Tracks trend strength using moving averages.
Rate of Change (ROC) – Calculates % change in price over a period.
Volume Indicators (OBV, VWAP) – Confirm if price moves are supported by volume.
Bollinger Bands – Help spot volatility and potential momentum breakouts.
These are not perfect, but they guide entry/exit decisions.
6. Risk Management in Momentum Trading
Momentum can be rewarding but also dangerous because reversals are sudden. To survive, traders follow strict rules:
Stop-Loss Orders – Never trade without a predefined exit point.
Position Sizing – Don’t put all capital in one trade. Risk 1–2% per trade.
Avoid Overnight Risk (for intraday) – News or global events can reverse momentum overnight.
Don’t Chase Too Late – Entering after a huge move often results in buying the top.
Take Partial Profits – Lock in gains as momentum matures.
Think of risk management as your seatbelt—it won’t prevent the accident, but it can save your life.
7. Real-Life Examples of Momentum Trading
Example 1: Adani Enterprises 2020–2022
Adani stocks had a massive rally driven by infrastructure growth stories. Traders who identified the breakout early rode the multi-month momentum.
Example 2: Tesla in the US
Tesla stock in 2020–21 was a momentum trader’s dream—surging 10x in months. Technical breakouts plus EV hype created sustained momentum.
Example 3: COVID Crash & Recovery (2020)
Markets fell sharply in March 2020. Momentum traders shorted stocks during the fall. Then, when recovery began, they switched sides and rode the rally.
8. Advantages and Challenges
Advantages
Quick profits in short time.
Works in both rising and falling markets.
Backed by psychology and herd behavior.
Flexible—can be applied intraday, swing, or positional.
Challenges
Momentum is short-lived; timing is tricky.
False breakouts can trap traders.
High emotional stress due to volatility.
Requires constant monitoring—can’t be passive.
9. Tips for Traders
Trade only liquid stocks—avoid low-volume traps.
Combine momentum with fundamentals for stronger conviction.
Don’t overtrade; wait for clear setups.
Learn to exit gracefully—don’t wait for the last rupee.
Keep a trading journal to track what worked and what didn’t.
10. Conclusion
Momentum trading is like riding waves in the ocean—you don’t create the wave, you just ride it skillfully. It’s about speed, timing, and discipline. Done well, it can be one of the most profitable trading styles. Done poorly, it can wipe out accounts.
The key is to remember:
Follow the trend, not emotions.
Risk management is more important than entries.
Momentum is temporary—treat it like an opportunity, not a guarantee.
If investing is like planting a tree, momentum trading is like harvesting fruits quickly when they’re ripe. Both can make money, but momentum needs sharper focus and faster decisions.