Part 9 Trading Master Class1. How Option Trading Works
Let’s take a practical example.
Stock: TCS trading at ₹3600
You think it will rise.
You buy a call option with strike price ₹3700, paying ₹50 premium.
Two scenarios:
If TCS goes to ₹3900 → You can buy at ₹3700, sell at ₹3900, profit = ₹200 – ₹50 = ₹150.
If TCS stays at ₹3600 → Option expires worthless, you lose only the premium ₹50.
That’s the beauty: limited loss, unlimited profit (for buyers).
For sellers (writers), it’s the opposite: limited profit (premium collected), unlimited risk.
2. Options vs Stocks
Stocks: Ownership of company shares.
Options: Rights to trade shares at fixed prices.
Differences:
Options expire, stocks don’t.
Options require less money upfront (leverage).
Options can hedge risks, stocks cannot.
3. Why Traders Use Options
Options are versatile. Traders use them for three main reasons:
Hedging – Protecting portfolios from losses.
Example: If you own Nifty stocks but fear a market fall, buy a Nifty put option. Losses in shares will be offset by gains in the put.
Speculation – Betting on price moves with limited risk.
Example: Buy a call if you think price will go up.
Income Generation – Selling (writing) options to collect premiums.
Example: Covered calls strategy.
4. Option Pricing: The Greeks & Premium
An option’s price (premium) depends on several factors:
Intrinsic Value: The real value (difference between stock price & strike price).
Time Value: Extra cost due to time left until expiry.
Volatility: Higher volatility = higher premium (more chances of big moves).
The Option Greeks measure sensitivity:
Delta: How much option moves with stock.
Theta: Time decay (options lose value as expiry nears).
Vega: Impact of volatility changes.
Gamma: Rate of change of delta.
5. Strategies in Option Trading
This is where options shine. Traders can design strategies based on market outlook.
Bullish Strategies:
Buying Calls
Bull Call Spread
Bearish Strategies:
Buying Puts
Bear Put Spread
Neutral Strategies:
Iron Condor
Butterfly Spread
Income Strategies:
Covered Calls
Cash-Secured Puts
Options allow creativity – you can profit in rising, falling, or even stagnant markets.
X-indicator

Part 3 Learn Institutional Trading1. Introduction to Options Trading
Options trading is one of the most versatile and complex areas of financial markets. It offers traders and investors the ability to hedge, speculate, or generate income. Unlike stocks, which represent ownership in a company, options are financial contracts giving the buyer the right, but not the obligation, to buy or sell an underlying asset at a predetermined price within a specified time frame.
Options are derivatives, meaning their value derives from an underlying asset such as equities, indices, commodities, or currencies. They are widely used by institutional traders, retail investors, and hedgers to manage risk and leverage positions efficiently.
2. Types of Options
There are two primary types of options:
Call Options
Gives the holder the right to buy an underlying asset at a specified price (strike price) before or on the expiry date.
Used by traders who expect the price of the asset to rise.
Put Options
Gives the holder the right to sell an underlying asset at a specified price before or on expiry.
Used by traders who expect the price of the asset to fall.
Key Terms in Options Trading
Strike Price (Exercise Price): The predetermined price at which the asset can be bought or sold.
Expiry Date: The date by which the option must be exercised.
Premium: The cost of buying the option.
Intrinsic Value: The actual value if exercised immediately (difference between market price and strike price).
Time Value: Extra value reflecting the possibility of future price movement before expiry.
3. How Options Work
Options can be exercised in two styles:
American Style Options: Can be exercised anytime before expiry.
European Style Options: Can only be exercised on the expiry date.
Example:
You buy a call option for stock XYZ with a strike price of ₹1,000, expiring in 1 month.
Current market price is ₹1,050, and the premium paid is ₹50.
If the stock rises to ₹1,200, you can exercise the option and make a profit:
Profit = (Stock Price − Strike Price − Premium) = 1,200 − 1,000 − 50 = ₹150 per share.
4. Factors Influencing Option Prices
Option pricing is influenced by multiple factors:
Underlying Asset Price: The most direct influence; options gain value when the underlying asset moves favorably.
Strike Price: Determines the intrinsic value of the option.
Time to Expiry: More time generally means higher premiums because there is more chance for price movement.
Volatility: Higher volatility increases the likelihood of profitable movements, raising option premiums.
Interest Rates and Dividends: Affect option pricing for longer-term contracts.
The widely used Black-Scholes model calculates theoretical option prices, taking these variables into account.

Micro Events, Macro Impact: Trading the Small SignalsUnderstanding Micro Events
At its core, a micro event is a seemingly minor incident or signal that, while small in isolation, carries the potential to trigger broader market reactions. Examples include:
Minor corporate announcements: Small changes in guidance, product launches, or leadership shifts.
Order flow imbalances: Subtle surges in buy or sell orders within a short timeframe.
News snippets: A brief comment by an industry expert or a regulator’s minor statement.
Technical micro-signals: Price patterns like a micro double bottom, micro breakouts, or brief volume spikes.
These events might appear insignificant to the casual observer. However, when a skilled trader recognizes the context and potential ripple effects, these micro signals become invaluable for crafting trading strategies.
The Science Behind Micro Events
The efficacy of micro-event trading is grounded in market psychology and structure. Financial markets are a network of participants—retail traders, institutional investors, hedge funds, and algorithmic traders—reacting in real-time to information. Small events often act as catalysts, triggering larger market reactions because they interact with existing positions, expectations, or technical structures.
For example, consider a minor supply chain disruption reported by a mid-tier company. While the headline might not grab media attention, it could foreshadow a ripple in the entire sector if institutional traders recognize the potential impact. Markets, in essence, amplify micro events because participants react collectively, creating macro-level price movements.
Categories of Micro Events
Micro events can be classified into several categories:
Corporate Micro Events:
Insider trades, subtle guidance changes, or small earnings beats/misses.
Example: A tech company slightly upgrades its quarterly guidance due to increased orders. This could lead to sector-wide optimism and a short-term surge in related stocks.
Technical Micro Signals:
Minute chart patterns, support/resistance tests, or tiny volume surges.
Example: A stock repeatedly bouncing at a micro support level could indicate accumulation, foreshadowing a breakout.
Market Microstructure Events:
Order book imbalances, unusual options activity, or flash trades.
Example: A sudden spike in call option volume may signal bullish sentiment before broader market recognition.
News Micro Events:
Subtle statements from regulators, small policy shifts, or low-profile analyst upgrades/downgrades.
Example: A brief comment on interest rate policy may cause immediate, small-scale currency movements, which can be leveraged by nimble forex traders.
Why Micro Events Matter
Most traders chase macro events, such as inflation data, central bank decisions, or corporate earnings. These events are widely covered, highly anticipated, and often priced in by the time they occur. Micro events, on the other hand, offer early insights and first-mover advantage:
Preemptive Trading Opportunities: Spotting a micro signal allows traders to position themselves before larger market participants react.
Lower Competition: Fewer traders monitor these small signals, reducing crowded trades and potential slippage.
Precision Entry and Exit: Micro events often provide tighter risk/reward ratios since they generate localized price movements.
In short, trading micro events is about turning subtle observations into actionable strategies, capturing profits that others might miss.
Identifying Micro Events
Identifying micro events requires a combination of market awareness, technical expertise, and psychological insight. Here are the key steps:
1. Monitor Market Flow
Pay attention to order books, trade volumes, and market depth. Unusual spikes in activity, even if minor, can hint at upcoming price shifts. Algorithmic and institutional traders often act on these micro signals, creating patterns that observant traders can exploit.
2. Track Minor News and Announcements
Not all news is created equal. Small updates—like a management reshuffle, patent approval, or minor regulation—may seem inconsequential. However, if they alter future growth expectations or competitive dynamics, they can trigger a ripple effect.
3. Analyze Technical Micro Patterns
Micro-level chart patterns—visible on 1-minute, 5-minute, or intraday charts—can be critical. Examples include:
Micro double tops/bottoms
Small-scale trendline breaks
Tiny consolidation zones before breakout
These patterns often precede larger movements and can guide entry and exit points.
4. Observe Sentiment Shifts
Even minor changes in sentiment can create micro events. Social media chatter, analyst micro-reports, or investor forum discussions can signal underlying momentum. Traders with real-time sentiment analysis tools often capitalize on these subtle shifts.
Trading Strategies Based on Micro Events
Once identified, micro events can be leveraged through specialized trading strategies. Here’s a breakdown:
1. Scalping Micro-Moves
Scalping involves capturing tiny price movements within a short time frame, often minutes. Micro events, such as sudden volume surges or small technical breakouts, are ideal triggers.
Example: A sudden uptick in buying activity for a stock forming a micro support level. A scalper enters a long position, targeting a 0.5–1% price gain.
Key considerations: Tight stop losses, fast execution, and real-time monitoring are essential. Scalpers thrive on speed and precision.
2. Event-Driven Swing Trading
Swing traders can use micro events to predict short-term price swings, usually lasting days to weeks.
Example: A minor product launch by a pharmaceutical company sparks optimism in its peers. Swing traders may buy the stock in anticipation of broader sector gains.
Key considerations: Context matters. Not all micro events generate follow-through; understanding the sector and broader market sentiment is crucial.
3. Micro Arbitrage
Micro events can create temporary pricing inefficiencies between related instruments, such as stocks and options, ETFs, or derivatives.
Example: A minor earnings beat leads to an immediate but small undervaluation in options pricing. Traders can exploit the difference before markets adjust.
Key considerations: Requires quick execution and precise calculation of risk/reward ratios.
4. Sentiment-Based Micro Trading
Using micro events to gauge shifts in sentiment can be powerful. Traders track subtle cues, such as minor regulatory comments or analyst chatter, to anticipate short-term moves.
Example: A small downgrade in an energy stock triggers fear in the sector. Traders short the stock, benefiting from the immediate reaction before the broader market recalibrates.
Key considerations: Accurate sentiment measurement tools and a disciplined approach to avoid overreacting to noise.
Risk Management in Micro Event Trading
While micro events offer opportunities, they also carry risks:
False Signals: Not every minor signal leads to a significant movement. Traders must filter noise.
High Volatility: Small events can cause sharp, unpredictable spikes, especially in low-liquidity instruments.
Execution Risk: Timing is critical. Delayed execution can turn potential profits into losses.
Best Practices:
Use tight stop-losses and position sizing appropriate for the volatility.
Combine micro signals with broader trend confirmation.
Maintain discipline; not all signals are worth trading.
Keep track of historical micro event outcomes to identify patterns and improve predictive accuracy.
Case Studies: Micro Events Driving Macro Impact
Case Study 1: Technical Micro Breakout
A mid-cap technology stock repeatedly tests a micro resistance level of ₹1,500. A surge in intraday volume on a minor news update triggers a breakout. Traders who recognized the micro event early capture a 5–7% gain within a week.
Insight: Monitoring intraday technical signals alongside minor news can identify profitable trades before mainstream media reacts.
Case Study 2: Minor Corporate Announcement
A leading pharmaceutical company reports a slight improvement in production efficiency. Although the news is minor, traders anticipate better margins and sector optimism. The stock gains 10% over the next month.
Insight: Even minor guidance updates can drive sector-wide movement if they signal broader implications.
Case Study 3: Market Microstructure Imbalance
An unusual surge in call options for a retail stock indicates bullish sentiment. Within hours, the stock rises 3%, suggesting institutional traders were positioning for a minor positive catalyst.
Insight: Tracking options flow and order book imbalances can reveal hidden opportunities invisible to traditional analysis.
Tools for Micro Event Trading
Successful micro event trading relies on technology and analysis tools:
Real-Time News Aggregators: Capture minor updates instantly.
Order Book & Market Depth Tools: Identify subtle shifts in supply-demand dynamics.
Sentiment Analysis Platforms: Track investor mood from social media, news, and forums.
Intraday Technical Indicators: Use 1-minute to 15-minute charts to spot micro patterns.
Algorithmic Alerts: Custom algorithms can detect unusual volume spikes or price anomalies.
Psychological Edge
Trading micro events requires mental agility. Unlike macro trading, where moves unfold over weeks or months, micro-event trading demands fast decision-making. Traders must cultivate:
Observation Skills: Ability to spot tiny shifts before others.
Patience: Avoid overtrading on insignificant events.
Discipline: Stick to pre-defined entry/exit rules.
Adaptability: Recognize when a signal fails and exit gracefully.
Integrating Micro Event Analysis with Macro Strategy
While micro events are powerful, they are most effective when combined with macro-level awareness. For instance:
Micro events provide early warning signals for larger trends.
Macro events validate micro signals, reducing false positives.
Micro event insights allow precise entries and exits within a macro trading framework.
By combining both levels of analysis, traders can optimize risk-reward, improve timing, and enhance overall performance.
Conclusion: The Power of the Small
The mantra “Micro Events, Macro Impact” embodies a transformative approach to trading. In a market dominated by noise, the ability to discern subtle signals offers first-mover advantage, tighter risk management, and superior returns. Micro events may be small, but their impact, when understood and acted upon correctly, is magnified across the market landscape.
Successful micro-event trading is not about guessing—it’s about structured observation, disciplined execution, and strategic integration. Traders who master the art of spotting and acting on these small signals gain a competitive edge, capturing profits that many larger, slower participants overlook.
In the end, financial markets reward those who see what others don’t, act where others hesitate, and transform small sparks into macro gains. Micro events are not just minor incidents—they are the hidden engines driving major market movements.
Smart Money Secrets: Unlocking the Strategies of Market Insiders1. Understanding Smart Money
Smart money refers to capital controlled by institutional investors, hedge funds, central banks, high-net-worth individuals, or other financial entities that have access to superior information, resources, and analytical tools. Unlike retail traders, who often react emotionally to market events, smart money acts strategically, often positioning itself ahead of major market moves.
Key Characteristics of Smart Money
Informed Decision-Making: Smart money is guided by deep research, access to non-public or early public information, and advanced analytics.
Long-Term Strategy: While retail traders may chase short-term gains, smart money focuses on sustainable trends and risk-adjusted returns.
Market Influence: Large trades by institutional investors can move entire markets, influencing liquidity, price trends, and volatility.
Contrarian Behavior: Often, smart money goes against public sentiment, buying when retail panic sells and selling when retail greed drives prices up.
The essence of smart money is that it is strategically positioned, informed, and patient, making it a crucial concept for anyone seeking to understand market dynamics.
2. How Smart Money Moves
Smart money doesn’t just jump in randomly; its movements are deliberate, carefully calculated, and often hidden until the right moment.
a. Accumulation Phase
This is when smart money quietly starts buying a stock or asset without attracting attention. Retail traders may not notice, and prices may remain relatively flat. The goal is to accumulate a significant position at favorable prices.
Indicators of accumulation:
Increasing volume without major price movement.
Gradual upward trend after a prolonged downtrend.
Strong institutional buying reported in filings (e.g., 13F filings in the U.S.).
b. Markup Phase
Once enough positions are accumulated, smart money begins to push prices higher. This phase attracts retail traders and media attention. Prices may accelerate as momentum builds.
Indicators of markup:
Rising volume coinciding with price increase.
Breakouts above previous resistance levels.
Positive news and analyst upgrades (sometimes intentionally leaked).
c. Distribution Phase
Smart money slowly exits its positions, often selling to late-coming retail traders who are driven by hype. Despite the selling, the market may still appear bullish.
Indicators of distribution:
Volume spikes with minimal price change (selling into demand).
Repeated price rejection at key resistance levels.
Contradictory market sentiment (euphoria among retail investors).
d. Markdown Phase
Finally, the market corrects sharply as smart money has exited, leaving retail traders exposed. This phase often follows peaks in media coverage and public attention.
Indicators of markdown:
Price declines with increasing volume.
Negative news amplifying fear and panic selling.
Technical breakdowns through key support levels.
3. Tools to Track Smart Money
Identifying smart money movements requires using both technical and fundamental tools. Here are some widely used methods:
a. Volume Analysis
Volume spikes often indicate institutional activity. Unlike retail traders who trade in smaller sizes, large trades by institutions create noticeable volume patterns.
On-Balance Volume (OBV) and Volume Weighted Average Price (VWAP) can reveal buying or selling pressure not immediately visible in price charts.
b. Commitment of Traders (COT) Reports
COT reports, available for commodities and futures markets, show the positions of commercial and non-commercial traders. Sharp increases in commercial positions often signal smart money entering the market.
c. Options Market Activity
Unusual activity in call and put options may indicate that insiders or institutions are hedging large trades or anticipating significant moves.
Open interest changes and implied volatility spikes are useful signals.
d. Insider Trading Filings
In publicly traded companies, insider buying or selling can offer clues about smart money sentiment. While insiders may trade for personal reasons, consistent buying from executives can be a strong bullish signal.
e. Dark Pools
Large institutional trades are sometimes executed in private exchanges called dark pools to avoid affecting public prices. Tracking dark pool activity can give insights into hidden accumulation or distribution.
4. Psychology Behind Smart Money
Understanding smart money isn’t just about charts or filings—it’s also about human behavior and market psychology.
Fear and Greed: Retail traders often act on emotional impulses. Smart money exploits these emotions, buying when others fear and selling when others greed.
Patience and Discipline: Smart money waits for the right setup, unlike retail traders who chase immediate profits.
Contrarian Thinking: Going against the crowd is often a hallmark of smart money. Identifying overbought or oversold conditions allows them to capitalize on market sentiment extremes.
5. Strategies to Follow Smart Money
While replicating institutional strategies directly can be challenging due to scale and access, retail traders can learn and adapt techniques inspired by smart money principles.
a. Trend Following
Identify accumulation zones through volume and price analysis.
Ride trends in the markup phase while managing risk.
Avoid panic during minor corrections, focusing on broader smart money-driven trends.
b. Contrarian Investing
Look for areas where retail sentiment is extremely bullish (potential distribution) or extremely bearish (potential accumulation).
Use indicators like Fear & Greed Index, social media sentiment, and retail positioning metrics.
c. Risk Management
Smart money is always risk-aware. Proper position sizing, stop-loss strategies, and portfolio diversification help protect against unexpected moves.
Using tools like options for hedging can replicate professional risk management approaches.
d. Multi-Timeframe Analysis
Smart money operates across multiple timeframes—from intraday moves to multi-year positions.
Combining short-term and long-term charts can reveal where institutional positions are being built and unwound.
6. Common Smart Money Indicators
Several technical and market indicators are considered proxies for smart money activity:
Volume-Price Trend (VPT): Combines volume and price movement to indicate accumulation or distribution.
Accumulation/Distribution Line: Highlights whether a stock is being accumulated (bought) or distributed (sold).
Money Flow Index (MFI): A volume-weighted RSI that can reveal hidden buying/selling pressure.
VWAP (Volume Weighted Average Price): Tracks the average price weighted by volume—smart money often buys below VWAP and sells above it.
Conclusion
The secrets of smart money are not about mystical insider knowledge—they are about observation, discipline, and strategy. By studying market behavior, volume patterns, institutional filings, and psychological trends, retail traders can gain insights into the movements of the largest and most informed market players. While mimicking smart money directly is impossible for most individuals, understanding their methods, motives, and timing can provide a strategic edge, helping you make more informed and confident investment decisions.
Smart money strategies emphasize preparation, patience, and precision. By applying these principles consistently, retail traders can shift from reactive decision-making to proactive, informed, and strategic market engagement.
Divergence Secrets1. Basic Option Trading Strategies
These are simple, beginner-friendly strategies where risks are limited and easy to understand.
1.1 Covered Call
How it Works: You own 100 shares of a stock and sell a call option against it.
Goal: Earn income (premium) while holding stock.
Best When: You expect the stock to stay flat or slightly rise.
Risk: If stock rises too much, you must sell at the strike price.
Example: You own Infosys at ₹1,500. You sell a call at strike ₹1,600 for premium ₹20. If Infosys stays below ₹1,600, you keep the premium.
1.2 Protective Put
How it Works: You buy a put option to protect a stock you own.
Goal: Hedge downside risk.
Best When: You fear a market drop but don’t want to sell.
Example: You own TCS at ₹3,500. You buy a put with strike ₹3,400. If TCS falls to ₹3,200, your stock loses ₹300, but the put gains.
1.3 Cash-Secured Put
How it Works: You sell a put option while holding enough cash to buy the stock if assigned.
Goal: Earn premium and possibly buy stock at a discount.
Best When: You’re okay owning the stock at a lower price.
2. Intermediate Strategies
Now we step into strategies combining multiple options.
2.1 Vertical Spreads
These involve buying one option and selling another of the same type (call/put) with different strikes but same expiry.
(a) Bull Call Spread
Buy lower strike call, sell higher strike call.
Limited risk, limited profit.
Best when moderately bullish.
(b) Bear Put Spread
Buy higher strike put, sell lower strike put.
Best when moderately bearish.
2.2 Calendar Spread
Buy a long-term option and sell a short-term option at the same strike.
Profits if stock stays near strike as short-term option loses value faster.
2.3 Diagonal Spread
Like a calendar, but strikes are different.
Offers flexibility in adjusting for trend + time.
3. Advanced Option Trading Strategies
These are for experienced traders who understand volatility and time decay deeply.
3.1 Straddle
Buy one call and one put at same strike, same expiry.
Profits if the stock makes a big move in either direction.
Best before major events (earnings, policy announcements).
Risk: If stock stays flat, you lose premium.
3.2 Strangle
Similar to straddle, but strike prices are different.
Cheaper, but requires larger move.
3.3 Iron Condor
Sell an out-of-the-money call spread and put spread.
Profits if stock stays within a range.
Great for low-volatility environments.
3.4 Butterfly Spread
Combination of calls (or puts) where profit peaks at a middle strike.
Limited risk, limited reward.
Best when expecting very little movement.
3.5 Ratio Spreads
Sell more options than you buy (like 2 short calls, 1 long call).
Higher potential reward, but can be risky if stock trends too far.

Rate Hikes: Interest Rates vs. Inflation1. Introduction: The Relationship Between Interest Rates and Inflation
At its core, inflation refers to the sustained rise in the general price level of goods and services in an economy over time. When prices rise faster than incomes, purchasing power declines, impacting consumers, businesses, and investors.
Interest rates, on the other hand, represent the cost of borrowing money or the reward for saving. Central banks, like the Federal Reserve (US), Reserve Bank of India (RBI), or European Central Bank (ECB), manipulate policy interest rates to influence economic activity.
Key relationship:
When inflation rises beyond the central bank’s target, interest rates are often increased (a process called a “rate hike”) to curb spending and borrowing.
Conversely, during periods of low inflation or deflation, central banks may lower interest rates to stimulate demand.
2. How Central Banks Use Rate Hikes to Control Inflation
2.1 The Mechanism of Monetary Policy
Central banks influence inflation primarily through monetary policy tools. Rate hikes are part of tightening monetary policy, which affects the economy in several ways:
Borrowing Costs Increase: Higher interest rates make loans for businesses and consumers more expensive. This reduces spending on big-ticket items like houses, cars, and capital investments.
Savings Become Attractive: As banks offer higher returns on deposits, consumers may save more and spend less, reducing aggregate demand.
Currency Appreciation: Higher rates often attract foreign capital, strengthening the domestic currency. A stronger currency makes imports cheaper, which can reduce imported inflation.
Expectations Management: Rate hikes signal the central bank’s commitment to controlling inflation, which can influence wage negotiations, business pricing decisions, and consumer behavior.
2.2 Transmission Mechanism
The impact of rate hikes on inflation is not instantaneous. It passes through the economy via the interest rate transmission mechanism, which works through:
Credit channel: Expensive credit discourages borrowing.
Asset price channel: Rising rates reduce stock and real estate valuations, leading to lower wealth effect and reduced spending.
Exchange rate channel: Higher rates attract capital inflows, boosting the currency, reducing import costs, and easing inflation.
Typically, the full impact of a rate hike is observed over 12–24 months.
3. Types of Inflation and Rate Hikes
Not all inflation is the same, and the effectiveness of interest rate hikes depends on the source of inflation:
3.1 Demand-Pull Inflation
Occurs when aggregate demand exceeds supply.
Example: Booming economy with high consumer spending.
Rate hike effect: Very effective, as higher borrowing costs reduce spending.
3.2 Cost-Push Inflation
Occurs when production costs rise, e.g., due to higher wages, oil prices, or supply chain disruptions.
Rate hike effect: Less effective, as inflation is supply-driven rather than demand-driven.
3.3 Built-in Inflation
Caused by adaptive expectations, where past inflation influences future wage and price increases.
Rate hike effect: Moderate, but signaling by the central bank can anchor inflation expectations.
4. Historical Perspective on Rate Hikes and Inflation
Studying historical trends helps illustrate how interest rate adjustments influence inflation:
4.1 US Experience
1970s: Stagflation with double-digit inflation. The Fed raised rates sharply under Paul Volcker, with the federal funds rate peaking at ~20%. Inflation eventually came under control, but the economy experienced a severe recession.
2000s–2020s: Post-2008 financial crisis, rates were near zero to stimulate the economy. Inflation remained low, demonstrating that low rates don’t always trigger high inflation if other conditions (like excess capacity) persist.
4.2 Indian Experience
RBI uses repo rates to manage inflation, targeting CPI (Consumer Price Index) inflation around 4% ±2%.
Example: During 2010–2013, high food and fuel inflation prompted the RBI to raise repo rates to curb prices, stabilizing inflation over time.
4.3 Emerging Markets
Rate hikes in emerging markets often have the dual objective of controlling inflation and maintaining currency stability.
Over-tightening can trigger slowdowns, especially in economies with high debt levels.
5. Rate Hikes vs. Economic Growth
While rate hikes are effective in controlling inflation, they have trade-offs:
5.1 Impact on Investment
Higher borrowing costs reduce business investments in new projects.
Stock markets often react negatively, especially for high-debt sectors.
5.2 Impact on Consumers
Loans (housing, education, personal loans) become more expensive, reducing disposable income.
Luxury and discretionary spending decline.
5.3 Risk of Recession
Aggressive rate hikes can slow the economy too much, leading to contraction.
Policymakers must balance inflation control with growth sustainability.
6. Rate Hikes and Financial Markets
Financial markets react dynamically to rate hikes:
6.1 Stock Markets
Typically, rate hikes are bearish for equities as corporate profits may decline due to higher financing costs.
Growth stocks (tech) are more sensitive than value stocks.
6.2 Bond Markets
Bond prices fall as yields rise.
Investors shift to shorter-duration bonds during rate hike cycles.
6.3 Forex Markets
Domestic currency tends to strengthen as higher rates attract foreign capital.
This can impact export competitiveness but reduce import-driven inflation.
6.4 Commodities
Commodities priced in USD may decline as stronger currency reduces local demand.
Gold often falls during rate hikes because it doesn’t yield interest.
7. Rate Hikes in a Global Context
Interest rate policy in one country can influence others:
7.1 Spillover Effects
Higher US rates often lead to capital outflows from emerging markets.
Countries may raise rates in tandem to protect their currency and control inflation.
7.2 Global Inflation Trends
Oil prices, supply chain disruptions, and geopolitical events can override local rate hikes.
Central banks must consider global factors while adjusting rates.
8. Challenges in Managing Inflation Through Rate Hikes
8.1 Lag Effect
Monetary policy effects are delayed; policymakers often act based on inflation expectations rather than current data.
8.2 Supply-Side Constraints
Rate hikes cannot solve inflation caused by supply shortages or geopolitical disruptions.
8.3 Debt Burden
Economies with high corporate or household debt may be more sensitive to rate hikes, risking defaults.
8.4 Policy Communication
Miscommunication can destabilize markets. Clear forward guidance is crucial.
Conclusion
Interest rates and inflation are intricately linked. Rate hikes are a powerful tool to control inflation, but they come with trade-offs for growth, investment, and financial markets.
Key takeaways:
Rate hikes reduce demand and curb inflation but may slow growth.
Demand-pull inflation responds better to rate hikes than supply-driven inflation.
Timing, magnitude, and communication of rate hikes are crucial.
Global interdependencies mean domestic rate policy must consider international factors.
Investors and traders must adapt strategies in response to rate hikes, balancing risk and opportunity.
Ultimately, the goal of rate hikes is stability—stable prices, sustainable growth, and predictable financial markets. Policymakers walk a delicate tightrope, balancing inflation control with the need to foster economic activity, making the study of interest rates versus inflation an essential part of modern finance and economics.
Event-Driven Trading: Strategies Around Quarterly Earnings1. Understanding Event-Driven Trading
Event-driven trading refers to strategies that seek to exploit short-term price movements caused by corporate or macroeconomic events. These events can include mergers and acquisitions (M&A), regulatory announcements, dividend announcements, product launches, and, most notably, quarterly earnings reports. Event-driven traders operate on the principle that markets do not always price in the full implications of upcoming news, creating opportunities for alpha generation.
Earnings announcements are particularly potent because they provide concrete, quantifiable data on a company’s financial health, guiding investor expectations for revenue, profit margins, cash flow, and future outlook. Given the structured release schedule of quarterly earnings, traders can plan their strategies in advance, combining statistical, fundamental, and technical analyses.
2. Anatomy of Quarterly Earnings Reports
Quarterly earnings reports typically contain several key components:
Revenue and Earnings Per Share (EPS): Core indicators of company performance. Earnings surprises—positive or negative—often trigger substantial stock price moves.
Guidance: Management projections for future performance can influence market sentiment.
Margins: Gross, operating, and net margins indicate operational efficiency.
Cash Flow and Balance Sheet Metrics: Provide insight into liquidity, debt levels, and overall financial health.
Management Commentary: Offers qualitative insights into business strategy, risks, and opportunities.
Understanding these elements is critical for traders seeking to anticipate market reactions. Historically, stocks tend to exhibit heightened volatility during earnings releases, creating both opportunities and risks for traders.
3. Market Reaction to Earnings
The stock market often reacts swiftly to earnings announcements, with price movements reflecting the degree to which actual results differ from expectations. The reaction is influenced by several factors:
Earnings Surprise: The difference between actual earnings and analyst consensus. Positive surprises often lead to price spikes, while negative surprises can trigger sharp declines.
Guidance Changes: Upward or downward revisions to guidance significantly impact investor sentiment.
Sector Trends: A company’s performance relative to industry peers can amplify market reactions.
Market Conditions: Broader economic indicators and market sentiment affect the magnitude of earnings-driven price movements.
Traders must understand that markets may overreact or underreact initially, presenting opportunities for both short-term and medium-term trades.
4. Event-Driven Trading Strategies Around Earnings
4.1 Pre-Earnings Strategies
Objective: Position the portfolio ahead of anticipated earnings to profit from expected price movements.
Straddle/Strangle Options Strategy
Buy both call and put options with the same expiration (straddle) or different strike prices (strangle).
Profitable when stock exhibits significant volatility regardless of direction.
Works well when implied volatility is lower than expected post-earnings movement.
Directional Bets
Traders with conviction about earnings outcomes may take long or short positions in anticipation of the report.
Requires robust fundamental analysis and sector insights.
Pairs Trading
Involves taking offsetting positions in correlated stocks within the same sector.
Reduces market risk while exploiting relative performance during earnings season.
4.2 Post-Earnings Strategies
Objective: React to market inefficiencies created by unexpected earnings results.
Earnings Drift Strategy
Stocks that beat earnings expectations often continue to trend upward in the days following the announcement, known as the “post-earnings announcement drift.”
Conversely, negative surprises may lead to sustained declines.
Traders can exploit these trends using momentum-based techniques.
Volatility Arbitrage
Earnings reports increase implied volatility in options pricing.
Traders can exploit discrepancies between expected and actual volatility post-announcement.
Fade the Initial Reaction
Sometimes markets overreact to earnings news.
Traders take contrarian positions against extreme initial moves, anticipating a correction.
5. Analytical Tools and Techniques
Successful event-driven trading relies heavily on data, models, and analytical frameworks.
5.1 Fundamental Analysis
Study revenue, EPS, margins, guidance, and sector performance.
Compare against historical data and analyst consensus.
Evaluate macroeconomic factors affecting the company.
5.2 Technical Analysis
Identify key support and resistance levels.
Use indicators like Bollinger Bands, RSI, and moving averages to gauge price momentum pre- and post-earnings.
5.3 Sentiment Analysis
Monitor social media, news releases, and analyst reports for market sentiment.
Positive sentiment can amplify price moves, while negative sentiment can exacerbate declines.
5.4 Quantitative Models
Statistical models can predict probability of earnings surprises and subsequent price movements.
Machine learning algorithms are increasingly used to forecast earnings-driven volatility and trade outcomes.
6. Risk Management in Earnings Trading
Event-driven trading carries elevated risk due to volatility and uncertainty. Effective risk management strategies include:
Position Sizing
Limit exposure per trade to manage potential losses from unexpected moves.
Stop-Loss Orders
Predefined exit points prevent catastrophic losses.
Diversification
Spread trades across sectors or asset classes to reduce idiosyncratic risk.
Hedging
Use options or futures contracts to offset directional risk.
Liquidity Assessment
Ensure sufficient market liquidity to enter and exit positions without excessive slippage.
Conclusion
Event-driven trading around quarterly earnings offers substantial opportunities for informed traders. By combining fundamental analysis, technical tools, options strategies, and disciplined risk management, traders can capitalize on the predictable yet volatile nature of earnings season. While challenges exist, a structured and strategic approach allows market participants to profit from both anticipated and unexpected outcomes.
The key to success lies in preparation, flexibility, and understanding market psychology. Traders who master earnings-driven strategies can achieve consistent performance, turning periodic corporate disclosures into actionable investment opportunities.
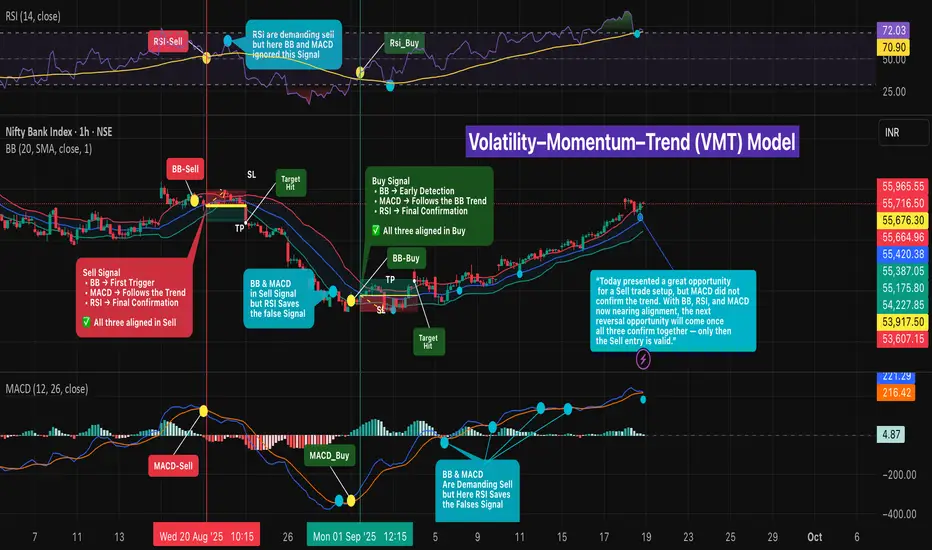
Volatility–Momentum–Trend (VMT) Model🔎 Intro / Overview
Three-indicator confirmation using Bollinger Bands (BB) , MACD , and RSI to align trend and price action.
BB often detects the move first (least lag), MACD follows the BB trend (mid reaction), and RSI confirms last (most lag).
This staged confirmation helps reduce false signals and keeps entries disciplined.
___________________________________________________________
📔 Concept
• Bollinger Bands (BB) → Early detector at volatility extremes.
– Buy : Price first moves outside the lower band , then a candle closes back above lower band → early bullish alert.
– Sell : Price first moves outside the upper band , then a candle closes back below upper band → early bearish alert.
• MACD → Momentum confirmer.
– Buy : MACD crossover above its signal line supports the bullish shift.
– Sell : MACD crossunder below its signal line supports the bearish shift.
• RSI → Final confirmation (filters traps).
– Buy : RSI crosses above its moving average, confirming bullish momentum.
– Sell : RSI crosses below its moving average, confirming bearish momentum.
✅ Only when BB + MACD + RSI all align in the same direction is the signal confirmed.
Notes:
- BB often reacts first (fastest, but prone to false starts).
- MACD provides mid-reaction confirmation.
- RSI lags but acts as the strongest filter against false trades.
Notes: Sometimes BB reacts immediately; MACD/RSI can prevent traps. At times BB+MACD demand a trade but RSI rejects (good filter); other times RSI demands but BB+MACD filter it.
___________________________________________________________
📌 How to Use
🔴 Sell Signal
1) BB: Price first extends outside upper band in an up-move, then a candle closes back under the upper band → BB sell signal.
2) MACD: Crossunder of MACD line below signal line.
3) RSI: RSI crosses below its moving average → final confirmation.
✅ All three aligned = Valid Sell.
🟢 Buy Signal
1) BB: Price first extends outside lower band in a down-move, then a candle closes back above the lower band → BB buy signal.
2) MACD: Crossover of MACD line above signal line.
3) RSI: RSI crosses above its moving average → final confirmation.
✅ All three aligned = Valid Buy.
___________________________________________________________
🎯 Trading Plan
• Entry → Only when all three confirm in the same direction.
• Stop Loss → - Stop-Loss → Near the structure swing that formed when BB first detected the signal (e.g., recent swing high for shorts / swing low for longs).
• Target → At least 1R ; scale/exit remainder using ATR, Fibonacci levels, or box trailing to ride trend.
___________________________________________________________
📊 Chart Explanation
Symbol/TF: BANKNIFTY · 1H
1) 20 Aug · 10:15 — SELL
• BB detected first, MACD mid-reaction (after ~2 candles), RSI confirmed last → Entry @ 55,676.30
• Target @ 55,387.05
• Stop-loss @ 55,965.55
• 🎯 Target hit on 22 Aug · 09:15 .
• Remaining lots can be trailed using ATR , Fibonacci levels , or Box Trailing to ride the extended trend
2) 29 Aug · 10:15 — FILTERED SELL
• BB and MACD demanded sell, but RSI did not confirm → No trade; RSI saved a false signal.
• 🦋 “The aqua dots represent false signals. At times, BB detects early entries but RSI and MACD do not confirm. Sometimes BB and MACD align, but RSI rejects the move. Other times BB and RSI confirm, yet MACD signals false. ✅ Only when all three align together is the signal valid.”
3) 01 Sep · 13:12 — BUY
• All three aligned long
• Entry @ 53,917.05
• Target @ 54,121.50
• Stop-loss @ 53,712.60
• 🎯 Target hit.
• Remaining lots can be trailed using ATR , Fibonacci levels , or Box Trailing to ride the extended trend
👉🏼 “A Sell setup looked promising today, but MACD did not confirm the trend ❌. With BB, RSI, and MACD now nearing alignment, the next reversal opportunity will be valid only when all three confirm together ✅.”
___________________________________________________________
👀 Observation
• BB provides the earliest cue; MACD validates momentum shift; RSI filters late-stage traps.
• Most reliable signals occur near key structure (support/resistance) with confluence.
• Not all alignments are equal—strength improves with decisive closes and supportive volume.
___________________________________________________________
❗ Why It Matters?
•A rule-based, three-step confirmation reduces noise and emotions.
•It clarifies when to enter , when to skip , and how to manage risk consistently across changing market conditions.
___________________________________________________________
🎯 Conclusion
BB → detect , MACD → follow , RSI → confirm .
When all three align, entries are clearer and risk is defined.
🔥 Patterns don’t predict. Rules protect. 🚀
___________________________________________________________
⚠️ Disclaimer
📘 For educational purposes only.
🙅 Not SEBI registered.
❌ Not a buy/sell recommendation.
🧠 Purely a learning resource.
📊 Not Financial Advice.
Part 3 Institutional Trading Role of Options in Hedging
Options are commonly used to hedge portfolios against adverse market movements:
Protective Put for Stocks: Investors holding equities can buy puts to protect against downside risks.
Portfolio Insurance: Institutions use options to safeguard large portfolios against market crashes.
Income Generation: Covered call writing allows long-term holders to earn additional income while maintaining exposure.
Hedging with options is especially popular in volatile markets where risk management is critical.
Pricing Models and Market Mechanics
Professional traders often rely on option pricing models, like the Black-Scholes model, to determine fair premiums. These models factor in:
Current price of the underlying asset
Strike price
Time to expiration
Volatility
Risk-free interest rate
Options markets operate through exchanges with standardized contracts. Market makers provide liquidity, and the bid-ask spread reflects supply-demand dynamics. In OTC markets, options can be customized to suit specific investor requirements.
Advantages of Options Trading
Leverage: Control a larger position for smaller capital.
Flexibility: Strategies for bullish, bearish, or neutral markets.
Hedging: Effective risk management tool.
Profit in Any Market: Can profit in rising, falling, or sideways markets with the right strategy.
Defined Risk (for Buyers): Limited to premium paid.
Challenges and Considerations
Complexity: Options require understanding of multiple factors affecting pricing.
Time Sensitivity: Options lose value as expiration nears.
Volatility Risk: Price swings can be unpredictable.
Liquidity Issues: Not all options have sufficient trading volume.
Psychological Pressure: Rapid movements and leverage can lead to emotional decisions.

Volatility Index (India VIX) Trading1. Introduction to Volatility and VIX
Volatility is the statistical measure of the dispersion of returns for a given security or market index. In simpler terms, it indicates how much the price of an asset swings, either up or down, over a period of time. Volatility can be driven by market sentiment, economic data, geopolitical events, or unexpected corporate announcements.
The India VIX, or the Volatility Index of India, is a real-time market index that represents the expected volatility of the Nifty 50 index over the next 30 calendar days. It is often referred to as the "fear gauge" because it tends to rise sharply when the market anticipates turbulence or uncertainty.
High VIX Value: Indicates high market uncertainty or expected large swings in Nifty.
Low VIX Value: Indicates low expected volatility, reflecting a stable market environment.
India VIX is calculated using the Black–Scholes option pricing model, taking into account the price of Nifty options with near-term and next-term expiry. This makes it a forward-looking indicator rather than a retrospective measure.
2. Significance of India VIX in Trading
India VIX is not a tradeable index itself but a crucial sentiment and risk gauge for traders. Its applications in trading include:
Market Sentiment Analysis:
Rising VIX indicates fear and uncertainty. Traders may reduce equity exposure or hedge portfolios.
Falling VIX suggests calm markets and often coincides with bullish trends in equity indices.
Risk Management:
Portfolio managers and traders use VIX levels to determine stop-loss levels, hedge sizes, and option strategies.
Predictive Insights:
Historical data shows that extreme spikes in VIX often precede market bottoms, and extremely low VIX levels may indicate complacency, often preceding corrections.
Derivative Strategies:
India VIX futures and options are actively traded, providing opportunities for hedging and speculative strategies.
3. How India VIX is Calculated
Understanding the calculation of VIX is essential for professional trading. India VIX uses a methodology similar to the CBOE VIX in the U.S., which focuses on expected volatility derived from option prices:
Step 1: Option Selection
Nifty call and put options with near-term and next-term expiries are chosen, typically out-of-the-money (OTM).
Step 2: Compute Implied Volatility
Using the prices of these options, the market’s expectation of volatility is derived through a modified Black–Scholes formula.
Step 3: Weighting and Smoothing
The implied volatilities of different strike prices are combined and weighted to produce a single expected volatility for the next 30 days.
Step 4: Annualization
The resulting number is annualized to reflect volatility in percentage terms, expressed as annualized standard deviation.
Key Point: India VIX does not predict the direction of the market; it only predicts the magnitude of expected moves.
4. Factors Influencing India VIX
India VIX moves based on a variety of market, economic, and geopolitical factors:
Market Events:
Sudden crashes or rallies in Nifty significantly affect VIX.
For example, a 2–3% overnight fall in Nifty can spike VIX by 10–15%.
Economic Data:
GDP growth announcements, inflation data, interest rate decisions, and corporate earnings influence volatility expectations.
Global Events:
US Fed decisions, crude oil volatility, geopolitical tensions (e.g., wars, sanctions) impact India VIX.
Market Liquidity:
During thin trading sessions or holidays in global markets, implied volatility in options rises, increasing VIX.
Investor Behavior:
Panic selling, FII flows, and retail sentiment shifts can drive VIX up sharply.
5. Trading Instruments Related to India VIX
While you cannot directly trade India VIX like a stock, several instruments allow traders to gain exposure to volatility:
5.1. India VIX Futures
Traded on NSE, futures contracts allow traders to speculate or hedge against volatility.
Futures are settled in cash based on the final India VIX value at expiry.
Contract months are usually current month and next two months, allowing short- to medium-term strategies.
5.2. India VIX Options
Like futures, VIX options are European-style options, cash-settled at expiry.
Traders can use calls and puts to bet on rising or falling volatility.
Options provide leveraged exposure, but risk is high due to volatility’s non-directional nature.
5.3. Equity Hedging via VIX
VIX can be used to structure protective strategies like buying Nifty puts or using collars.
When VIX is low, hedging costs are cheaper; when high, it is expensive.
6. Types of India VIX Trading Strategies
6.1. Directional Volatility Trading
Buy VIX Futures/Options when anticipating a sharp market drop or increased uncertainty.
Sell VIX Futures/Options when expecting market stability or a decrease in fear.
6.2. Hedging Equity Portfolios
Traders holding Nifty positions may buy VIX calls or futures to protect against sudden drops.
Example: If you hold long Nifty positions and expect a 1-week correction, buying VIX futures acts as an insurance.
6.3. Spread Trading
Calendar Spreads: Buy near-month VIX futures and sell next-month futures to profit from volatility curve changes.
Option Spreads: Buying a call spread or put spread on VIX options reduces risk while maintaining exposure to expected volatility moves.
6.4. Arbitrage Opportunities
Occasionally, disparities between VIX and realized volatility in Nifty options create arbitrage opportunities.
Advanced traders monitor mispricing to exploit short-term inefficiencies.
6.5. Mean Reversion Strategy
India VIX is historically mean-reverting. Extreme highs (>30) often come down, while extreme lows (<10) eventually rise.
Traders can adopt counter-trend strategies to capitalize on reversion toward the mean.
7. Risk Factors in VIX Trading
High Volatility:
While VIX measures volatility, the instrument itself is volatile. Sharp reversals can occur without warning.
Complex Pricing:
Futures and options on VIX depend on implied volatility, making pricing sensitive to market dynamics.
Liquidity Risk:
VIX options and futures have lower liquidity than Nifty, potentially leading to wider spreads.
Non-Directional Nature:
VIX measures magnitude, not direction. A rising market can spike VIX if the potential for sharp swings exists.
Event Risk:
Unexpected macroeconomic or geopolitical events can lead to sudden spikes.
8. Conclusion
India VIX trading is a highly specialized, nuanced field combining market sentiment analysis, technical skills, and risk management acumen. While it offers opportunities to profit from volatility and hedge equity exposure, it also carries substantial risks due to its non-linear, non-directional, and highly sensitive nature.
To succeed in India VIX trading, one must:
Understand the underlying calculation and drivers of volatility.
Combine VIX insights with market structure and macroeconomic analysis.
Adopt disciplined risk management practices, including stop-losses and position sizing.
Stay updated with global and domestic events impacting market sentiment.
For traders and investors, India VIX is more than a “fear gauge.” It is a strategic tool that provides a unique window into market psychology, enabling better-informed decisions in both trading and portfolio management.
The Rise of Retail Traders and the Influence of Social MediaIntroduction
The landscape of financial markets has undergone a profound transformation in recent years, driven by the convergence of technological advancements and the democratization of information. Central to this evolution is the rise of retail traders—individual investors who engage in trading activities traditionally dominated by institutional players. This shift has been significantly influenced by the pervasive reach of social media platforms, which have become pivotal in shaping investment behaviors, disseminating financial information, and fostering online trading communities.
The Emergence of Retail Traders
Historically, access to financial markets was primarily the domain of institutional investors, hedge funds, and high-net-worth individuals. However, the advent of online trading platforms, coupled with the proliferation of mobile technology, has lowered the barriers to entry for individual investors. Platforms like Robinhood, Zerodha, and Upstox have democratized access to trading by offering commission-free trades, user-friendly interfaces, and educational resources. This accessibility has led to a surge in retail trading activity, with platforms reporting significant increases in user sign-ups and trading volumes.
For instance, Robinhood reported that nearly 40% of 25-year-olds used investment accounts in 2024, a sharp rise from 6% in 2015
Investopedia
. Similarly, in India, the number of retail investors has seen exponential growth, with millions participating in equity markets for the first time.
Social Media: The New Financial Frontier
Social media platforms have emerged as influential channels for financial discourse, information dissemination, and community building. Platforms such as Reddit, Twitter (now X), TikTok, and YouTube have become hubs where financial news, investment strategies, and market analyses are shared in real-time. The accessibility and immediacy of these platforms have empowered retail traders to make informed decisions, often in collaboration with like-minded individuals.
A notable example is Reddit's r/WallStreetBets community, where members engage in discussions about high-risk trading strategies, share investment insights, and collectively influence market movements. The GameStop short squeeze in early 2021 exemplified the power of social media in mobilizing retail traders to challenge institutional investors, leading to unprecedented volatility in the stock's price
TIME
.
The Role of Financial Influencers (Finfluencers)
The rise of social media has also given birth to a new class of financial content creators known as "finfluencers." These individuals leverage their online presence to share investment tips, market analyses, and trading strategies with their followers. While some finfluencers provide valuable insights, others may promote high-risk investments or products without adequate disclosures, raising concerns about the quality and reliability of financial advice available online
Financial Times
.
The influence of finfluencers is amplified by their ability to reach large audiences quickly and the trust that followers place in their recommendations. This dynamic has led to instances where retail traders, influenced by social media content, make investment decisions that may not align with traditional financial principles, potentially exposing them to increased risks.
Behavioral Implications and Market Dynamics
The integration of social media into trading practices has introduced new behavioral dynamics among retail traders. The constant flow of information, coupled with the desire for quick financial gains, can lead to impulsive decision-making and herd behavior. Retail traders may be swayed by trending stocks or viral content, often disregarding fundamental analyses.
Studies have shown that social media discussions can significantly influence investor sentiment and trading volumes. For example, the volume of comments and discussions on platforms like Reddit has been correlated with subsequent stock price movements, indicating that collective online sentiment can impact market dynamics
arXiv
.
Moreover, the phenomenon of "upward social comparison"—where individuals compare their financial achievements with those of others—can lead to increased risk-taking and trading activity. Investors exposed to peers' successes may feel compelled to emulate similar strategies, sometimes without fully understanding the associated risks
Nature
.
Regulatory Challenges and Misinformation
The rapid growth of retail trading and the pervasive influence of social media have posed significant challenges for regulators. The decentralized nature of information dissemination on social platforms makes it difficult to monitor and control the spread of misinformation, fraudulent schemes, and manipulative practices.
Regulatory bodies in various countries have begun to address these challenges by implementing measures to enhance transparency and protect investors. For instance, the UK's Financial Conduct Authority has introduced regulations under the Financial Promotions Regime to combat misleading financial content and has prosecuted violators
Financial Times
.
In India, the Securities and Exchange Board of India (SEBI) has issued advisories cautioning investors about the risks associated with financial influencers and the potential for deepfake videos to mislead investors
Reuters
. These efforts highlight the need for a balanced approach that fosters innovation while safeguarding investor interests.
The Future of Retail Trading and Social Media
Looking ahead, the intersection of retail trading and social media is poised to continue evolving. Advancements in artificial intelligence, machine learning, and data analytics are expected to further personalize trading experiences, offering tailored recommendations and predictive insights to individual investors.
Simultaneously, the role of social media in shaping market trends will likely intensify, with platforms developing more sophisticated tools to facilitate trading and investment discussions. The integration of social features into trading platforms, such as Robinhood's "Robinhood Social," exemplifies this trend by allowing users to follow and emulate successful traders in real-time
Investopedia
.
However, as the influence of social media grows, so too does the responsibility of platforms, influencers, and regulators to ensure that retail traders have access to accurate, reliable, and ethical financial information. The future of retail trading will depend on striking a balance between innovation, education, and regulation to create a sustainable and equitable financial ecosystem.
Conclusion
The rise of retail traders, fueled by the pervasive influence of social media, has transformed the financial landscape, democratizing access to trading and investment opportunities. While this shift has empowered individual investors, it has also introduced new challenges related to information reliability, behavioral biases, and regulatory oversight.
As the financial ecosystem continues to evolve, it is imperative for stakeholders—including investors, influencers, platforms, and regulators—to collaborate in fostering an environment that promotes informed decision-making, ethical practices, and financial literacy. By doing so, the potential of retail traders can be harnessed to contribute positively to the broader financial markets, ensuring that the benefits of this transformation are realized in a responsible and sustainable manner.
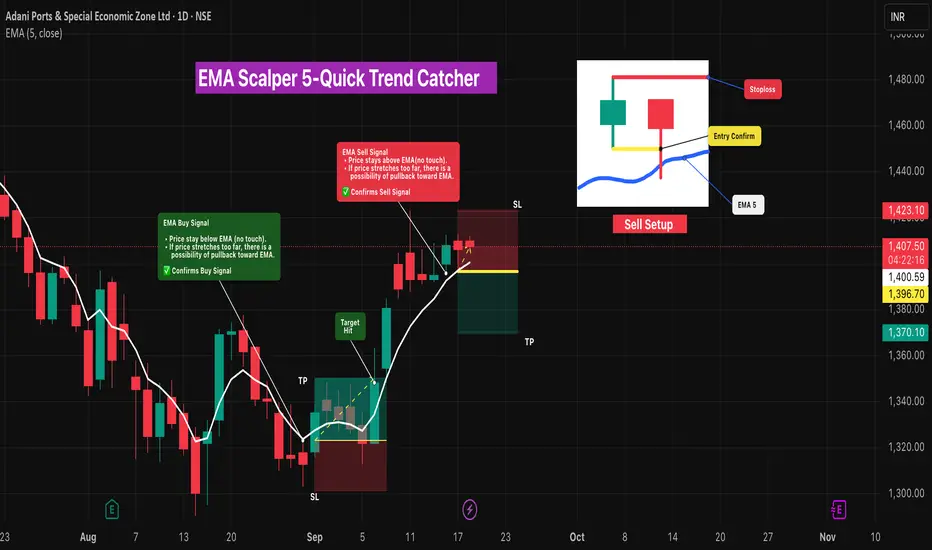
EMA Scalper 5-Quick Trend Catcher🔎 Intro / Overview
This idea uses a single EMA (Length 5) as a trend confirmation tool.
- When price stays below EMA (no touch), it signals bullish continuation.
- When price stays above EMA (no touch), it signals bearish continuation.
If price stretches too far from EMA, expect a possible pullback toward the line.
This EMA Scalping Strategy focuses on quick entries and exits 🎯.
- Best suited for intraday scalping where small, quick moves are captured. ⚡
___________________________________________________________
📌 How to Use
- In a downtrend , when price stays far below EMA(5) with no touch, then the next candle breaks the previous high → immediate Buy entry .
- In an uptrend , when price stays far above EMA(5) with no touch, then the next candle breaks the previous low → immediate Sell entry .
- EMA acts as a fast trend filter, confirming momentum while defining risk–reward levels.
- Once the signal is confirmed, entry is validated only if the next candle breaks the price level — otherwise, the signal is devalidated.
___________________________________________________________
🎯 Trading Plan
- Entry → When the next candle breaks the previous candle’s high , enter long (for immediate Buy).
- Stoploss → Swing Low for Buy / Swing High for Sell.
- Target → 1R (equal to stop distance).
___________________________________________________________
📊 Chart Explanation
ADANIPORTS
1️⃣ Buy Signal →
- Entry @ 1323.15
- Stoploss @ 1301.40
- Target @ 1345.70 → 🎯 Target Hit
2️⃣ Sell Signal →
- Entry @ 1396.70
- Stoploss @ 1423.10
- Target @ 1470.10
Trade continue in live
___________________________________________________________
👀 Observation
- EMA(5) gives fast and responsive trend signals.
- Works best in strong trending markets.
- False signals may occur in choppy sideways markets — use structure confirmation.
___________________________________________________________
❗ Why It Matters?
- Provides clear Buy/Sell confirmation with less lag.
- Defines structured entry, SL, and TP rules.
- Simple, rule-based system to avoid emotional trading.
___________________________________________________________
🎯 Conclusion
The EMA(5) Signal Strategy is a simple yet effective way to confirm trend and capture moves.
By combining breakout entries with disciplined SL/TP, traders can maintain risk–reward balance and trail winners effectively.
🔥 Patterns don’t predict. Rules protect. 🚀
___________________________________________________________
⚠️ Disclaimer
📘 For educational purposes only.
🙅 Not SEBI registered.
❌ Not a buy/sell recommendation.
🧠 Purely a learning resource.
📊 Not Financial Advice.
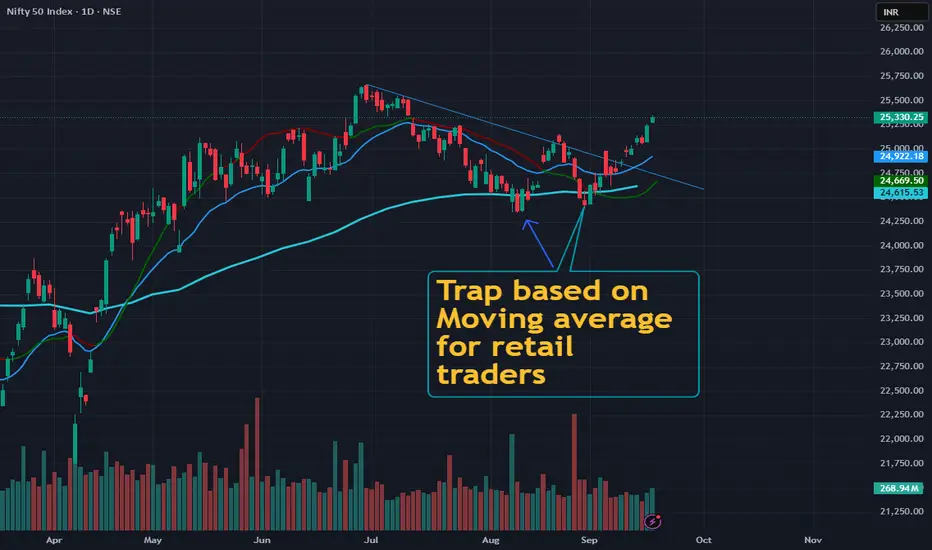
Why Most Traders Stay Average: The Comfort Trap[ Most traders treat moving averages like magic buy/sell buttons.
That’s not how professionals think .
A moving average is a map of trend + structure, not a trading signal.
❌ The Retail Mistake
Buying when price crosses above
Selling when price crosses below.
Blindly trusting “golden cross” or “death cross.”
👉 Result: Whipsaws, fake entries, frustration.
✅ The Pro Mindset
Trend filter: Are we in uptrend (above MA), downtrend (below MA), or chop (whipsaw around MA)?
Dynamic support/resistance: Does price respect the MA and bounce, or reject and break?
Mean reversion tool: If price stretches too far from the MA, expect it to snap back.
📊 In this NIFTY 50 chart:
April–June → Price rode the 50MA upward (dynamic support).
July–Aug → Price broke below → MA flipped into resistance.
Now → Price reclaiming above → shows buyers regaining control.
🎯 How You Can Use This
Use a 20/50/200 MA to filter trend → trade in the direction of bias.
Use MAs as areas of interest, not entry triggers. Wait for price reaction.
Don’t predict → let context confirm.
👉 Moving averages don’t predict. They contextualize.
Stop asking them for signals. Start using them as maps.
💡 Save this. Follow for daily trader mindset + real education — no fluff.
PCR Tradng StrategiesTypes of Options Strategies
Options strategies can be classified based on complexity and purpose:
A. Basic (Beginner) Strategies
Covered Call
Protective Put
Long Call / Long Put
B. Intermediate Strategies
Bull Call Spread
Bear Put Spread
Collar Strategy
Straddle and Strangle
C. Advanced (Professional) Strategies
Butterfly Spread
Iron Condor
Calendar Spread
Ratio Spreads
Diagonal Spreads
Each of these strategies has its own setup, payoff diagram, and risk–reward profile. Let’s explore the most important ones.
Popular Options Strategies Explained with Examples
Covered Call
Setup: Buy stock + Sell Call option (same stock).
When to Use: Mildly bullish or neutral view.
Logic: You earn premium from the call while holding stock. If stock rises, gains are capped at strike price.
Example: Stock at ₹100. Buy stock and sell a Call at strike ₹110 for ₹5. If stock goes to ₹115, your profit is capped at ₹15 (₹10 from stock + ₹5 premium). If stock stays flat, you still keep the ₹5 premium.
Protective Put
Setup: Buy stock + Buy Put option.
When to Use: Bullish but want downside protection.
Logic: Works like insurance—limits potential loss if stock falls.
Example: Stock at ₹100. Buy stock + Put at strike ₹95 for ₹3. If stock drops to ₹80, your loss is capped (you can sell at ₹95).

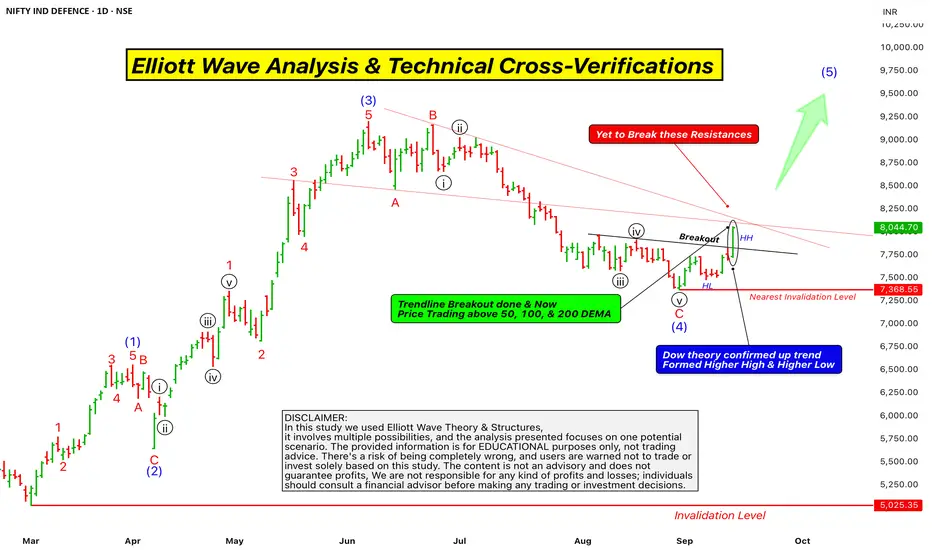
Elliott Wave Analysis & Technical Cross-VerificationsHello Friends, Welcome to RK_Chaarts,
Today, we're going to learn how to validate our Elliott Wave analysis by identifying additional factors that support our directional bias. Once we've plotted our Elliott Wave counts and identified a direction, we want to confirm whether other technical indicators and patterns align with our analysis. This helps strengthen our conviction in our directional bias and provides additional confidence in our trading decisions. Today, we'll explore some key points, including Elliott Wave theory, Exponential moving averages, Trend line breakouts, and Invalidation levels, as well as projected targets. And please note that this post is shared solely for educational purposes. It is not a trading idea, tip, or advisory. This is purely an Educational post.
Elliott Wave Theory structure & wave Counts
Here chart we are using Nifty India Defence sector, which is an index chart. We are analyzing it using Elliott Wave theory. It's very clear that from the March 2025 bottom, we've identified a clear Wave (1) Wave (2) Wave (3) and Wave (4) and now we've started Wave (5) of Intermediate degree in Blue.
Projections of wave (5)
According to the theory, the projected target for Wave (5) is typically between 123% to 161.8% of the length of Wave (4). So, we can at least assume that the price will reach 123% of Wave (4)’s length, and the price will move higher from here.
Trendline Breakout
The trend line breakout also confirms this. Since Wave (4) moved downwards, Wave (5) should move upwards, indicating a potential upward movement in price. This is a positive signal and a possibility.
Dow Theory confirmation of Trend changed
Additionally, we can see that in the daily time frame, the price has recently completed Wave (4) and formed a higher high, followed by a higher low, and then another higher high, along with a trend line breakout, which we've marked with a rounded ellipse on candle on the chart.
According to Dow theory, this formation of higher highs and higher lows, along with the trend line breakout, indicates that the index has the strength to break through resistance. These two factors strongly support our Elliott Wave projection, which suggests that the price will move upwards. The chart is looking bullish, indicating that a swing has been activated upwards from here.
Exponential Moving Averages
Furthermore, we can see that the price is trading above the 50-day exponential moving average (EMA) in the daily time frame, as well as above the 100-day EMA and the 200-day EMA. These three EMAs are major indicators, and the price is sustaining above all of them. This is also a very good positive sign that supports our view and this scenario.
Supporting Indicators
MACD
RSI
Some Hurdles to cross yet
Finally, we can see that the Zero B trend line, which is coming down from the top, has not been crossed by the price yet, and there has been no breakout. Additionally, we have drawn a trend line connecting the high of the third wave and the low of the fourth wave, which initially acted as resistance and later as support. This trend line is also approaching the same level as the Zero B trend line. So, we have two resistances converging at the same point, which the price has yet to break out of.
This could potentially be a hurdle, and it's possible that according to the Elliott Wave count, Wave (5) will arrive with five sub-divisions, which could lead to a retest of the previous trend line or a Retracement before moving further upwards.
Invalidation Level
According to Elliott Wave theory, the nearest invalidation level is the low of Wave (4), which is currently at 7368, and this level should not be breached. If it is, it will lead to a lower low, which would be an invalidation of the Elliott Wave count.
Overall, the chart of this index looks very promising and bullish. As we all know, the market can be unpredictable, but if this invalidation level is not triggered and the price doesn't break down, then the chart may move upwards with strength. This entire analysis that we discussed is for the Nifty India Defense index chart. Please note that this is not a trading tip or advice, but rather an educational perspective that we shared. Also, keep in mind that the Nifty Defense index is not tradable, but it does provide insight into the market's direction.
This post is shared purely for educational purpose & it’s Not a trading advice.
I am not Sebi registered analyst.
My studies are for educational purpose only.
Please Consult your financial advisor before trading or investing.
I am not responsible for any kinds of your profits and your losses.
Most investors treat trading as a hobby because they have a full-time job doing something else.
However, If you treat trading like a business, it will pay you like a business.
If you treat like a hobby, hobbies don't pay, they cost you...!
Hope this post is helpful to community
Thanks
RK💕
Disclaimer and Risk Warning.
The analysis and discussion provided on in.tradingview.com is intended for educational purposes only and should not be relied upon for trading decisions. RK_Chaarts is not an investment adviser and the information provided here should not be taken as professional investment advice. Before buying or selling any investments, securities, or precious metals, it is recommended that you conduct your own due diligence. RK_Chaarts does not share in your profits and will not take responsibility for any losses you may incur. So Please Consult your financial advisor before trading or investing.
Part 2 Candle Stick PatternKey Terminologies in Option Trading
To understand options, you must master the vocabulary:
Strike Price → Pre-decided price where option can be exercised.
Premium → Price paid by the option buyer to the seller.
Expiry Date → Last day the option can be exercised.
In-the-Money (ITM) → Option already has intrinsic value.
At-the-Money (ATM) → Strike price is equal to current market price.
Out-of-the-Money (OTM) → Option has no intrinsic value.
Lot Size → Options are traded in lots, not single shares. For example, Nifty lot = 50 units.
How Option Pricing Works
Options are not priced arbitrarily. The premium has two parts:
Intrinsic Value (IV)
The real value if exercised now.
Example: Nifty at 20,200, call strike 20,100 → IV = 100 points.
Time Value (TV)
Extra value due to remaining time before expiry.
Longer expiry = higher premium because of greater uncertainty.
Option pricing is influenced by:
Spot price of underlying
Strike price
Time to expiry
Volatility
Interest rates
Dividends
The famous Black-Scholes Model and Binomial Model are widely used to calculate theoretical prices.
Greeks and Risk Management
Every option trader must understand Greeks, the risk measures that show sensitivity of option price to different factors:
Delta → Measures how much the option price changes if underlying moves 1 unit.
Gamma → Measures how delta itself changes with price movement.
Theta → Time decay; how much premium falls as expiry nears.
Vega → Sensitivity to volatility. Higher volatility increases premium.
Rho → Sensitivity to interest rates.
Greeks allow traders to hedge portfolios and adjust positions dynamically.
Strategies in Option Trading
Options shine because you can combine calls, puts, and different strikes to create unique strategies.
Directional Strategies
Buying Call → Bullish play.
Buying Put → Bearish play.
Covered Call → Own stock + sell call → generates income.
Protective Put → Own stock + buy put → insurance.
Neutral Market Strategies
Straddle → Buy call + put at same strike → profit from big moves either way.
Strangle → Buy OTM call + OTM put → cheaper version of straddle.
Iron Condor → Sell OTM call and put spreads → profit if market stays in range.
Advanced Plays
Butterfly spread, calendar spread, ratio spreads – for experienced traders.

Intraday Trading Tips1. Understanding Intraday Trading
Before diving into tips, let’s understand what intraday trading means.
Definition: Intraday trading involves buying and selling financial instruments—stocks, futures, options, or currencies—within the same trading session.
Objective: Profit from short-term price fluctuations.
Settlement: All open positions must be squared off before market close.
Leverage: Traders often use margin (borrowed money) to maximize gains, but this also increases risks.
For example: If you buy 100 shares of Reliance at ₹2,450 in the morning and sell them at ₹2,480 by afternoon, your profit is ₹3,000 (excluding brokerage).
2. Why Intraday Trading Attracts Traders
Quick profits: No need to wait for years like investors.
Leverage advantage: Small capital can control large trades.
Liquidity: You trade highly liquid stocks that allow easy entry/exit.
No overnight risk: Positions close before the market shuts.
However, the risks are equally high—overtrading, market volatility, and emotional decisions can wipe out capital quickly.
3. Golden Intraday Trading Tips
Tip 1: Choose the Right Stocks
Not all stocks are suitable for intraday trading.
Prefer liquid stocks (e.g., Reliance, Infosys, HDFC Bank).
Avoid penny stocks with low volumes.
Track stocks in the Nifty 50 and Bank Nifty basket—they have strong daily movement.
Look for stocks that follow market trends and are backed by news, earnings, or events.
Example: A stock with daily volume above 10 lakh shares is generally liquid enough for intraday trading.
Tip 2: Trade with a Plan
Trading without a plan is like sailing without a compass. Define:
Entry price – When to buy or sell.
Exit price – Where to book profits.
Stop-loss – How much you are ready to lose if the market goes against you.
A simple 2:1 risk-reward ratio is ideal. If you risk ₹1,000, target ₹2,000 profit.
Tip 3: Learn Technical Analysis
Intraday trading depends more on charts than company fundamentals.
Use candlestick patterns (Doji, Hammer, Engulfing).
Apply moving averages (50-day, 200-day) to spot trends.
Watch RSI (Relative Strength Index) for overbought/oversold zones.
Check Volume Profile to confirm momentum.
Example: If a stock breaks above a resistance level with high volume, it signals a potential intraday buying opportunity.
Tip 4: Follow Market Trend
“The trend is your friend.”
If the market is bullish, focus on buy opportunities.
If bearish, focus on short-selling opportunities.
Avoid going against the broader market trend.
Intraday traders often use Nifty and Bank Nifty movement as indicators of overall sentiment.
Tip 5: Use Stop Loss Religiously
The most important tool in intraday trading.
Decide in advance how much loss you can tolerate.
Place stop-loss orders immediately after entering a trade.
This prevents panic selling and large losses.
Example: Buy at ₹500, set stop-loss at ₹490. If the stock falls, you exit automatically, limiting loss.
Tip 6: Don’t Trade on Emotions
Greed and fear are the biggest enemies.
Avoid “revenge trading” after a loss.
Don’t chase stocks just because they are moving fast.
Stick to your trading plan, not your emotions.
Tip 7: Timing Matters
First 15 minutes after market opens = high volatility. Wait and observe.
Best trading hours: 9:30 AM to 11:30 AM and 1:30 PM to 2:30 PM.
Avoid trading just before market close unless you are squaring off.
Tip 8: Don’t Overtrade
Trading too many stocks at once increases confusion.
Focus on 2–3 quality trades per day.
Avoid random entry and exit without reason.
Remember: Fewer quality trades > Many random trades.
Tip 9: Keep Learning from Market News
Earnings results, RBI policy, crude oil prices, inflation data—all impact intraday trends.
Use reliable sources like Bloomberg, Moneycontrol, NSE updates.
Avoid tips from WhatsApp or Telegram groups without proper analysis.
Tip 10: Maintain Trading Discipline
Follow your rules strictly.
Keep a trading journal: Note entries, exits, reasons for trade, and results.
Review mistakes and improve.
4. Intraday Trading Strategies
Apart from general tips, let’s look at popular intraday strategies:
Breakout Trading: Enter when price breaks a strong support or resistance.
Momentum Trading: Buy rising stocks with strong volume, sell falling ones.
Scalping: Make multiple small trades for tiny profits.
Gap Trading: Trade based on price gaps at market opening.
Moving Average Crossover: Buy when short-term MA crosses above long-term MA, and vice versa for selling.
5. Risk Management in Intraday Trading
Without risk management, even the best trader will fail.
Never risk more than 1–2% of your capital per trade.
Diversify trades instead of betting everything on one stock.
Use proper leverage—don’t borrow excessively.
Conclusion
Intraday trading can be profitable, exciting, and rewarding, but it demands discipline, knowledge, and patience. Following intraday trading tips like choosing liquid stocks, sticking to stop-loss, respecting market trends, and avoiding emotions can make a big difference between success and failure.
Remember: In trading, survival is more important than speed. If you protect your capital and manage risks well, profits will follow.
Market Rotation Strategies in Trading1. Introduction to Market Rotation
Market rotation is the process of moving capital from one asset class, sector, or stock to another based on changes in market conditions. Unlike traditional buy-and-hold investing, market rotation seeks to exploit relative performance trends between different sectors or industries.
1.1 Why Market Rotation Matters
Markets are cyclical in nature. Economic growth, inflation, interest rates, and geopolitical factors influence the performance of sectors differently. For example:
During an economic expansion, cyclical sectors like technology, consumer discretionary, and industrials often outperform.
During economic slowdowns, defensive sectors such as utilities, healthcare, and consumer staples typically maintain stability.
By rotating capital into sectors expected to outperform at a given stage of the economic or market cycle, traders can maximize returns while reducing exposure to underperforming sectors.
1.2 Market Rotation vs. Sector Rotation
Although often used interchangeably, there is a subtle difference:
Market Rotation: A broader approach, including shifts between asset classes (stocks, bonds, commodities, currencies) based on economic and market conditions.
Sector Rotation: A subset of market rotation, focusing specifically on shifts between sectors within the equity market.
2. Theoretical Foundations of Market Rotation
Market rotation strategies are grounded in several financial theories:
2.1 Economic Cycle Theory
The economic cycle—expansion, peak, contraction, and trough—directly affects sector performance:
Economic Phase Sectors Likely to Outperform
Early Expansion Technology, Consumer Discretionary, Industrials
Mid Expansion Financials, Energy, Materials
Late Expansion Consumer Staples, Utilities, Healthcare
Recession Bonds, Gold, Defensive Stocks
By understanding these phases, traders can preemptively rotate positions to capitalize on changing economic conditions.
2.2 Relative Strength Theory
Relative strength compares a sector or stock’s performance to the broader market or another sector. Traders often rotate capital from weak sectors to strong sectors based on relative strength indicators:
RSI (Relative Strength Index)
Price momentum
Moving averages crossovers
2.3 Intermarket Analysis
Intermarket analysis studies correlations between markets (e.g., bonds vs. stocks, commodities vs. equities). For instance, rising bond yields often hurt utility stocks but benefit financials, signaling potential rotation opportunities.
3. Types of Market Rotation Strategies
Traders employ different approaches depending on their objectives, time horizon, and risk tolerance:
3.1 Sector Rotation
Definition: Shifting capital between sectors expected to outperform.
Example: Rotating from technology to consumer staples during a market slowdown.
Tools Used: Sector ETFs, mutual funds, and sector indices.
3.2 Style Rotation
Definition: Shifting between investment styles, such as growth vs. value, or small-cap vs. large-cap stocks.
Example: Rotating from growth stocks to value stocks as interest rates rise.
Tools Used: Factor-based ETFs, style-specific indices.
3.3 Asset Class Rotation
Definition: Shifting capital between stocks, bonds, commodities, and currencies based on market conditions.
Example: Moving from equities to gold during high inflation periods.
Tools Used: ETFs, futures, and mutual funds.
3.4 Geographic Rotation
Definition: Rotating investments between different regions or countries.
Example: Allocating capital from emerging markets to developed markets during global risk-off periods.
Tools Used: International ETFs, ADRs, country indices.
4. Practical Steps in Implementing Market Rotation Strategies
Executing a market rotation strategy involves multiple steps:
4.1 Macro-Economic Analysis
Monitor key indicators: GDP growth, inflation, interest rates, unemployment, and central bank policies.
Identify which sectors historically outperform under current conditions.
4.2 Sector and Stock Selection
Use technical and fundamental analysis to identify strong and weak sectors.
Tools:
Sector performance charts
Relative strength indicators
Earnings growth rates
P/E ratios
4.3 Timing the Rotation
Use technical signals like moving averages, RSI, MACD, or Bollinger Bands to determine entry and exit points.
Monitor market sentiment indicators (e.g., VIX) to gauge risk appetite.
4.4 Risk Management
Diversify across sectors to reduce concentration risk.
Use stop-losses to limit downside exposure.
Maintain liquidity to quickly rotate positions as conditions change.
4.5 Execution
ETFs are commonly used for rapid rotation between sectors.
For active traders, individual stocks or futures contracts offer higher precision but require more monitoring.
5. Tools and Indicators for Market Rotation
Market rotation relies on both fundamental and technical analysis tools:
5.1 Technical Indicators
RSI (Relative Strength Index): Identifies overbought and oversold conditions.
MACD (Moving Average Convergence Divergence): Detects trend reversals.
Momentum Indicators: Track the speed of price movement.
Moving Averages: Identify trends and crossovers signaling rotation opportunities.
5.2 Fundamental Indicators
Earnings Growth: Sectors with improving earnings tend to outperform.
Valuation Ratios: P/E, P/B, and dividend yields help identify undervalued sectors.
Economic Sensitivity: Classify sectors as cyclical or defensive.
5.3 Intermarket Relationships
Track correlations between interest rates, commodity prices, and equities.
Example: Rising oil prices may benefit energy sectors but hurt consumer discretionary.
6. Examples of Market Rotation Strategies
6.1 Historical Sector Rotation Example
Scenario: 2020-2021 pandemic recovery.
Early recovery: Technology and healthcare stocks outperformed due to remote work and healthcare demand.
Later stages: Cyclical sectors like travel, industrials, and energy gained momentum as economic activity normalized.
6.2 Interest Rate-Based Rotation
Rising rates often hurt high-growth tech stocks.
Traders may rotate into financials or energy stocks, which benefit from rising rates.
6.3 Commodity-Driven Rotation
Rising commodity prices benefit sectors like energy, materials, and industrials.
Traders can rotate into these sectors during commodity booms and shift out during declines.
Conclusion
Market rotation strategies offer traders and investors a systematic approach to navigating dynamic markets. By understanding macroeconomic cycles, relative sector performance, and technical indicators, traders can rotate capital effectively to capture gains while minimizing losses. Though it requires skill, discipline, and constant monitoring, a well-executed rotation strategy can significantly enhance portfolio performance, particularly in volatile or uncertain markets.
In essence, market rotation is a dynamic, proactive, and informed approach to trading, combining the insights of economic cycles with the precision of technical analysis. It transforms passive investing into an active strategy designed to exploit trends, cycles, and relative performance patterns—making it a cornerstone technique for sophisticated traders and portfolio managers.
Private and Public Banks: Their Role in Trading1. Understanding Private and Public Banks
1.1 Public Banks
Definition: Banks owned or majorly controlled by governments.
Examples: State Bank of India (SBI), Bank of Baroda, Punjab National Bank, and international giants like China Development Bank or Germany’s KfW.
Role: Support trade finance, infrastructure, and developmental goals while also operating commercially.
Trust Factor: Often seen as safer due to government backing.
1.2 Private Banks
Definition: Banks owned by private individuals or institutions, focused on maximizing profits.
Examples: HDFC Bank, ICICI Bank, Axis Bank, JPMorgan Chase, Goldman Sachs, HSBC (though HSBC has mixed ownership).
Role: More aggressive in expanding into global markets, offering innovative trading products, and catering to high-net-worth individuals and corporates.
2. Banking as a Foundation for Trading
Both types of banks serve as pillars of the trading ecosystem. Their activities include:
Providing Liquidity: Banks buy and sell financial instruments, ensuring markets don’t dry up.
Market Making: Many large banks act as intermediaries in forex and derivatives trading.
Credit Access: Traders and corporations rely on bank credit to fund positions.
Clearing & Settlement: Banks ensure smooth processing of trades through clearinghouses.
Risk Management: Offering hedging tools, swaps, options, and forward contracts.
3. Role of Public Banks in Trading
Public banks play a dual role: stabilizing markets while also enabling participation in global trading.
3.1 Trade Finance
Provide letters of credit (LCs) and bank guarantees for exporters/importers.
Ensure trust in international trade transactions.
3.2 Forex Market Interventions
Act on behalf of central banks to stabilize currency markets.
Support importers by ensuring adequate foreign exchange availability.
3.3 Developmental Trading Role
Encourage financing of essential commodities (oil, wheat, fertilizers).
Maintain food and energy security through commodity trade funding.
3.4 Example: State Bank of India (SBI)
India’s largest public bank actively supports exporters through concessional finance.
Plays a key role in rupee-dollar trade settlement, enhancing India’s presence in global forex.
3.5 Strengths of Public Banks in Trading
Government backing ensures trust and credibility.
Ability to fund large-scale infrastructure trading projects.
Acts as a stabilizer during financial crises.
4. Role of Private Banks in Trading
Private banks are more aggressive and profit-oriented, often setting trends in trading innovations.
4.1 Active Participation in Global Markets
Private banks like JPMorgan, Goldman Sachs, Barclays are market leaders in forex, commodities, and equity trading.
Operate investment banking arms specializing in derivatives, structured products, and electronic trading platforms.
4.2 Wealth Management and Private Banking Services
Offer exclusive access to equity trading, hedge funds, and forex products for wealthy clients.
Provide advisory services to optimize portfolio exposure to global markets.
4.3 Technological Edge
Private banks are pioneers in algorithmic trading and high-frequency trading (HFT).
Platforms like HDFC Securities, ICICI Direct offer retail access to stock markets.
4.4 Example: Goldman Sachs
Dominates derivatives and commodities markets.
Provides structured financing deals for corporations to hedge against risks.
4.5 Strengths of Private Banks in Trading
Innovation-driven, offering sophisticated trading products.
Higher efficiency and faster adoption of fintech.
Wider global presence compared to many public banks.
5. Comparative Roles of Public vs Private Banks in Trading
Aspect Public Banks Private Banks
Ownership Government Private shareholders
Risk Appetite Conservative, stability-driven Aggressive, profit-driven
Innovation Moderate High (HFT, derivatives, fintech)
Global Trading Role Primarily support trade finance and forex Market leaders in derivatives, equities, commodities
Trust Factor Strong due to state backing Strong brand but vulnerable in crises
Client Base Mass market, corporates, governments High-net-worth individuals, institutions, corporates
6. Contribution to Different Types of Trading
6.1 Equity Trading
Public Banks: Generally less active in proprietary equity trading but support retail and institutional participation.
Private Banks: Major global equity traders, offering brokerage, research, and portfolio management.
6.2 Forex Trading
Public Banks: Assist central banks in intervention and stabilize exchange rates.
Private Banks: Global market makers, driving trillions of dollars in daily forex transactions.
6.3 Commodity Trading
Public Banks: Finance essential imports like crude oil and food grains.
Private Banks: Dominate speculative trading in oil, gold, and agricultural futures.
6.4 Derivatives & Structured Products
Public Banks: Use derivatives mainly for hedging national interests.
Private Banks: Innovate complex structured products, options, swaps, and exotic derivatives.
7. Challenges Faced by Public and Private Banks in Trading
7.1 Public Banks
Political interference in lending and trade financing.
Slower adoption of new technologies.
Higher burden of non-performing assets (NPAs).
7.2 Private Banks
Higher exposure to speculative risks.
Vulnerable to global financial shocks (e.g., Lehman Brothers collapse).
Criticism for prioritizing profit over public interest.
8. The Changing Landscape: Fintech and Digital Trading
Both public and private banks are facing disruption from fintechs:
Digital trading apps (Zerodha, Robinhood, Groww) are reducing dependency on banks for stock trading.
Still, banks remain indispensable for clearing, settlement, large-scale financing, and providing credibility.
Public banks are slowly catching up with digitization, while private banks continue to push boundaries with AI-driven trading systems.
Conclusion
The roles of public and private banks in trading are complementary rather than competitive. Public banks provide stability, credibility, and developmental support, while private banks bring innovation, speed, and global connectivity. Together, they form the backbone of the international trading ecosystem.
As trading becomes more globalized, technology-driven, and interconnected, both public and private banks will need to adapt rapidly. The future will likely see a hybrid financial system where state-backed security and private sector innovation coexist to shape the world of trading.

EMA vs SMA vs WMA: Which Moving Average Should You Use?🔎 Intro / Overview
Moving Averages remain one of the most trusted tools in technical analysis. They smooth price action, highlight the trend, and often act as dynamic support or resistance.
In this post, we compare the 20-period SMA, EMA, and WMA on BTCUSD 4H to show how each reacts differently to market moves.
___________________________________________________________
📔 Concept
SMA (Simple Moving Average): Every candle in the lookback is weighted equally → smooth but slower to react.
EMA (Exponential Moving Average): Recent candles carry more weight → reacts faster, hugs price closely.
WMA (Weighted Moving Average): Linear weighting → a balance between SMA’s stability and EMA’s sensitivity.
The difference lies in responsiveness. Faster averages react early but risk false signals, slower averages confirm trends but lag.
___________________________________________________________
📌 How to Use
1️⃣ Plot the 20-period SMA, EMA, and WMA together.
2️⃣ Watch how each responds during pullbacks, rallies, and consolidations.
3️⃣ Use EMA for quicker signals, SMA for smoother long-term view, and WMA if you prefer a middle ground.
4️⃣ Combine with price action or RSI to avoid relying on moving averages alone.
___________________________________________________________
🎯 Trading Plan
Intraday traders: EMA crossovers (e.g., 9 vs 21 EMA) for faster entries and exits.
Swing traders: SMA for identifying trend direction and major support/resistance.
Balanced traders: WMA for medium-term setups where stability and responsiveness matter equally.
Always align the moving average with your trading style and risk appetite.
___________________________________________________________
📊 Chart Explanation
On BTCUSD 4H:
EMA (red) bent upward first during the $114k breakout, SMA (blue) confirmed later, and WMA (green) sat between them.
At the $115k retest, EMA dipped first, while SMA lagged.
At $116.5–117k resistance, EMA whipsawed but SMA stayed smoother.
Notice how these differences become clear during sharp pullbacks, quick rallies, and sideways ranges.
___________________________________________________________
👀 Observation
EMA is quick but noisy ⚡, SMA is calm but late 🕰️, WMA strikes a middle ground ⚖️.
___________________________________________________________
❗ Why It Matters?
Choosing the right moving average impacts how quickly you spot entries, confirm trends, and manage stop-losses. Understanding the differences helps traders adapt strategies to both trending and sideways markets.
___________________________________________________________
🎯 Conclusion
No single moving average is “best.” Each serves a purpose depending on the timeframe and style of trading. The key is consistency — choose one that aligns with your plan, test it, and apply it with discipline.
👉 Which one do you prefer in your trading — EMA, SMA, or WMA?
___________________________________________________________
⚠️ Disclaimer
📘 For educational purposes only ·
🙅 Not SEBI registered ·
❌ Not a buy/sell recommendation ·
🧠 Purely a learning resource ·
📊 Not Financial Advice
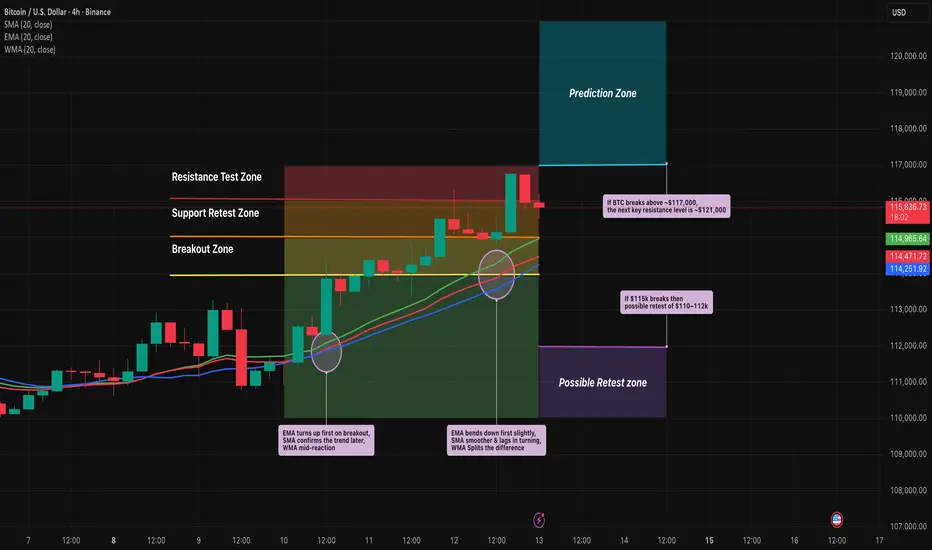
Part 6 Learn Institutional Trading Call & Put Options Explained
At the heart of option trading are two instruments: Calls and Puts.
Call Option: Gives the buyer the right (not obligation) to buy the asset at the strike price.
Buyers expect prices to rise.
Sellers (writers) expect prices to stay flat or fall.
Put Option: Gives the buyer the right (not obligation) to sell the asset at the strike price.
Buyers expect prices to fall.
Sellers expect prices to stay flat or rise.
📌 Example:
If Reliance stock trades at ₹2500:
A ₹2600 call may cost ₹50 premium. If the stock rises to ₹2700, profit = (2700-2600-50) = ₹50 per share.
A ₹2400 put may cost ₹40. If stock falls to ₹2200, profit = (2400-2200-40) = ₹160 per share.
Key Concepts
Intrinsic Value: Real profit if exercised immediately.
Time Value: Premium paid for potential future movement.
In-the-Money (ITM): Option already profitable if exercised.
Out-of-the-Money (OTM): Option has no intrinsic value, only time value.
At-the-Money (ATM): Strike = current market price.

High-Frequency Trading (HFT)1. Introduction to High-Frequency Trading
High-Frequency Trading, commonly known as HFT, is one of the most fascinating and controversial developments in modern financial markets. It refers to the use of advanced algorithms, ultra-fast computers, and high-speed data networks to execute thousands of trades in fractions of a second. Unlike traditional traders who might hold a stock for days, weeks, or months, HFT firms often hold positions for mere milliseconds to seconds before closing them.
The goal is simple yet complex: exploit tiny price inefficiencies across markets repeatedly, so that the small profits from each trade accumulate into large gains. HFT thrives on speed, volume, and precision.
In the 21st century, HFT has transformed how global markets function. Estimates suggest that 50–60% of equity trading volume in the US and nearly 40% in Europe is driven by HFT. It has created a financial arms race where firms spend millions to shave microseconds off trade execution time.
But while some argue HFT improves liquidity and efficiency, others see it as an unfair advantage that destabilizes markets. To understand this debate, we must first trace how HFT evolved.
2. Historical Evolution of HFT
a) Early Trading Days
Before computers, trading was conducted by human brokers shouting orders on exchange floors. Trades took minutes, sometimes hours, to process. Speed wasn’t the focus; information and relationships were.
b) Rise of Electronic Trading (1970s–1990s)
The introduction of NASDAQ in 1971, the first electronic stock exchange, was the seed for automated trading.
By the late 1980s, program trading became popular: computer systems executed pre-defined buy/sell orders.
Regulatory changes like SEC’s Regulation ATS (1998) enabled Alternative Trading Systems (ATS), such as electronic communication networks (ECNs).
c) Birth of High-Frequency Trading (2000s)
With the spread of broadband internet and decimalization (2001) of stock quotes (moving from 1/16th to 1 cent spreads), markets became tighter and more suitable for HFT.
By mid-2000s, firms like Citadel, Jump Trading, and Renaissance Technologies began developing advanced algorithms.
In 2005, Regulation NMS in the US required brokers to offer clients the best available prices, which fueled arbitrage-based HFT.
d) The HFT Boom (2007–2010)
Ultra-low latency networks allowed HFT firms to trade in microseconds.
During this period, HFT profits peaked at $5 billion annually in the US.
e) Modern Era (2010–Present)
Post the 2010 Flash Crash, regulators imposed stricter monitoring.
Now, HFT is more competitive, with shrinking spreads and lower profitability. Only the largest firms with cutting-edge infrastructure dominate.
3. Core Principles and Mechanics of HFT
At its core, HFT relies on three fundamental pillars:
Speed – Faster data processing and trade execution than competitors.
Volume – Executing thousands to millions of trades daily.
Automation – Fully algorithm-driven, with minimal human intervention.
How HFT Works Step by Step:
Market Data Collection – Systems capture live market feeds from multiple exchanges.
Signal Processing – Algorithms identify potential opportunities (like arbitrage or momentum).
Order Placement – Orders are executed within microseconds.
Risk Control – Automated systems constantly monitor exposure.
Order Cancellation – A hallmark of HFT is rapid order cancellation; more than 90% of orders are canceled before execution.
In short, HFT is about being faster and smarter than everyone else in spotting and exploiting price inefficiencies.
4. Technology & Infrastructure Behind HFT
HFT is as much about technology as finance.
Colocation: HFT firms place their servers next to exchange servers to minimize latency.
Microwave & Laser Networks: Some firms use microwave towers or laser beams (instead of fiber optic cables) to send signals faster between cities like Chicago and New York.
Custom Hardware: Use of Field-Programmable Gate Arrays (FPGAs) and specialized chips for ultra-fast execution.
Algorithms: Written in low-level programming languages (C++, Java, Python) optimized for speed.
Data Feeds: Direct market data feeds from exchanges, often costing millions annually.
Without such infrastructure, competing in HFT is impossible.
5. Types of HFT Strategies
HFT isn’t a single strategy—it’s a family of approaches.
a) Market Making
Continuously posting buy and sell quotes.
Profit from the bid-ask spread.
Provides liquidity but withdraws during stress, creating volatility.
b) Arbitrage Strategies
Statistical Arbitrage: Exploiting short-term mispricings between correlated assets.
Index Arbitrage: Spotting mismatches between index futures and constituent stocks.
Cross-Exchange Arbitrage: Exploiting price differences across exchanges.
c) Momentum Ignition
Algorithms try to trigger price moves by quickly buying/selling and then profiting from the resulting momentum.
d) Event Arbitrage
Trading news or events (earnings releases, economic data) milliseconds after release.
e) Latency Arbitrage
Profiting from speed advantage when market data is updated at different times across venues.
f) Quote Stuffing (controversial)
Sending massive orders to overload competitors’ systems, then exploiting the delay.
6. Benefits of HFT
Despite criticisms, HFT provides several market benefits:
Liquidity Provision – Ensures continuous buy/sell availability.
Tighter Spreads – Reduced transaction costs for investors.
Market Efficiency – Prices reflect information faster.
Arbitrage Reductions – Eliminates mispricings across markets.
Automation & Innovation – Pushes markets toward modernization.
7. Risks, Criticisms, and Controversies
HFT has a darker side.
Market Volatility – Sudden liquidity withdrawals can trigger flash crashes.
Unfair Advantage – Retail and institutional investors can’t compete on speed.
Order Spoofing & Manipulation – Some HFT tactics border on illegal.
Systemic Risk – Reliance on algorithms may cause chain reactions.
Resource Arms Race – Billions spent on infrastructure only benefit a few.
The 2010 Flash Crash
On May 6, 2010, the Dow Jones plunged nearly 1,000 points in minutes, partly due to HFT feedback loops. Although the market recovered quickly, it exposed the fragility of algorithm-driven markets.
8. Regulation & Global Perspectives
Regulators worldwide are struggling to balance innovation with fairness.
US: SEC and CFTC monitor HFT. Rules like Reg NMS and circuit breakers have been introduced.
Europe: MiFID II (2018) tightened reporting, increased transparency, and mandated testing of algorithms.
India: SEBI regulates algo trading; discussions about limiting co-location privileges exist.
China: More restrictive, cautious approach.
Overall, regulators want to prevent manipulation while preserving liquidity benefits.
Conclusion
High-Frequency Trading is both a marvel of technology and a challenge for market fairness. It epitomizes the arms race between human ingenuity and machine speed. While HFT undoubtedly improves liquidity and market efficiency, it also introduces systemic risks that cannot be ignored.
As markets evolve, so will HFT—pushed forward by AI, quantum computing, and global competition. For traders, investors, and policymakers, understanding HFT isn’t just about finance—it’s about the intersection of technology, economics, and ethics in the digital age of markets.
Derivatives in India: Secret Strategies for Massive ReturnsChapter 1: Understanding the Derivative Landscape in India
Before diving into strategies, it’s essential to understand the structure of derivatives in India.
1.1 What Are Derivatives?
A derivative is a financial contract whose value is derived from an underlying asset—such as stocks, indices, commodities, or currencies. In India, the most popular derivatives are:
Futures: Obligatory contracts to buy/sell at a predetermined price and date.
Options: Rights (but not obligations) to buy (call) or sell (put) at a specified price.
1.2 Key Milestones in India’s Derivatives Market
2000: NSE introduced index futures (Nifty 50).
2001: Index options and stock options launched.
2002: Stock futures introduced.
2020s: Surge in retail participation, especially in weekly options like Bank Nifty and Nifty.
1.3 Why Derivatives Matter in India
High Liquidity: Nifty and Bank Nifty options are among the most traded contracts globally.
Leverage: Small capital can control large positions.
Risk Management: Hedging against market volatility.
Speculation: Rapid gains (or losses) from price swings.
Chapter 2: The Psychology of Massive Returns
Before we look at the “secret strategies,” it’s important to highlight the psychological aspect.
2.1 Retail vs. Institutional Mindset
Retail traders often chase short-term profits, influenced by tips and news.
Institutions focus on risk-adjusted returns and hedging.
2.2 The Power of Discipline
The secret to massive returns isn’t chasing every trade but mastering risk control. Successful derivative players:
Limit losses using stop-loss orders.
Diversify positions.
Understand implied volatility and time decay.
2.3 The Illusion of Quick Money
Many traders blow up accounts because derivatives magnify both profits and losses. True success comes when strategies align with market structure.
Chapter 3: Secret Derivative Strategies for Massive Returns
Now let’s uncover the advanced and lesser-known strategies that experienced traders in India deploy.
3.1 The “Covered Call” Strategy
How it works: Buy a stock and sell a call option on the same stock.
Why it works in India: Many Indian stocks (like Infosys, HDFC Bank, Reliance) have stable long-term growth. Covered calls allow investors to earn extra income through premiums.
Secret Edge: Institutions frequently roll over covered calls, effectively compounding returns.
3.2 The “Straddle & Strangle” Trick Before Events
Straddle: Buy both a call and a put at the same strike price.
Strangle: Buy a call and a put at different strike prices.
When to use: Before high-volatility events (Union Budget, RBI monetary policy, earnings).
Secret Edge: In India, implied volatility (IV) tends to spike before events, allowing traders to profit even without large price moves.
3.3 The “Iron Condor” Strategy for Sideways Markets
Setup: Sell an out-of-the-money call and put, and buy further out-of-the-money call and put.
Why it works: Indian indices often consolidate after big moves, making non-directional strategies highly profitable.
Secret Edge: Works exceptionally well during weeks when no major events are scheduled.
3.4 The “Calendar Spread” Advantage
How it works: Sell near-term options and buy long-term options.
Why it works in India: Weekly options expire every Thursday, while monthly options provide longer exposure. Traders exploit the faster time decay in short-term contracts.
3.5 The “Delta Neutral” Hedge Fund Style Strategy
Concept: Create positions where overall delta (price sensitivity) is near zero, focusing on volatility instead of direction.
Example: Combine futures and options to balance exposure.
Secret Edge: Many prop desks in India use delta-neutral positions with high leverage to scalp volatility.
3.6 Bank Nifty Weekly Options: The Retail Goldmine
Why Bank Nifty? It has the highest liquidity and volatility.
Secret Trick: Institutions often sell far out-of-the-money (OTM) options to collect premiums, while retail traders chase cheap options.
How to win: Instead of buying OTM lottery tickets, adopt option-selling strategies with strict risk management.
3.7 “Event-Based Futures Arbitrage”
Concept: Price discrepancies often exist between cash and futures markets during dividend announcements, stock splits, or mergers.
Secret Edge: Advanced traders arbitrage these mispricings for near risk-free profits.
3.8 “Sectoral Rotational Strategies”
How it works: Track which sector index (Nifty IT, Nifty Pharma, Nifty Bank) is gaining momentum.
Secret Edge: Derivatives allow leveraged plays on sectors, amplifying returns during sectoral bull runs.
Chapter 4: Institutional Secrets That Retail Misses
Institutions and proprietary trading desks in India use strategies hidden from retail eyes.
4.1 Options Writing Dominance
Data shows institutions and HNIs are net option sellers, while retail is usually on the buying side. Sellers win most of the time due to time decay (theta).
4.2 Smart Order Flow Analysis
Institutions use algorithms to analyze open interest (OI) buildup. For example:
Rising OI with price rise → Long buildup.
Rising OI with price fall → Short buildup.
Retail often ignores these signs.
4.3 Implied Volatility Arbitrage
Big players monitor volatility skews between Nifty and Bank Nifty, or between weekly and monthly contracts. They profit from mispriced options that retail never notices.
Chapter 5: Risk Management – The True Secret to Longevity
No matter how powerful your strategy, risk management is the real differentiator.
5.1 The 2% Rule
Never risk more than 2% of capital on a single trade.
5.2 Stop-Loss Discipline
Options can go to zero, but a stop-loss saves you from portfolio collapse.
5.3 Position Sizing
Institutions diversify across indices, stocks, and expiries to avoid overexposure. Retail traders should do the same.
Conclusion
Derivatives in India present unparalleled opportunities for those who know how to use them wisely. The secret strategies for massive returns aren’t really about exotic formulas—they’re about understanding volatility, market psychology, institutional behavior, and risk management.
While retail traders often chase lottery-style option buying, the real winners are those who:
Sell options with discipline.
Use spreads and hedges to limit risks.
Exploit volatility and time decay.
Align trades with institutional flows.
If you want to succeed in the derivative markets of India, stop searching for shortcuts. Instead, master these strategies, respect risk, and trade with a professional mindset. The potential for massive returns is real—but only for the disciplined few.