Real Knowledge of MarketCore Foundational Knowledge
Derivatives Basics: Options are derivative contracts, meaning their value is derived from an underlying asset (stocks, indices, commodities, etc.).
Key Terminology: A trader must be fluent in terms like call options (right to buy), put options (right to sell), strike price, premium, expiration date, intrinsic value, and time value.
Rights vs. Obligations: Understanding that option buyers have the right, but not the obligation, to exercise, while option sellers (writers) have the obligation if exercised, is fundamental to risk assessment.
Leverage: Options offer significant leverage, meaning a small amount of capital can control a large position in the underlying asset, which amplifies both potential profits and losses.
X-indicator

Part 1 Master Candle Stick Pattern How Options Work
Each option represents a contract between a buyer and a seller. The buyer pays a premium to the seller (also called the writer) in exchange for certain rights:
The call option buyer has the right to buy the asset at the strike price.
The put option buyer has the right to sell the asset at the strike price.
If the market moves in favor of the buyer, they can exercise the option to make a profit. If the market moves against them, they can simply let the option expire, losing only the premium paid.

Unlocking Trading Breakouts and Avoiding Costly Mistakes1. What Is a Breakout in Trading?
A breakout occurs when the price of a stock or asset moves outside a key support or resistance level with increased volume.
Resistance Breakout: Price moves above a resistance level (previous high or consolidation zone).
Support Breakout: Price drops below a support level (previous low or base).
This movement suggests that market sentiment is shifting—buyers or sellers are gaining control. A valid breakout often signals a new phase of volatility or the beginning of a strong trend.
For example, if a stock has been trading between ₹100 and ₹120 for weeks, a close above ₹120 on strong volume may signal a bullish breakout—potentially leading to a larger upside move.
2. Why Breakouts Matter
Breakouts often mark major transitions in supply and demand.
When price breaks above resistance, it shows that buyers have overpowered sellers.
When price breaks below support, it means sellers have overwhelmed buyers.
These moments attract large institutional traders and trigger algorithmic buying or selling. Breakout traders attempt to capture the early stage of a trend before the broader market catches on.
However, not every breakout leads to a sustainable move. Many fail quickly—these are known as false breakouts or “bull traps” and “bear traps.” Understanding how to differentiate them is key to success.
3. Characteristics of a Strong Breakout
To filter high-probability breakouts, traders should look for certain confirming signals:
a. High Volume
Volume is the heartbeat of any breakout. When price breaks a key level with high volume, it shows strong participation and conviction among traders. Low-volume breakouts often fail.
b. Tight Consolidation Before Breakout
A tight range or a base pattern (like a flag, pennant, or triangle) before breakout suggests accumulation or preparation for a major move.
c. Strong Close Beyond the Level
The price should close beyond the breakout point—not just spike intraday. Closing strength confirms that the breakout is genuine.
d. Favorable Market Context
Breakouts perform best in trend-supportive markets. A bullish breakout in a strong overall market (e.g., NIFTY 50 uptrend) has a higher chance of succeeding.
4. Common Types of Breakout Patterns
1. Horizontal Breakouts
Price breaks a flat support or resistance level, often after sideways movement or consolidation.
2. Trendline Breakouts
A long-standing trendline is breached, signaling a potential reversal or acceleration of momentum.
3. Chart Pattern Breakouts
Patterns like triangles, flags, rectangles, cups and handles, and head and shoulders often lead to breakouts. Each has its psychology of accumulation and release.
4. Volatility Breakouts
Price suddenly expands after a period of low volatility (e.g., after a squeeze on Bollinger Bands). Such breakouts are explosive but short-lived.
5. The Psychology Behind Breakouts
Understanding trader psychology is as important as chart analysis.
When price nears resistance, many traders expect rejection and place sell orders there. But once the price breaks above that level, short sellers are forced to cover, adding to buying pressure. Similarly, breakout traders jump in, driving price higher—a self-reinforcing cycle that fuels trends.
However, emotions can be dangerous. Many traders fear missing out (FOMO) and chase the price after the breakout has already extended too far. This often leads to losses when price retraces.
6. The Most Common Breakout Mistakes (and How to Avoid Them)
a. Entering Too Early
Jumping in before confirmation is a common trap. Wait for a daily or hourly candle close above resistance (or below support). Premature entries often get caught in false breakouts.
Solution: Be patient. Confirmation matters more than speed.
b. Ignoring Volume
Breakouts without volume often lack strength. Many traders ignore this and assume every move beyond a line is a breakout.
Solution: Use volume indicators (like Volume Profile or OBV) to confirm market participation.
c. No Stop-Loss Strategy
Many traders enter breakouts without pre-defined stop-loss levels, hoping the price will “eventually” go in their favor. This leads to big losses.
Solution: Always place a stop-loss just below the breakout point (for longs) or above it (for shorts). This protects against false breakouts.
d. Chasing Price
After the breakout, price may retest the breakout zone before resuming its trend. Impatient traders chase extended moves, only to see price pull back.
Solution: Wait for a retest or minor pullback before entering.
e. Ignoring Market Context
A breakout in a weak overall market is risky. Broader sentiment influences individual stock movement.
Solution: Align trades with broader trend direction. Bullish breakouts perform better in bull markets.
f. Over-Leveraging
Using high leverage amplifies both profit and loss. If the breakout fails, leveraged traders face margin calls.
Solution: Keep position sizes moderate—risk no more than 1–2% of capital per trade.
7. Smart Techniques to Trade Breakouts Effectively
a. Use Multi-Timeframe Analysis
Check higher timeframes (like weekly or daily) to confirm structure, and use lower ones (like 1-hour) for entries. This ensures alignment between short-term and long-term trends.
b. Employ Volume Profile
Volume Profile helps identify high-volume nodes (HVNs)—zones of strong support/resistance—and low-volume nodes (LVNs)—areas where breakouts are likely to accelerate.
c. Watch for Retests
Many valid breakouts come back to retest the broken level before continuing. This offers low-risk entry points.
d. Combine Momentum Indicators
Use RSI, MACD, or ADX to confirm momentum. If these show strength during breakout, chances of success rise.
e. Manage Emotions
Don’t let excitement or fear dictate action. Follow your trading plan strictly—discipline beats prediction.
8. Risk Management in Breakout Trading
Breakout trading works best with strict risk management because not all breakouts succeed.
Here’s how to manage risk effectively:
Stop-Loss: Place just beyond the opposite side of the breakout.
Position Sizing: Limit risk to 1–2% of capital per trade.
Trailing Stops: As price moves in your favor, trail your stop-loss to lock in profits.
Risk–Reward Ratio: Target at least 2:1. For every ₹1 risked, aim to gain ₹2.
Without proper risk control, even a few failed breakouts can wipe out profits from several successful ones.
9. Identifying False Breakouts
False breakouts happen when price temporarily breaches a key level and then reverses sharply. These are often caused by stop-hunting or lack of follow-through buying/selling.
How to Identify:
Breakout happens with low or average volume.
Price doesn’t close beyond the level.
Immediate reversal candle (like a shooting star or bearish engulfing).
How to Avoid:
Wait for confirmation on closing basis.
Avoid trading during major news events when volatility is erratic.
Use alerts instead of instant market entries.
10. Conclusion: Mastering the Art of Breakouts
Breakout trading offers tremendous potential—but only for disciplined traders who respect structure, volume, and risk. Successful breakout traders don’t chase—they anticipate, confirm, and control risk.
By focusing on volume confirmation, price structure, and broader trend context, you can distinguish between genuine and false breakouts. Equally important is patience—waiting for setups that align technically and psychologically.
Remember: every breakout is an opportunity, but only if you trade it with a plan. Stay objective, manage your emotions, and protect your capital. Over time, mastering breakout trading becomes less about prediction and more about precision—the art of entering when others hesitate and exiting when others panic.
How to Understand Candlestick Patterns1. The Structure of a Candlestick
A single candlestick consists of four main components:
Open: The price at which the asset began trading during that time period.
Close: The price at which the asset finished trading during that period.
High: The highest price reached within that timeframe.
Low: The lowest price reached within that timeframe.
The body of the candlestick represents the range between the open and close prices.
The wicks or shadows (thin lines above and below the body) show the highs and lows.
If the close is higher than the open, the candlestick is often colored green or white, indicating bullish (buying) pressure.
If the close is lower than the open, the candlestick is usually red or black, showing bearish (selling) pressure.
This simple structure gives an instant snapshot of price behavior within that period.
2. Why Candlestick Patterns Matter
Candlestick patterns are more than just shapes—they reflect market psychology: the emotions of traders, including fear, greed, and hesitation. When you interpret these patterns correctly, you can anticipate what the market might do next.
For example:
A long green candle indicates strong buying enthusiasm.
A long red candle shows aggressive selling pressure.
A candle with a small body and long wicks reflects indecision in the market.
Over time, combinations of these candles form patterns that traders use to predict price direction.
3. Types of Candlestick Patterns
Candlestick patterns are generally categorized into three main types:
Reversal patterns – Indicate a change in trend direction.
Continuation patterns – Suggest the trend will likely continue.
Indecision patterns – Show hesitation, signaling a possible pause or reversal.
Let’s explore each with examples.
4. Reversal Candlestick Patterns
These patterns often appear at the end of a trend and signal a potential turning point.
a. Hammer and Hanging Man
Hammer: Found in a downtrend, it has a small body with a long lower wick. This means sellers drove prices down, but buyers stepped in and pushed it back up—a sign that bulls are gaining control.
Hanging Man: Looks identical to a hammer but occurs in an uptrend. It suggests buyers are losing momentum and sellers might soon take over.
b. Bullish Engulfing Pattern
A small red candle is followed by a large green candle that completely engulfs the previous body. This shows a strong shift from selling to buying pressure, indicating a potential uptrend reversal.
c. Bearish Engulfing Pattern
The opposite of the bullish version. A small green candle is followed by a large red one that engulfs it—signaling that bears are taking charge, often leading to a downtrend.
d. Doji
A doji occurs when the open and close prices are nearly the same, forming a very small body with long wicks. It shows indecision between buyers and sellers. Depending on its position within the trend, it may signal a reversal or continuation.
e. Morning Star and Evening Star
Morning Star: A three-candle pattern signaling a bullish reversal. It consists of a long red candle, a small indecisive candle (doji or small body), and a long green candle confirming the reversal.
Evening Star: The opposite, signaling a bearish reversal, often found at the top of an uptrend.
5. Continuation Candlestick Patterns
These patterns suggest that the current trend—up or down—is likely to persist.
a. Rising Three Methods
Appears in an uptrend. It starts with a strong green candle, followed by several small red candles (temporary pullback), and then another strong green candle breaking above the previous high—confirming the continuation of the bullish trend.
b. Falling Three Methods
The bearish version of the above. A large red candle, followed by small green candles, and another large red candle indicate that the downtrend will continue.
c. Bullish and Bearish Harami
Bullish Harami: A small green candle forms within the body of a prior large red candle—suggesting selling pressure is weakening.
Bearish Harami: A small red candle forms inside a prior green one—hinting at potential downward movement.
6. Indecision or Neutral Candlestick Patterns
Some patterns show uncertainty or consolidation—meaning traders are waiting for a breakout in either direction.
a. Spinning Tops
These candles have small bodies and long upper and lower wicks. They indicate a tug-of-war between buyers and sellers, ending in near balance. They often precede a breakout or trend reversal.
b. Doji (Revisited)
Depending on its position, a doji might signal hesitation within an existing trend or the start of a reversal once confirmed by subsequent candles.
7. Understanding Candlestick Context
Candlesticks don’t work in isolation—they must be analyzed in context:
Trend Direction: A bullish pattern in a strong downtrend may not succeed unless confirmed by volume or follow-up candles.
Volume: High trading volume strengthens the validity of a pattern.
Support and Resistance: Patterns near key levels (like support zones or resistance lines) carry more weight.
Timeframe: Higher timeframes (daily or weekly charts) usually provide more reliable patterns than shorter ones (5-minute or 15-minute).
Example:
If a hammer forms near a major support level with high volume, it’s a strong indication that buyers are stepping in.
8. Common Mistakes When Reading Candlestick Patterns
Ignoring Market Context: Patterns can fail if you don’t consider overall trend or support/resistance zones.
Trading Without Confirmation: Always wait for confirmation—like a closing candle or volume spike—before entering trades.
Overtrading Patterns: Not every pattern guarantees a reversal or breakout. Use them with other tools like moving averages or RSI.
Forgetting Risk Management: Even the strongest pattern can fail. Use stop-loss orders to manage risk.
9. Combining Candlestick Patterns with Indicators
To improve accuracy, traders combine candlestick patterns with:
Moving Averages (to identify trend direction)
RSI (Relative Strength Index) (to gauge overbought/oversold levels)
MACD (Moving Average Convergence Divergence) (to confirm momentum shifts)
Volume Indicators (to measure strength of buying or selling pressure)
For example, a bullish engulfing pattern confirmed by RSI moving up from an oversold level is a strong buy signal.
10. Final Thoughts: Mastering Candlestick Patterns
Candlestick analysis blends visual observation with emotional insight. Every candle tells a part of the story—who’s winning, who’s losing, and what might come next.
To truly master candlesticks:
Study real charts daily.
Observe how patterns behave across different timeframes.
Learn which patterns work best in trending versus ranging markets.
Always confirm patterns with volume and momentum indicators.
With consistent practice, candlestick patterns will become second nature, allowing you to anticipate price movements with greater confidence and precision.
Quantitative Trading in India1. What is Quantitative Trading?
Quantitative trading involves developing mathematical models that analyze large sets of historical and real-time market data to identify profitable trading opportunities. These models are then translated into algorithms that execute trades automatically when specific conditions are met.
Unlike traditional trading, where decisions are based on human analysis or intuition, quant trading depends on data-driven models—built from statistical patterns, price behavior, and probability-based predictions.
For instance, a quantitative model might identify that whenever a particular stock’s price crosses its 50-day moving average, there’s a 60% chance it will rise by 1% in the next two days. The algorithm will then automatically place a buy order when this condition occurs and exit when profit or risk targets are hit.
2. The Rise of Quantitative Trading in India
The Indian financial market has undergone a digital revolution in the past decade. The introduction of advanced trading platforms, co-location services by exchanges, and faster internet connectivity has made algorithmic and quantitative trading more accessible.
NSE and BSE Initiatives: Both the National Stock Exchange (NSE) and Bombay Stock Exchange (BSE) allow algorithmic trading through their APIs. The NSE launched “NOW” and later “Colo” services that let institutional traders place their servers near the exchange for low-latency execution.
Growth in HFT and Algo Desks: Many domestic and foreign institutional investors now operate high-frequency trading (HFT) and quant desks in India.
Retail Access: With brokers like Zerodha, Upstox, and Interactive Brokers offering APIs, even retail traders can deploy basic quant strategies today.
India’s equity and derivatives markets—known for their liquidity and volatility—offer ideal conditions for quantitative models to thrive.
3. Key Components of Quantitative Trading
Quantitative trading relies on multiple technical and analytical components:
a. Data Collection and Processing
The foundation of quant trading is data—price, volume, volatility, order book, and macroeconomic indicators. Traders use both historical data (to backtest strategies) and real-time data (for live execution).
Data is cleaned, normalized, and structured before being fed into analytical models.
b. Mathematical Modeling
Traders use statistical and machine learning techniques to find relationships in the data. Common techniques include:
Regression analysis to predict future price moves.
Time-series modeling like ARIMA or GARCH for volatility forecasting.
Machine learning models such as random forests or neural networks to identify non-linear market patterns.
c. Backtesting
Before deploying a model, it’s tested on historical data to evaluate performance metrics—profitability, drawdown, win rate, and Sharpe ratio. This step helps refine parameters and assess risk.
d. Execution Systems
The strategy is implemented using automated scripts written in Python, C++, or R. Execution systems ensure the trade is carried out efficiently and at the desired price, with minimal slippage and latency.
e. Risk Management
Quantitative traders use strict risk management protocols, including stop-losses, position sizing, and portfolio diversification. Models also include safeguards to handle sudden market disruptions.
4. Types of Quantitative Trading Strategies
Quant trading covers a wide range of strategies. Some of the most popular in India include:
a. Statistical Arbitrage
This strategy involves exploiting temporary price inefficiencies between correlated securities. For example, if two bank stocks usually move together but diverge briefly, a trader might short one and buy the other, expecting prices to converge.
b. Mean Reversion
Based on the idea that prices eventually revert to their mean, traders buy when prices fall below the average and sell when they rise above it.
c. Momentum Trading
Momentum models look for stocks showing strong price movements in one direction and attempt to ride the trend. These are popular in the Indian equity derivatives market.
d. Market Making
Market makers provide liquidity by simultaneously placing buy and sell orders, earning from the bid-ask spread. Quant systems are used to constantly adjust quotes based on volatility and order flow.
e. Machine Learning-Based Models
AI and deep learning models analyze large datasets—including news, social media sentiment, and macro data—to predict short-term price trends.
5. Technology and Infrastructure
Quantitative trading demands high computing power and low-latency infrastructure.
Key tools and technologies include:
Programming Languages: Python, R, C++, and MATLAB for model development.
Databases: SQL, MongoDB, and time-series databases to handle massive data.
Cloud Computing: Platforms like AWS and Google Cloud for scalability.
APIs and FIX Protocols: For real-time data and automated order execution.
Co-location Servers: Provided by NSE and BSE for high-speed trading.
6. Regulatory Framework in India
The Securities and Exchange Board of India (SEBI) regulates quantitative and algorithmic trading. Some of the major regulations include:
Approval Requirement: Institutional participants must get exchange approval before using an algorithm.
Risk Checks: Pre-trade risk controls are mandatory—such as order price bands and quantity limits.
Audit Trail: All automated strategies must maintain complete logs of trades.
Fair Access: SEBI ensures equal market access for all participants, preventing latency advantages.
Retail traders using broker APIs are also subject to compliance checks, including throttling limits and order validations.
7. Advantages of Quantitative Trading
Quant trading offers multiple advantages over traditional manual methods:
Emotion-Free Decision Making: Models rely on logic and data, not human emotion.
Speed and Efficiency: Algorithms execute trades in microseconds.
Backtesting Capability: Strategies can be tested before deployment.
Scalability: The same model can be applied across multiple instruments.
Diversification: Automated systems can manage hundreds of securities simultaneously.
8. Challenges in India’s Quant Landscape
Despite its growth, quant trading in India faces unique challenges:
Data Quality: Historical tick data is expensive and often inconsistent.
Regulatory Complexity: Frequent SEBI changes create compliance hurdles.
Infrastructure Costs: Co-location and low-latency systems are costly for small firms.
Talent Gap: Skilled professionals with expertise in both finance and coding are limited.
Market Depth: While Nifty and Bank Nifty are highly liquid, smaller stocks lack sufficient volume for quant models.
9. The Future of Quantitative Trading in India
The future of quantitative trading in India looks extremely promising. As AI, machine learning, and big data analytics continue to evolve, trading models are becoming smarter and faster. The democratization of APIs and data feeds is enabling more retail traders to experiment with quant strategies.
Additionally, with the growth of quant funds, hedge funds, and proprietary trading firms in India, institutional adoption is accelerating. Educational programs and fintech incubators are also nurturing the next generation of quantitative analysts.
In the coming years, India is likely to see:
Greater integration of AI-driven predictive analytics.
Expansion of retail quant platforms.
Development of multi-asset quant models including commodities and currencies.
Stronger regulatory frameworks ensuring market fairness.
10. Conclusion
Quantitative trading is transforming India’s financial landscape. It represents the intersection of finance, mathematics, and technology—allowing traders to make data-driven decisions with precision and speed. While challenges like regulation and data access remain, the momentum toward automation is irreversible.
As markets mature and technology becomes more accessible, quantitative trading will continue to dominate institutional desks and increasingly empower sophisticated retail participants. In essence, the future of trading in India is quantitative, algorithmic, and intelligent.
Volume Secrets in TradingThe Hidden Force Behind Price Movements
In the world of trading, price often grabs all the attention. Traders talk about chart patterns, moving averages, and candlestick formations — but behind every price move lies the true driving force: volume. Volume is the heartbeat of the market, showing how many participants are involved and how strong or weak a move really is. Understanding the secrets hidden in volume can dramatically improve your trading accuracy and timing.
1. What is Volume in Trading?
Volume represents the number of shares, contracts, or lots traded during a specific time period. For example, if 10 lakh shares of Reliance Industries are traded on a given day, its daily volume is 10 lakh.
In simple terms, volume tells you how active the market is. Higher volume means more participation, stronger conviction, and greater liquidity. Lower volume, on the other hand, indicates weaker interest and often signals indecision or the end of a move.
Volume can be applied to any market — equities, futures, forex, or cryptocurrencies — and remains one of the most reliable indicators of institutional activity.
2. The Relationship Between Price and Volume
The secret of volume lies in understanding how it interacts with price. Volume confirms price moves and gives hints about whether a trend is genuine or fake.
Here’s how different combinations reveal the market’s true intent:
Rising Price + Rising Volume → Bullish confirmation. This shows strong buying interest and supports a sustainable uptrend.
Rising Price + Falling Volume → Weak rally. The uptrend may lack conviction and could soon reverse.
Falling Price + Rising Volume → Bearish confirmation. Indicates strong selling pressure and continuation of a downtrend.
Falling Price + Falling Volume → Weak decline. The downtrend may be losing strength and nearing a reversal.
By observing these relationships, traders can filter out false breakouts and spot trend reversals early.
3. Volume as a Measure of Strength
Volume acts like a polygraph for price action — it tells you whether the price is lying. A breakout without volume is like a car without fuel — it won’t go far. When price moves on heavy volume, it shows genuine interest from big players.
For instance, suppose a stock breaks a long resistance level at ₹500. If the breakout happens with double or triple the average volume, it means large institutions are accumulating. But if it happens on thin volume, it’s often a trap to lure retail traders before reversing.
4. Volume Patterns that Reveal Market Intent
A. Volume Spikes (Climactic Volume)
A sudden and massive surge in volume often signals a turning point. This is called climactic volume. It occurs when a trend reaches an emotional extreme — everyone wants in or out.
At market tops, climactic volume shows buying exhaustion — smart money is selling while the crowd is buying.
At market bottoms, climactic volume signals selling exhaustion — smart money starts accumulating as others panic.
B. Volume Dry-Up (Low Volume Areas)
Periods of low or drying volume often precede big moves. When a market becomes quiet and volume contracts, it shows that volatility is compressing — energy is building for the next strong move.
C. Volume Divergence
When price continues to move in one direction but volume doesn’t confirm it, it’s a warning signal. For example, if price keeps rising but volume declines, it shows weakening demand — a potential reversal is near.
5. Using Volume with Technical Indicators
Volume can be combined with other indicators to strengthen your analysis.
A. On-Balance Volume (OBV)
OBV adds volume on up days and subtracts it on down days. It helps to identify whether money is flowing in or out of a stock. If OBV rises while price stays flat, it suggests accumulation before a potential breakout.
B. Volume Moving Average
This shows average traded volume over a period, such as 20 days. A sudden rise above the average volume indicates unusual activity — often a sign that smart money is taking positions.
C. Volume Profile
A more advanced tool, Volume Profile shows how much volume traded at different price levels (not over time). It reveals price zones of heavy activity, known as High Volume Nodes (HVN), where market participants agree on value, and Low Volume Nodes (LVN), where price tends to move quickly through.
6. Secrets of Institutional Volume
Big institutions like mutual funds and FIIs cannot buy or sell massive quantities at once — they leave footprints in volume. Smart traders watch these clues to trade alongside them.
Accumulation Phase: Price stays in a range, but volume slowly builds. Institutions are quietly buying without moving the price much.
Breakout Phase: Once accumulation is done, price breaks out sharply with a surge in volume.
Distribution Phase: After a rally, volume remains high but price stops rising. Institutions start selling gradually.
Recognizing these volume footprints helps traders spot where big money is flowing.
7. Volume in Intraday Trading
In day trading, volume gives instant clues about short-term momentum.
The first hour usually shows the highest volume — a reflection of overnight news and institutional action.
Sudden volume bursts during the day often precede strong intraday breakouts.
Traders use Volume-Weighted Average Price (VWAP) to gauge institutional participation. If price stays above VWAP with strong volume, buying pressure dominates.
8. Secrets of Volume Confirmation
The biggest mistake traders make is to ignore volume confirmation during entries. Before taking any trade:
Check if the move is supported by above-average volume.
Watch for volume spikes at support or resistance zones.
Look for divergence between price and volume to detect traps.
A trade backed by strong volume has a higher probability of success because it reflects real participation.
9. Practical Tips to Use Volume Effectively
Track Average Daily Volume: Avoid illiquid stocks where volume is too low — they can show false moves.
Compare Relative Volume: Look at current volume vs. the average to spot unusual activity.
Use Volume in Multiple Timeframes: Confirm whether daily volume supports weekly or monthly trends.
Watch Breakouts and Pullbacks: Real breakouts always occur on high volume; healthy pullbacks often show lower volume.
Combine with Price Action: Never analyze volume in isolation — always relate it to what price is doing.
10. Conclusion: The Hidden Language of the Market
Volume is not just a number on your chart — it is the language of the market’s heartbeat. It reveals the story behind every price movement — who is in control, where smart money is active, and when trends are about to reverse.
By learning to read volume, traders gain a major edge. Price tells you what is happening, but volume tells you why it’s happening and whether it will continue. Mastering this hidden dimension transforms trading from guesswork into intelligent market reading.
In short, price is the headline, but volume is the truth behind it.
Small-Cap Index Funds Volatility Explained1. Understanding Small-Cap Index Funds
Small-cap index funds track market indices composed of small-cap stocks—companies typically valued between ₹5,000 crore and ₹20,000 crore in India (or between $300 million and $2 billion globally). Examples include the Nifty Smallcap 100 in India or the Russell 2000 Index in the U.S.
Unlike actively managed funds, index funds do not attempt to pick specific stocks; they simply mirror the performance of a predefined index. This makes them cost-effective and diversified, offering investors exposure to a wide range of small companies in one investment vehicle.
While this diversification helps reduce the risk of individual company failure, it doesn’t eliminate market-level volatility, especially in the small-cap segment.
2. Why Small-Cap Stocks Are Volatile
The key reason behind small-cap fund volatility lies in the nature of the underlying small companies. They are in the growth or expansion phase of their business cycle, which makes their earnings, cash flows, and valuations less stable than those of large, established firms.
Let’s break down the main causes:
a) Limited Financial Resources
Small-cap companies often have restricted access to credit and lower cash reserves. During economic downturns or credit crises, they struggle more than large firms to raise funds or maintain operations, which can cause sharp price declines.
b) Low Liquidity
Shares of small-cap companies are traded less frequently. When investors rush to buy or sell, prices can swing widely because there are fewer buyers or sellers in the market. This low liquidity amplifies short-term price movements.
c) Higher Business Risk
Many small-cap firms operate in niche markets or rely on a limited set of products. This lack of diversification in business models means that any disruption—such as regulatory changes, technological shifts, or a key customer loss—can severely impact their earnings and, consequently, stock prices.
d) Sensitivity to Economic Cycles
Small caps are considered economic barometers. They perform strongly during expansions when demand and growth rise, but they can fall sharply during recessions or when interest rates rise. This cyclical nature adds to their volatility.
e) Market Sentiment
Investor perception plays a significant role in small-cap stock movements. In bullish phases, investors often become overly optimistic, driving prices to unsustainable levels. Conversely, during market corrections, fear can lead to steep declines. Hence, sentiment swings are more pronounced in small-cap segments.
3. Historical Perspective: Volatility Patterns
Looking at historical data, small-cap indices have shown higher annualized volatility compared to large-cap indices. For instance, over long periods, the Nifty Smallcap 100 has displayed greater short-term fluctuations compared to the Nifty 50, though it has also offered higher potential returns over a 10-year horizon.
Periods of extreme volatility often follow market corrections or macroeconomic uncertainty—like the 2008 global financial crisis or the 2020 pandemic. However, in recovery phases, small caps tend to rebound faster and outperform, as investors return to riskier growth opportunities.
4. Measuring Volatility in Small-Cap Funds
Volatility can be measured using several metrics:
a) Standard Deviation
It measures how much a fund’s returns deviate from its average over time. A higher standard deviation indicates greater volatility. Small-cap index funds typically have a higher standard deviation than mid- or large-cap funds.
b) Beta
Beta measures a fund’s sensitivity to the overall market. A beta greater than 1 indicates that the fund is more volatile than the market. Small-cap funds usually have betas ranging from 1.2 to 1.5, meaning they move more sharply in both directions compared to broader market indices.
c) Sharpe Ratio
This metric shows how much excess return a fund provides per unit of risk. Although small-cap funds may have high volatility, if they generate proportionately higher returns, they can still deliver a favorable Sharpe ratio.
5. Short-Term vs Long-Term Volatility
Volatility matters most in the short term. Over days, weeks, or months, small-cap index funds can experience large swings—sometimes 5–10% in a single session during turbulent times.
However, over long investment horizons (5–10 years), these fluctuations tend to average out. Historically, investors who remained invested through multiple market cycles often benefited from the compounding effect of growth in small companies that later became mid- or large-cap giants.
6. Benefits of Volatility: Hidden Opportunities
While volatility often sounds negative, it also presents opportunities for disciplined investors:
Higher Growth Potential: Small companies have more room to grow their earnings, and as their valuations expand, investors benefit from capital appreciation.
Mean Reversion: After sharp sell-offs, small-cap indices often recover quickly, offering attractive entry points.
Diversification Advantage: Adding a small-cap index fund to a portfolio primarily composed of large-cap stocks can improve overall portfolio returns and balance risk.
Thus, for long-term investors who can tolerate fluctuations, volatility can be a friend, not a foe.
7. Managing Volatility: Smart Investment Strategies
To navigate small-cap volatility effectively, investors can adopt several strategies:
a) Long-Term Approach
Holding investments for 7–10 years allows time for small-cap companies to grow and for short-term volatility to even out.
b) Systematic Investment Plan (SIP)
Investing through SIPs helps average out the cost of purchase across market cycles, reducing the impact of volatility.
c) Diversification
Balancing small-cap exposure with mid-cap and large-cap funds creates a more stable portfolio. This helps cushion against sudden declines in the small-cap space.
d) Regular Review
Monitoring fund performance relative to benchmarks ensures that the fund continues to align with your risk tolerance and financial goals.
e) Avoid Market Timing
Trying to predict highs and lows in volatile segments often backfires. Staying invested consistently usually yields better results than frequent trading.
8. Who Should Invest in Small-Cap Index Funds?
Small-cap index funds are not suitable for everyone. They best fit investors who:
Have a high risk tolerance
Seek long-term capital growth
Can withstand temporary market declines
Understand that volatility is part of the journey toward higher returns
For conservative investors or those nearing financial goals, it’s advisable to keep small-cap allocation limited (say 10–15% of the equity portfolio).
9. Real-World Example
Consider the Nifty Smallcap 100 Index. Between March 2020 and November 2021, it surged over 150%, reflecting a massive post-pandemic recovery. Yet, in 2022, the same index dropped around 25% due to global inflation concerns and rate hikes. This wide swing highlights the volatility inherent in small caps—but also their recovery power.
10. Conclusion
Volatility in small-cap index funds is not inherently bad—it’s a reflection of the growth potential and risk embedded in smaller businesses. These funds fluctuate more because they mirror the economic pulse of emerging companies—dynamic, ambitious, and vulnerable.
For patient, informed, and risk-tolerant investors, small-cap index funds can be powerful tools for long-term wealth creation. However, success requires discipline: understanding the market cycles, managing emotions during downturns, and staying invested long enough for volatility to transform into opportunity.
Part 9 Trading Master Class With ExpertsTypes of Options
Options can be classified in different ways:
Based on Style:
European Options – can only be exercised on the expiry date.
American Options – can be exercised any time before expiry.
Based on Underlying Asset:
Stock Options – based on shares of companies.
Index Options – based on market indices like Nifty or Bank Nifty.
Commodity Options – based on commodities like gold or crude oil.
Currency Options – based on currency pairs like USD/INR.

Fundamental Analysis for Long-Term Investors1. Understanding the Concept of Fundamental Analysis
At its core, fundamental analysis (FA) seeks to answer one key question: What is the true value of this company?
By comparing the intrinsic value (calculated through analysis) with the current market price, investors can decide whether to buy, hold, or sell a stock.
If Intrinsic Value > Market Price, the stock is undervalued — a potential buying opportunity.
If Intrinsic Value < Market Price, the stock is overvalued — a signal to avoid or sell.
This method assumes that, in the long run, the market will correct any mispricing and reflect the company’s actual worth.
2. Components of Fundamental Analysis
Fundamental analysis can be divided into two main parts:
a) Qualitative Analysis
This part deals with the non-numerical aspects of a company, such as:
Business Model – How the company earns revenue and its sustainability.
Management Quality – Leadership capability and corporate governance.
Competitive Advantage (Moat) – Unique strengths like brand value, patents, or cost advantages.
Industry Outlook – Growth potential, regulatory environment, and barriers to entry.
Economic Factors – Interest rates, inflation, fiscal policy, and global market trends.
b) Quantitative Analysis
This involves examining measurable data like financial statements, ratios, and cash flows to determine a company’s financial health.
3. Key Financial Statements in Fundamental Analysis
A company’s financial statements form the backbone of fundamental analysis. Long-term investors should focus on three primary statements:
a) Income Statement
It shows the company’s profitability over a period, detailing revenue, expenses, and net income.
Key metrics:
Revenue Growth – Indicates whether the company’s sales are increasing consistently.
Operating Margin – Reflects operational efficiency.
Net Profit Margin – Shows how much profit remains after all expenses.
b) Balance Sheet
This statement provides a snapshot of the company’s financial position — assets, liabilities, and shareholders’ equity.
Important metrics include:
Debt-to-Equity Ratio (D/E) – Measures financial leverage; lower ratios imply less risk.
Current Ratio – Indicates liquidity; a ratio above 1 shows good short-term financial health.
Book Value per Share – Helps assess whether the stock is trading above or below its book value.
c) Cash Flow Statement
This shows the actual cash generated or used by the company.
Focus areas:
Operating Cash Flow (OCF) – Cash generated from core business operations.
Free Cash Flow (FCF) – Cash left after capital expenditures; indicates ability to reinvest or reward shareholders.
4. Key Financial Ratios for Long-Term Investors
Ratios simplify the evaluation of a company’s performance. Some of the most important ones are:
a) Valuation Ratios
Price-to-Earnings (P/E) Ratio – Indicates how much investors are willing to pay for each rupee of earnings. A lower P/E could suggest undervaluation.
Price-to-Book (P/B) Ratio – Compares market value to book value; useful for asset-heavy industries.
Price-to-Sales (P/S) Ratio – Ideal for companies with negative earnings but growing sales.
b) Profitability Ratios
Return on Equity (ROE) – Measures how efficiently equity is used to generate profit.
Return on Assets (ROA) – Shows how effectively the company uses its assets.
Gross and Net Margins – Indicate profitability at different stages of the income statement.
c) Liquidity and Solvency Ratios
Current Ratio & Quick Ratio – Assess short-term liquidity.
Interest Coverage Ratio – Measures ability to pay interest on debt.
d) Growth Ratios
Earnings Per Share (EPS) Growth – Consistent EPS growth indicates strong performance.
Revenue Growth Rate – Reflects expansion potential and demand.
5. Intrinsic Value and Valuation Methods
The goal of fundamental analysis is to determine intrinsic value — an estimate of what a company is truly worth. Some popular valuation methods include:
a) Discounted Cash Flow (DCF) Model
This method projects the company’s future cash flows and discounts them to present value using a required rate of return.
It’s one of the most reliable methods for estimating intrinsic value, though it requires accurate assumptions.
b) Dividend Discount Model (DDM)
Used for dividend-paying companies; it values a stock based on future dividend payments discounted to the present.
c) Relative Valuation
Compares the company’s valuation ratios (like P/E or EV/EBITDA) with peers or industry averages to assess whether it’s under or overvalued.
6. Economic and Industry Analysis
Fundamental analysis is not limited to company-level study. A top-down approach starts with understanding the broader economy and narrows down to sectors and companies.
a) Economic Analysis
Factors like GDP growth, interest rates, inflation, and fiscal policy impact company earnings and valuations. For example:
Rising interest rates can hurt highly leveraged firms.
Inflation affects input costs and consumer demand.
b) Industry Analysis
Identifying industries with favorable long-term prospects (such as renewable energy, technology, or healthcare) can improve investment success. Tools like Porter’s Five Forces help analyze industry competitiveness and profitability.
7. Qualitative Factors and Management Assessment
A company’s management team plays a vital role in long-term success. Investors should assess:
Leadership Track Record – Vision, integrity, and experience of the management team.
Corporate Governance – Transparency, accountability, and alignment with shareholder interests.
Innovation Capability – Ability to adapt to changing technology or consumer behavior.
Brand Reputation – Strength of brand loyalty and market position.
8. The Margin of Safety Principle
Coined by Benjamin Graham, the margin of safety is the difference between a stock’s intrinsic value and its market price.
For example, if a stock’s intrinsic value is ₹500 and it’s trading at ₹350, the 30% gap is the margin of safety — a cushion against analytical errors or unforeseen events.
This principle ensures that even if some assumptions go wrong, the investment remains relatively safe for the long term.
9. Long-Term Perspective and Patience
Fundamental analysis rewards patience. Stock prices can remain undervalued or overvalued for extended periods due to market sentiment or short-term volatility. However, over time, prices tend to align with intrinsic value.
Long-term investors must focus on business fundamentals, not market noise.
Compounding works best when investments are held for years in fundamentally strong companies with consistent growth, low debt, and sustainable advantages.
10. Limitations of Fundamental Analysis
While powerful, FA has its challenges:
Time-Consuming – Requires deep research and analysis.
Subjectivity – Valuation depends on assumptions that may not always be accurate.
Market Irrationality – Prices can deviate from fundamentals for long periods.
Changing Macroeconomics – Economic shocks can alter intrinsic value projections.
Thus, blending FA with periodic reviews and awareness of market cycles enhances decision-making.
Conclusion
Fundamental analysis is the foundation of successful long-term investing. It equips investors with the knowledge to differentiate between temporary market noise and genuine value. By analyzing a company’s financial health, competitive position, management quality, and future prospects, investors can make informed decisions that compound wealth over time.
Currency Trading in India (USD/INR, EUR/INR, GBP/INR, JPY/INR)1. Overview of the Indian Currency Market
The Indian currency market is regulated by the Reserve Bank of India (RBI) and the Securities and Exchange Board of India (SEBI). Unlike global forex markets that operate 24 hours a day, the Indian forex trading market follows specific timings—from 9:00 AM to 5:00 PM IST, Monday to Friday.
Currency trading in India takes place on recognized exchanges such as:
National Stock Exchange (NSE)
Bombay Stock Exchange (BSE)
Multi Commodity Exchange (MCX-SX, now known as MSEI)
Trading is done in currency futures and options contracts rather than spot markets. This allows traders to speculate on future currency movements, hedge foreign exchange exposure, and manage import-export risks.
2. Importance of Currency Trading
Currency trading in India serves several crucial purposes:
Hedging against exchange rate risk: Importers, exporters, and multinational companies use currency derivatives to protect their profits from adverse currency movements.
Speculative opportunities: Traders and investors speculate on price changes to make profits from small fluctuations in currency rates.
Diversification: For retail and institutional investors, the forex market provides an alternative asset class beyond equities, commodities, and bonds.
Global exposure: Currency trading connects the Indian economy to global capital flows and helps stabilize balance of payments.
3. Major Currency Pairs Traded in India
Let’s look closely at the four major INR-based currency pairs:
a) USD/INR – The Most Active Pair
The USD/INR pair is the most traded and liquid currency pair in India. It represents how many Indian Rupees are required to purchase one US Dollar. The exchange rate is influenced by various factors such as:
RBI’s monetary policy
India’s trade deficit with the US
Interest rate differentials between India and the US
Global crude oil prices (since India imports most of its oil in USD)
Foreign portfolio investment inflows/outflows
USD/INR is widely used by corporates for hedging and by traders for speculation. The Rupee’s value against the Dollar is also a key indicator of India’s economic strength.
b) EUR/INR – The Euro-Rupee Pair
The EUR/INR pair reflects the exchange rate between the Euro and the Indian Rupee. It is the second-most traded currency pair in India. Europe is one of India’s major trading partners, and fluctuations in the Euro impact sectors like pharmaceuticals, engineering goods, and textiles.
Factors affecting EUR/INR include:
Eurozone’s economic data (GDP, inflation, trade balance)
European Central Bank (ECB) policies
Crude oil prices and global demand
Cross-currency movements between Euro and Dollar
The EUR/INR pair often exhibits higher volatility than USD/INR, providing good trading opportunities for short-term traders.
c) GBP/INR – The British Pound-Rupee Pair
The GBP/INR pair tracks the value of the British Pound in terms of the Indian Rupee. The Pound is known for its high volatility, making it attractive for experienced traders.
Key drivers of GBP/INR include:
Bank of England’s monetary policy
Political developments in the UK (like Brexit or elections)
Trade and investment flows between India and the UK
Global risk sentiment and capital movement
Because of its volatility, GBP/INR can generate both higher profits and higher risks, so traders often apply strict stop-loss strategies.
d) JPY/INR – The Japanese Yen-Rupee Pair
The JPY/INR pair represents how many Rupees are needed for 100 Japanese Yen. The Yen is often considered a safe-haven currency, meaning it tends to strengthen during global economic uncertainty.
Important factors influencing JPY/INR include:
Japan’s interest rate policy and inflation trends
Global risk appetite (Yen rises in risk-off scenarios)
India-Japan trade and investment relations
JPY/INR tends to move slower than GBP/INR or EUR/INR, making it suitable for conservative traders seeking stable movements.
4. How Currency Trading Works in India
In India, you cannot trade global forex pairs like EUR/USD or GBP/USD directly due to RBI restrictions. Instead, you can trade INR-based pairs and cross-currency pairs such as EUR/USD, GBP/USD, and USD/JPY introduced later by SEBI.
Each currency futures contract on NSE or BSE has:
Lot size: Typically 1,000 units for USD/INR, EUR/INR, and GBP/INR; 100,000 units for JPY/INR.
Tick size: 0.0025 or 0.25 paise.
Expiry: Monthly contracts expiring two working days before the last business day of the month.
Margin requirement: Around 3–5% of the contract value.
Trading is done through a registered broker, similar to equity trading, and all trades are settled in cash—no physical delivery of currencies.
5. Factors Influencing Currency Movements
Several global and domestic factors influence INR-based currency pairs:
Interest Rate Differentials: Higher interest rates in one country attract foreign capital, strengthening its currency.
Inflation Rates: Lower inflation tends to appreciate the currency’s value.
Trade Deficits: A high trade deficit leads to currency depreciation due to higher demand for foreign currencies.
Foreign Investment Flows: FII and FDI inflows support the Rupee, while outflows weaken it.
Crude Oil Prices: Rising oil prices increase India’s import bill, pressuring the Rupee.
Geopolitical Events: Global tensions, wars, and trade sanctions create volatility in currency markets.
RBI Intervention: The RBI regularly buys or sells dollars to maintain stability in the forex market.
6. Advantages of Currency Trading in India
Low Capital Requirement: Currency futures require smaller margins than equity derivatives, making it affordable for retail traders.
High Liquidity: Especially in USD/INR, which ensures easy entry and exit.
Leverage: Traders can control large positions with relatively small capital.
Diversification: Adds a new dimension to a trader’s portfolio beyond stocks and commodities.
Regulated Environment: Trading through NSE/BSE ensures transparency and security for participants.
7. Risks Involved in Currency Trading
While lucrative, forex trading also carries risks:
High Volatility: Currency pairs can move sharply in reaction to global news.
Leverage Risk: Leverage amplifies both profits and losses.
Political and Economic Events: Sudden government decisions or geopolitical crises can cause unpredictable movements.
Interest Rate Announcements: Central bank decisions can lead to overnight gaps and stop-loss hits.
Traders must therefore manage risk carefully using stop losses, position sizing, and diversified strategies.
8. Future of Currency Trading in India
India’s currency trading market is expanding rapidly due to growing globalization, digital platforms, and increased awareness among retail investors. The introduction of cross-currency pairs and potential expansion into 24-hour trading could further align India’s forex market with global standards.
Technological advancements, algorithmic trading, and integration with platforms like GIFT City (Gujarat International Finance Tec-City) are also paving the way for offshore rupee trading to return to Indian shores.
Conclusion
Currency trading in India offers a dynamic avenue for both hedgers and speculators. The four key INR pairs—USD/INR, EUR/INR, GBP/INR, and JPY/INR—reflect the nation’s integration with the global economy. Backed by SEBI and RBI regulation, the Indian forex market is evolving into a sophisticated and secure ecosystem.
For traders, mastering the fundamentals of global economics, risk management, and technical analysis is essential to succeed in currency trading. With discipline, knowledge, and proper strategy, the forex market can serve as a rewarding segment of India’s financial landscape.

Trading Psychology and Emotional Discipline1. Understanding Trading Psychology
Trading psychology refers to the mental and emotional aspects that influence trading decisions. Every trade triggers a mix of emotions — fear, greed, hope, frustration, or excitement. These emotions can cloud judgment, making traders deviate from their plans.
Even the most skilled analysts can fail if they cannot manage their reactions to profit and loss.
In simple terms, trading psychology is about how a trader’s mindset affects their actions — when to enter, hold, or exit a trade. It shapes how traders respond to risk, uncertainty, and outcomes.
2. The Role of Emotions in Trading
The two most dominant emotions in trading are fear and greed, and both can significantly distort rational thinking.
Fear:
Fear makes traders avoid taking trades even when the setup is perfect. It can also make them close profitable trades too early to “lock in” small gains, fearing the market might reverse. In other cases, fear of loss leads to hesitation and missed opportunities.
Greed:
Greed drives traders to chase trades even after a big rally or to overtrade in hopes of bigger profits. It makes them ignore risk management rules and hold onto winning positions for too long, waiting for unrealistic targets.
Hope and Regret:
Hope often keeps traders stuck in losing positions, expecting the market to turn around. Regret, on the other hand, can paralyze decision-making, as traders fear repeating past mistakes.
Understanding these emotional triggers is the first step toward controlling them.
3. Importance of Emotional Discipline
Emotional discipline is the ability to stick to your trading plan regardless of emotional highs or lows. It is what separates consistent traders from impulsive ones.
Discipline helps traders:
Follow their strategy without deviation.
Accept losses calmly and move on.
Avoid revenge trading after a losing streak.
Take profits as planned without overextending trades.
Maintain patience to wait for high-probability setups.
Without discipline, even the best system can fail. With it, an average strategy can yield consistent returns.
4. Common Psychological Mistakes Traders Make
Overconfidence:
After a few profitable trades, traders may start believing they can’t go wrong. Overconfidence leads to oversized positions and ignoring stop-losses — often ending in big losses.
Revenge Trading:
When a trader tries to “get back” at the market after a loss, they act emotionally rather than logically. Revenge trades are impulsive and usually result in further damage.
Confirmation Bias:
Traders tend to seek information that supports their existing view, ignoring contrary evidence. This bias prevents them from seeing warning signs.
Loss Aversion:
The pain of losing is psychologically stronger than the pleasure of gaining. Many traders avoid taking small losses, turning them into larger ones.
Herd Mentality:
Following others blindly — whether social media, news, or trading groups — causes traders to abandon their analysis and act out of fear of missing out (FOMO).
Lack of Patience:
Impatient traders force trades just to “stay active.” However, successful trading often requires waiting — sometimes for days — for the right setup.
5. Building a Strong Trading Mindset
Developing the right mindset takes practice and self-awareness. Here are some key principles:
Accept Uncertainty:
Every trade has an element of uncertainty. You can control your risk, but not the outcome. Accepting this truth reduces emotional stress.
Focus on Process, Not Profits:
Professionals concentrate on executing their plan correctly rather than obsessing over results. Consistency in following the process naturally leads to consistent profits.
Detach Emotionally from Money:
Traders should see capital as “trading inventory,” not as personal wealth. Emotional attachment to money causes hesitation and poor decision-making.
Maintain Realistic Expectations:
Trading is not a get-rich-quick game. Expecting overnight success creates pressure and forces impulsive trades.
Stay Present and Mindful:
Be fully aware during trading hours — not daydreaming about profits or losses. Mindfulness improves focus and reduces emotional reactions.
6. Practical Ways to Strengthen Emotional Discipline
Create and Follow a Trading Plan:
Define your entry, exit, stop-loss, and risk parameters before every trade. Once the plan is in place, follow it strictly. This removes guesswork and emotion from decisions.
Use Stop-Loss and Position Sizing:
Always use a stop-loss to protect capital. Limit each trade’s risk to a small percentage (usually 1–2% of total capital). This prevents emotional panic when trades go wrong.
Keep a Trading Journal:
Record every trade along with the reason for entry and exit, as well as your emotional state. Reviewing your journal regularly helps identify emotional patterns and mistakes.
Take Breaks After Losses:
If you experience multiple losing trades, step away. Emotional recovery is vital before returning to the market.
Meditation and Mental Training:
Many successful traders practice meditation, visualization, or breathing exercises to stay calm and focused.
Avoid Overtrading:
More trades don’t always mean more profit. Stick to quality setups that fit your trading edge.
Set Daily Profit and Loss Limits:
Predetermine a maximum loss or gain for the day. Once reached, stop trading. This prevents emotional spiral trading.
Review and Reflect Regularly:
Analyze your performance weekly or monthly to understand what works and what doesn’t — both technically and psychologically.
7. The Role of Confidence and Patience
Confidence and patience go hand in hand in trading psychology.
Confidence comes from preparation, back-testing, and knowing your system works. Patience ensures you wait for setups that match your strategy instead of forcing trades.
A confident trader doesn’t fear missing out. They know opportunities are endless. Patience ensures discipline, and discipline ensures profitability.
8. The Growth Mindset in Trading
Adopting a growth mindset means treating losses as learning opportunities rather than failures. Each mistake reveals a behavioral pattern to fix.
A trader with a growth mindset:
Reviews trades objectively.
Seeks feedback and self-improvement.
Avoids blaming the market.
Understands that consistency builds over time.
The market rewards those who keep improving rather than those who chase perfection.
9. Conclusion
Trading psychology and emotional discipline are the backbone of long-term trading success. Charts, indicators, and systems can be learned quickly, but mastering one’s mind takes continuous effort.
The best traders are not those who win every trade but those who manage their emotions through every win and loss. By developing awareness, controlling fear and greed, following a well-defined plan, and maintaining discipline, a trader can achieve stability and confidence — the true edge in the market.

AI and Data Analytics in Stock Market Decisions1. The Evolution of Stock Market Decision-Making
Traditionally, stock market decisions were made using two major approaches:
Fundamental analysis, which focuses on company performance, earnings, and macroeconomic factors.
Technical analysis, which studies past price and volume patterns to predict future trends.
While both methods remain relevant, they are now enhanced by AI and data analytics. AI can process enormous data sets that humans cannot handle manually, identify hidden correlations, and make decisions based on probabilities rather than assumptions.
The integration of these technologies started with algorithmic trading in the 1990s and has evolved into machine learning-driven trading systems and predictive analytics models in the 21st century.
2. Understanding AI and Data Analytics
Artificial Intelligence (AI) refers to systems that can mimic human intelligence, learn from experience, and make decisions autonomously. In stock trading, AI tools like machine learning (ML), deep learning, and natural language processing (NLP) play vital roles.
Machine Learning (ML): Learns patterns from historical data and applies them to predict future stock price movements.
Deep Learning (DL): Uses neural networks to process large-scale and complex financial data, identifying non-linear relationships.
Natural Language Processing (NLP): Analyzes financial news, social media sentiment, and corporate announcements to gauge market mood.
Data Analytics, on the other hand, involves the collection, cleaning, and analysis of structured and unstructured data to uncover insights. This includes historical price data, earnings reports, economic indicators, and even tweets or headlines.
Together, AI and data analytics form the backbone of quantitative trading, robo-advisory platforms, and automated portfolio management systems.
3. Key Applications of AI and Data Analytics in the Stock Market
a. Predictive Analysis and Price Forecasting
AI models can analyze historical price patterns, volatility, and macroeconomic indicators to forecast short-term and long-term price movements.
For example:
Neural networks detect recurring patterns in stock charts.
Regression models and reinforcement learning algorithms adjust predictions in real time as market conditions change.
b. Sentiment Analysis
NLP-powered tools scan news articles, earnings calls, analyst reports, and social media to measure market sentiment.
A positive sentiment can lead to short-term price surges, while negative buzz can trigger sell-offs. Platforms like Bloomberg and Refinitiv now incorporate AI-based sentiment analytics for traders.
c. Algorithmic and High-Frequency Trading (HFT)
AI-driven algorithmic trading systems execute thousands of trades per second, exploiting minor market inefficiencies.
Algorithms analyze order book data and market microstructure.
AI continuously improves its strategy by learning from past trades.
This minimizes human error and maximizes execution speed and accuracy.
d. Portfolio Management and Robo-Advisors
AI helps investors manage risk and optimize portfolios based on their risk tolerance, investment goals, and market outlook.
Robo-advisors such as Zerodha’s Niyam or international platforms like Betterment and Wealthfront use AI to automatically rebalance portfolios and minimize losses.
e. Fraud Detection and Compliance
AI-powered surveillance systems detect anomalies, such as insider trading, price manipulation, or fraudulent transactions.
Machine learning algorithms monitor trading patterns in real time and alert regulators or brokers to suspicious behavior.
f. Risk Management
AI quantifies risk using predictive models that estimate Value at Risk (VaR), expected shortfall, or drawdown probabilities.
By analyzing correlations and stress scenarios, traders can better prepare for sudden market downturns or black swan events.
4. Role of Big Data in Stock Market Analysis
Modern financial markets produce terabytes of data every day, including:
Price and volume data from multiple exchanges
Corporate filings and earnings reports
Global macroeconomic indicators
Alternative data like satellite images, foot traffic, or credit card transactions
AI and analytics platforms integrate these datasets to extract valuable insights.
For example:
Hedge funds use satellite imagery to estimate retail store performance.
Credit card data is used to forecast quarterly earnings before official reports are released.
This “alternative data revolution” gives institutions an informational edge that traditional analysis cannot provide.
5. Benefits of AI and Data Analytics in Stock Market Decisions
Speed and Efficiency: AI can process millions of data points in seconds, enabling rapid and informed decision-making.
Accuracy: Predictive models reduce human bias and emotional trading.
Automation: Reduces manual analysis and allows automated trade execution.
Risk Reduction: Helps identify potential losses early through predictive risk assessment.
Data-Driven Insights: Converts raw market data into actionable intelligence.
These advantages help both retail traders and institutional investors stay competitive in increasingly complex markets.
6. Limitations and Challenges
Despite their power, AI and analytics tools face several limitations:
Data Quality Issues: Inaccurate or biased data can lead to faulty predictions.
Overfitting: Models that perform well on historical data might fail in live markets due to changing dynamics.
Black Box Problem: Deep learning models often lack interpretability, making it hard to explain why they make certain predictions.
Market Volatility: AI cannot always predict sudden events like geopolitical crises or natural disasters.
Ethical and Regulatory Concerns: Automated trading systems can cause flash crashes or manipulate markets unintentionally.
Hence, while AI enhances decision-making, human oversight remains crucial.
7. The Future of AI in Stock Market Decision-Making
The next phase of financial technology will see even deeper integration of AI, quantum computing, and blockchain in trading ecosystems.
Quantum AI may process financial data exponentially faster, enabling near-instant decision-making.
Explainable AI (XAI) will make algorithms more transparent and trustworthy.
AI-Blockchain integration will ensure secure, auditable, and tamper-proof trading records.
Additionally, personalized AI assistants will help individual investors make smarter decisions based on their unique profiles and preferences.
8. Real-World Examples
JP Morgan’s COiN platform uses AI to review legal documents and extract key data for risk evaluation.
Goldman Sachs’ Marcus employs data analytics for consumer lending and investment recommendations.
Kavout’s Kai Score leverages machine learning to rank stocks based on predictive factors.
Indian brokerages such as Zerodha, Upstox, and ICICI Direct are adopting AI-based tools to help clients identify trading opportunities and manage portfolios efficiently.
9. Conclusion
AI and data analytics have redefined the rules of stock market participation. What was once a game of intuition and experience has now become a science of data, prediction, and automation.
By integrating AI into trading strategies, investors can gain a deeper understanding of market dynamics, identify hidden opportunities, and manage risk with greater precision.
However, successful use of AI in stock market decisions requires a balance between machine intelligence and human judgment. Machines can crunch numbers and identify trends, but human insight, discipline, and adaptability remain irreplaceable.
Ultimately, the collaboration between humans and AI will continue to shape the future of intelligent investing, driving markets toward more efficiency, transparency, and innovation.
Introduction to Indian Financial Markets1. Structure of Indian Financial Markets
The Indian financial market is broadly divided into two segments:
Money Market – Deals with short-term funds (maturity up to one year).
Capital Market – Deals with long-term funds (maturity more than one year).
Each of these segments has multiple sub-markets and instruments designed to cater to specific financial needs.
2. Money Market
The money market provides liquidity for the economy by enabling short-term borrowing and lending. It is crucial for maintaining the stability of financial institutions and ensuring that businesses and the government have access to short-term financing.
Key Instruments of the Money Market:
Treasury Bills (T-Bills): Issued by the Reserve Bank of India (RBI) on behalf of the government for short-term borrowing.
Commercial Papers (CP): Unsecured promissory notes issued by corporations to raise short-term funds.
Certificates of Deposit (CD): Negotiable time deposits issued by commercial banks.
Call and Notice Money: Very short-term loans between banks to manage daily liquidity needs.
Repurchase Agreements (Repo and Reverse Repo): Short-term borrowing/lending against government securities.
The money market in India is regulated by the Reserve Bank of India (RBI), which ensures stability, transparency, and adequate liquidity.
3. Capital Market
The capital market facilitates the raising of long-term capital by companies and governments through the issue of shares, bonds, and other securities. It also provides investors with opportunities to earn returns by investing in these instruments.
The capital market is divided into two segments:
Primary Market: Where new securities are issued (Initial Public Offerings or IPOs).
Secondary Market: Where existing securities are traded (Stock Exchanges).
Major Institutions in the Capital Market:
Stock Exchanges: The two leading stock exchanges are the Bombay Stock Exchange (BSE) and the National Stock Exchange (NSE).
Securities and Exchange Board of India (SEBI): The regulatory authority overseeing capital markets to protect investors and promote fair trading.
Depositories: Institutions like NSDL (National Securities Depository Limited) and CDSL (Central Depository Services Limited) that facilitate electronic holding and transfer of securities.
Key Instruments of the Capital Market:
Equity Shares: Represent ownership in a company.
Debentures and Bonds: Long-term debt instruments.
Mutual Funds: Investment vehicles pooling funds from multiple investors.
Derivatives: Financial contracts like futures and options that derive value from underlying assets.
Exchange-Traded Funds (ETFs): Funds traded on exchanges like stocks.
4. Role of Financial Institutions
A variety of institutions operate within the Indian financial market to ensure smooth functioning and growth:
Banks: The backbone of the financial system, offering deposit, credit, and investment services.
Non-Banking Financial Companies (NBFCs): Provide credit and financial services outside the traditional banking system.
Insurance Companies: Mobilize long-term funds through life and general insurance.
Mutual Funds and Asset Management Companies (AMCs): Provide collective investment options.
Development Financial Institutions (DFIs): Such as NABARD, SIDBI, and EXIM Bank, which support industrial, agricultural, and export financing.
5. Regulatory Framework
The Indian financial market is regulated by several key institutions to maintain transparency, protect investors, and ensure financial stability:
Reserve Bank of India (RBI): Regulates the banking system and money market, controls inflation, and manages monetary policy.
Securities and Exchange Board of India (SEBI): Regulates the capital market and protects investor interests.
Insurance Regulatory and Development Authority of India (IRDAI): Supervises the insurance sector.
Pension Fund Regulatory and Development Authority (PFRDA): Oversees pension funds and the National Pension System (NPS).
Ministry of Finance (MoF): Frames financial policies and oversees public finances.
These institutions collectively ensure that India’s financial markets remain efficient, stable, and globally competitive.
6. Evolution of Indian Financial Markets
India’s financial market has undergone significant transformation over the past few decades:
Pre-Liberalization Era (Before 1991): The market was tightly regulated with limited investment options and government-controlled interest rates.
Post-Liberalization Era (After 1991): Economic reforms introduced free-market mechanisms, liberalized capital inflows, and promoted private sector participation.
Technological Advancements: The introduction of electronic trading, online demat accounts, and real-time settlement systems improved efficiency and transparency.
Global Integration: Increased participation by foreign institutional investors (FIIs) and global listing opportunities expanded India’s financial reach.
Today, India’s financial markets are well-diversified, globally recognized, and supported by a robust technological and regulatory framework.
7. Participants in Indian Financial Markets
The Indian financial ecosystem comprises various participants:
Retail Investors: Individuals investing in shares, mutual funds, and bonds.
Institutional Investors: Entities like mutual funds, insurance companies, pension funds, and banks.
Foreign Investors: Including Foreign Institutional Investors (FIIs) and Foreign Portfolio Investors (FPIs).
Corporate Entities: Raising capital through equity or debt.
Government: Issuing securities to finance public expenditure.
Each participant contributes to market liquidity, depth, and efficiency.
8. Importance of Indian Financial Markets
The financial market plays a crucial role in the nation’s economic framework:
Mobilization of Savings: Channels individual and institutional savings into productive investments.
Efficient Resource Allocation: Ensures funds flow to sectors with higher growth potential.
Capital Formation: Encourages entrepreneurship and industrial expansion.
Price Discovery: Reflects economic trends through demand and supply of securities.
Economic Stability: Helps manage inflation, liquidity, and interest rates.
Wealth Creation: Offers opportunities for individuals and institutions to build financial assets.
9. Challenges Facing Indian Financial Markets
Despite progress, the Indian financial system faces several challenges:
Financial Illiteracy: A large portion of the population remains unaware of investment opportunities.
Regulatory Complexity: Multiple regulators can sometimes lead to overlapping responsibilities.
Market Volatility: Global economic uncertainty affects capital inflows and investor sentiment.
Limited Depth in Bond Market: The corporate bond market remains underdeveloped compared to equity markets.
Technology Risks: Increased digitalization exposes markets to cyber threats.
Efforts are ongoing to address these challenges through reforms, education, and stronger governance.
10. Future of Indian Financial Markets
The future of Indian financial markets looks promising. With initiatives like Digital India, Financial Inclusion (Jan Dhan Yojana), and Unified Payments Interface (UPI), India is building a modern, inclusive, and technology-driven financial system.
The rise of fintech startups, blockchain applications, and AI-driven analytics is expected to enhance transparency, speed, and participation. Moreover, India’s growing middle class and global economic presence are likely to attract more domestic and international investments.
Conclusion
The Indian financial market stands as a cornerstone of the country’s economic engine. From traditional banking to sophisticated capital market instruments, it provides a dynamic platform for growth, investment, and innovation. Supported by strong regulatory institutions like the RBI and SEBI, and driven by technology and globalization, India’s financial markets continue to evolve rapidly.
As India progresses toward becoming a $5 trillion economy, a robust, transparent, and inclusive financial system will remain essential to sustain growth, attract investments, and empower millions of citizens to participate in the nation’s economic journey.
Breakout liquidity accumulation distribution Breakout use as liquidity, offload position using liquidity.
Stock create strong base, given break out with more then avg volume,
After price rise , but With small candle range ( that means buyer+ sellers heavy involved here)
Price range decrease while volume rise show distribution ( offloading someone)
After 4th point big negetive candle if we enter at Breakout must be exited all positions
Because now 3rd point vol rise & small candle now working strong resistance mostly people trap.
Small candle & rise volume distribution confirm only when big candle move down with high volume or low but have big body
( Because big body show dominate sign )
Just make this fast so don't add more details cover in depth
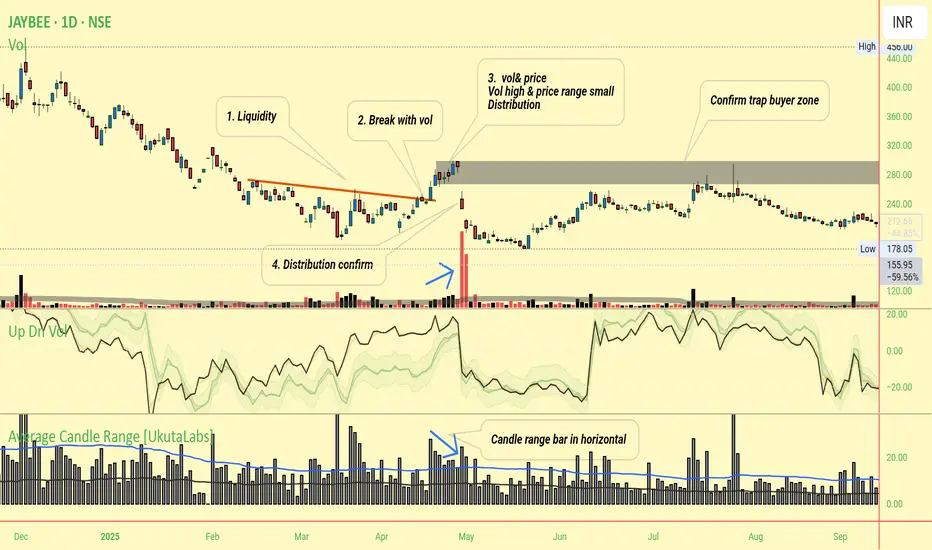
Advanced Hedging Strategies1. Understanding Advanced Hedging
At its core, hedging is a risk management technique that involves taking an offsetting position in a related asset to counterbalance potential losses. Advanced hedging, however, goes beyond simple protection. It focuses on optimizing risk-reward ratios, using derivatives combinations, and dynamically adjusting exposures according to market conditions. It is frequently used by institutional investors, hedge funds, multinational corporations, and sophisticated traders.
The aim is not just to eliminate risk but to control volatility, enhance returns, and maintain strategic flexibility.
2. Tools Used in Advanced Hedging
Before exploring the strategies, it’s important to understand the instruments used:
Options (Calls and Puts): Provide the right but not the obligation to buy or sell assets at a predetermined price.
Futures Contracts: Obligate both parties to transact at a set price on a future date.
Forwards: Customized agreements similar to futures but traded over the counter (OTC).
Swaps: Exchange of cash flows or financial instruments, commonly used to hedge interest rate or currency risks.
Exotic Derivatives: Include barrier options, binary options, and variance swaps, offering tailored risk exposures.
Advanced hedging strategies often combine several of these instruments into structured or synthetic positions.
3. Delta Hedging (Dynamic Hedging)
Delta hedging is a sophisticated options-based strategy that aims to neutralize the directional risk of an options position. “Delta” measures how much an option’s price changes relative to the underlying asset’s price.
For example, a trader holding a call option with a delta of 0.6 will hedge by selling 0.6 units of the underlying asset. As the asset price changes, the delta also changes, requiring continuous rebalancing — this is known as dynamic hedging.
Advantages:
Provides precise, real-time risk control.
Effective in managing volatility in fast-moving markets.
Challenges:
Requires constant monitoring and transaction costs.
Can lead to losses in extremely volatile or illiquid markets.
This strategy is common in options market-making, algorithmic trading, and institutional portfolio management.
4. Cross-Hedging
Cross-hedging occurs when the hedging instrument and the underlying asset are not identical but are correlated. This is often used when a direct hedge is unavailable or too costly.
For example, a jet fuel buyer might hedge fuel costs using crude oil futures since both prices move similarly. Similarly, a company exposed to a small currency may hedge through a major correlated currency.
Key to success: Correlation analysis. The hedge’s effectiveness depends on how closely the two assets move together.
Advantages:
Useful in illiquid or niche markets.
Provides flexibility in hedging complex exposures.
Limitations:
Imperfect correlation can lead to basis risk — the risk that the hedge and the asset move differently.
5. Interest Rate and Currency Swaps
Swaps are powerful tools in advanced hedging, especially for corporations and financial institutions exposed to interest rate or foreign exchange fluctuations.
Interest Rate Swaps: Allow companies to exchange fixed-rate payments for floating-rate ones, or vice versa.
Example: A firm with variable-rate debt may enter a swap to pay a fixed rate and receive a floating rate, stabilizing its interest expenses.
Currency Swaps: Used by multinational corporations to hedge exposure to exchange rate volatility in cross-border operations.
Benefits:
Long-term protection against rate or currency changes.
Can be customized to suit exposure duration and cash flow patterns.
Drawbacks:
Requires counterparties and involves credit risk.
Complex to price and monitor.
6. Options Combinations and Exotic Strategies
Professional traders often design options spreads or combinations for advanced hedging.
Examples include:
Collar Strategy: Combining a long position in the underlying with a protective put and a covered call. It limits both downside and upside risk.
Butterfly Spread: Involves multiple strikes to profit from low volatility while limiting risk.
Protective Put: Buying a put option to hedge a long position — a simple but powerful form of insurance.
Exotic Options: Barrier, Asian, or lookback options offer tailored protection and payoff structures for complex exposures.
These strategies allow cost-effective, precisely targeted, and conditional hedging.
7. Volatility Hedging
In turbulent markets, volatility becomes a risk of its own. Traders use volatility derivatives, such as VIX futures or variance swaps, to hedge exposure to market volatility.
For instance, during expected market turbulence, an investor might buy VIX futures or long volatility options to offset potential losses from market declines.
Advantages:
Protects against unpredictable volatility spikes.
Enhances portfolio stability in crisis periods.
Limitation:
Complex valuation and often expensive due to volatility premiums.
8. Tail Risk Hedging
Tail risk refers to extreme market events — low-probability but high-impact scenarios (like 2008’s financial crisis). Tail risk hedging involves using out-of-the-money (OTM) options or structured derivatives that pay off in extreme moves.
Hedge funds and institutional investors often dedicate a portion of their portfolio to such protection.
Examples:
Buying deep OTM puts on major indices.
Using credit default swaps (CDS) to hedge corporate bond risk.
Though costly during normal times, these hedges act as portfolio insurance during financial shocks.
9. Statistical and Quantitative Hedging
With the rise of algorithmic and quantitative finance, statistical hedging models use mathematics and machine learning to predict correlations and hedge dynamically.
Popular methods include:
Pairs Trading: Hedging two correlated assets (long one, short another).
Factor Hedging: Neutralizing exposure to risk factors like size, momentum, or value.
Machine Learning Models: Adaptive algorithms that adjust hedges in real-time using data patterns.
These quantitative strategies optimize efficiency and minimize human bias, often used by hedge funds and algorithmic trading systems.
10. Dynamic Portfolio Rebalancing
Advanced hedging isn’t static. It involves dynamic rebalancing — adjusting hedge ratios as market conditions evolve. Delta changes, volatility shifts, or interest rate movements may require frequent recalibration.
Portfolio managers often use Value at Risk (VaR) and stress testing to measure and fine-tune hedge effectiveness.
11. Strategic Considerations and Risks
While advanced hedging enhances risk control, it involves challenges:
Cost: Complex derivatives carry premiums and transaction fees.
Liquidity Risk: Some instruments may be difficult to exit in volatile markets.
Model Risk: Overreliance on quantitative models can lead to misjudgments.
Counterparty Risk: OTC contracts expose traders to default risk.
Therefore, successful advanced hedging requires continuous monitoring, robust analytics, and disciplined execution.
12. Conclusion
Advanced hedging strategies form the backbone of modern risk management. By intelligently combining instruments such as futures, options, swaps, and derivatives, investors can shield their portfolios from adverse market movements while maintaining exposure to potential gains. Whether through delta hedging, cross-hedging, volatility trades, or quantitative models, the essence of advanced hedging lies in precision, adaptability, and foresight.
Trading Secrets in the Indian Market1. Understanding the Indian Market Dynamics
The first secret to successful trading in India is understanding the unique nature of its markets. The National Stock Exchange (NSE) and the Bombay Stock Exchange (BSE) dominate equity trading, while commodity and currency markets are handled by exchanges like the Multi Commodity Exchange (MCX) and NSE Currency Derivatives.
India’s markets are driven by a mix of domestic and foreign institutional investors (FIIs), retail investors, and algorithmic traders. Each group behaves differently, creating distinct patterns of price movement. For example, FIIs are often influenced by global macroeconomic trends, while retail investors react to domestic news and momentum. Recognizing which group is driving the market at any given moment helps traders align with the prevailing force rather than fight it.
2. Timing is Everything
In Indian trading, timing plays a crucial role. Unlike Western markets, Indian markets operate from 9:15 AM to 3:30 PM, with distinct phases:
Opening volatility (9:15–9:45 AM): News adjustments and overnight developments cause sharp movements.
Mid-session stability (11 AM–2 PM): Institutional participation increases, offering trend clarity.
Closing action (2:45–3:30 PM): Day traders square off positions, and short-term volatility often spikes.
Smart traders avoid jumping in at the opening frenzy unless they’re skilled scalpers. Instead, they wait for confirmation of trends in mid-session before entering trades. Many successful traders also track pre-open market data and FII-DII activity reports to anticipate the day’s direction.
3. The Secret of Volume Analysis
Volume is the footprint of smart money. In India, large institutions often accumulate or distribute shares quietly before big moves. Monitoring unusual volume spikes in less popular stocks can reveal where institutional money is flowing. Tools like the Volume Weighted Average Price (VWAP) and On-Balance Volume (OBV) help traders identify genuine accumulation versus false breakouts.
For example, if a mid-cap stock consistently trades with increasing volume and stable prices, it often signals stealth buying. Conversely, sudden volume surges after a long rally might indicate distribution — a cue for traders to be cautious.
4. News and Event Trading
The Indian market is highly news-sensitive. Announcements such as RBI policy decisions, GDP releases, corporate earnings, or even political events can cause dramatic swings. Experienced traders prepare in advance by maintaining an economic calendar and building strategies around volatility events.
For instance:
Before budget sessions, traders often position themselves in infrastructure and PSU stocks.
Before RBI rate announcements, banking and NBFC stocks are watched closely.
During election periods, volatility surges across indices, creating short-term trading opportunities.
A key secret is not to chase prices after the news breaks but to anticipate how the news will impact sentiment and position early with proper stop-losses.
5. The Role of Technical Analysis
While fundamental analysis explains why a stock should move, technical analysis shows when it will move. In India, many traders rely on technical tools like moving averages, RSI (Relative Strength Index), MACD (Moving Average Convergence Divergence), and Bollinger Bands.
However, the secret lies not in using too many indicators but in mastering a few. Seasoned traders combine price action with volume, trendlines, and support-resistance zones to create high-probability setups. The Indian market often respects round numbers and psychological levels — for example, Nifty 20,000 or Bank Nifty 45,000 — as traders set key positions there.
6. Institutional and FII Tracking
Foreign Institutional Investors (FIIs) play a massive role in market trends. When FIIs buy heavily, the market tends to rally; when they sell, corrections follow. Daily FII-DII data published by the NSE can reveal institutional sentiment.
The secret? Don’t react to one-day flows. Look for multi-day patterns. If FIIs have been net buyers for several sessions, it usually signals a bullish undertone. Retail traders can ride these institutional waves instead of betting against them.
7. Risk Management — The Hidden Power
No trading secret is more powerful than risk control. Even the best analysis fails without discipline. The Indian market, with its high intraday volatility, can wipe out profits quickly if traders neglect stop-losses.
Professional traders follow the 2% rule — never risk more than 2% of total capital on a single trade. They also use trailing stops to lock in profits as the market moves in their favor. Furthermore, diversification across sectors — IT, banking, energy, and FMCG — helps manage risk exposure during sector rotations.
8. Behavioral and Psychological Edge
Trading success in India is as much about psychology as analysis. The market thrives on fear and greed — both of which trap retail traders. The secret is to cultivate emotional discipline:
Don’t chase momentum after large moves.
Don’t panic sell during temporary dips.
Accept losses gracefully and learn from them.
Smart traders treat trading like a business — with records, reviews, and strategy adjustments. Maintaining a trading journal helps identify emotional biases and recurring mistakes.
9. Using Derivatives and Options Smartly
The derivatives segment — especially options trading — has exploded in India. Yet most retail traders lose money because they speculate without understanding volatility and time decay.
The secret is to use derivatives for hedging and strategic advantage. For example:
Buying calls on strong stocks before earnings.
Selling options in range-bound markets to earn premium decay.
Using spreads to limit risk while maintaining directional exposure.
Experienced traders track open interest (OI) data on NSE to gauge market sentiment. Rising OI with price increases signals bullish positions; falling OI indicates unwinding.
10. Learning from Market Leaders and Technology
The final secret is continuous learning and adaptation. India’s trading ecosystem evolves rapidly — with algo trading, smart order routing, and artificial intelligence now influencing prices. Staying updated with market trends, following top investors, and learning from their strategies gives traders a competitive edge.
Platforms like Zerodha Varsity, TradingView, and NSE Smart Trader offer resources to refine trading skills. Moreover, using algorithmic backtesting tools can help validate strategies before risking real capital.
Conclusion: Mastering the Indian Trading Arena
The Indian market offers immense opportunity — from booming IPOs to active derivatives and commodity trading. However, success isn’t about having inside information; it’s about mastering market behavior, timing, discipline, and strategy.
To summarize the secrets:
Study market dynamics and participant behavior.
Perfect your timing based on market phases.
Use volume to detect smart money.
Trade news with preparation, not emotion.
Keep technical analysis simple but effective.
Follow FII-DII data for institutional direction.
Protect your capital through strict risk management.
Develop emotional discipline and patience.
Use derivatives wisely for hedging and leverage.
Keep learning and adapt to technological advances.
Trading in the Indian market isn’t just about buying low and selling high — it’s about understanding why, when, and how prices move. Those who combine knowledge, discipline, and adaptability turn the market’s volatility into opportunity.
In the end, the greatest trading secret is simple: Consistency beats intensity. Small, disciplined wins every day compound into long-term success in India’s dynamic financial markets.

Derivatives and Hedging RisksIntroduction
In modern financial markets, derivatives play a crucial role in managing uncertainty and volatility. A derivative is a financial instrument whose value is derived from an underlying asset such as stocks, commodities, interest rates, currencies, or indices. These instruments are widely used by investors, corporations, and financial institutions to hedge risks, speculate on price movements, and enhance portfolio performance.
Hedging, on the other hand, refers to the practice of reducing or offsetting potential losses from adverse price movements in an asset. Derivatives are the most efficient tools for hedging because they allow traders to take positions that move inversely to their underlying exposures. Together, derivatives and hedging form the backbone of risk management strategies in global financial systems.
Understanding Derivatives
Derivatives are contracts between two or more parties whose value is based on agreed-upon financial variables. These instruments do not necessarily involve the actual buying or selling of the underlying asset. Instead, they function as financial agreements to exchange cash flows or values based on the performance of the underlying asset.
Main Types of Derivatives
Futures Contracts
Futures are standardized agreements traded on exchanges to buy or sell an asset at a predetermined price and date in the future. Futures are used extensively for hedging commodities, currencies, and indices.
Example: A farmer might sell wheat futures to lock in prices before harvest to protect against falling wheat prices.
Forwards Contracts
Forwards are similar to futures but are traded over-the-counter (OTC) and customized to suit the needs of the buyer and seller. Since they are not standardized, they carry higher counterparty risk.
Example: An importer may enter a forward contract to purchase U.S. dollars at a fixed rate three months ahead to guard against currency depreciation.
Options Contracts
Options give the holder the right, but not the obligation, to buy (call option) or sell (put option) an asset at a predetermined price before or on a specific date. Options are flexible instruments for both hedging and speculation.
Example: An investor may buy a put option on a stock to protect against a potential price decline.
Swaps
Swaps involve the exchange of cash flows between parties, often related to interest rates or currencies. The most common types are interest rate swaps and currency swaps.
Example: A company paying variable interest might enter an interest rate swap to exchange its variable payments for fixed ones, reducing exposure to interest rate fluctuations.
Purpose and Importance of Derivatives
Derivatives serve several essential functions in financial markets:
Risk Management (Hedging) – The most important function of derivatives is to mitigate risk. Investors use derivatives to protect against price changes in commodities, currencies, or securities.
Price Discovery – Futures and options markets provide valuable information about future price expectations, helping businesses plan production and investment.
Market Efficiency – Derivatives improve liquidity, allowing for more efficient capital allocation and portfolio diversification.
Leverage and Speculation – They allow investors to take large positions with smaller capital outlays, though this can increase potential losses.
Understanding Hedging
Hedging is a defensive strategy used to offset potential losses in one position by taking another position in a related derivative instrument. The goal is not to generate profit but to minimize uncertainty and protect against adverse movements.
How Hedging Works
The process of hedging typically involves identifying a risk exposure and then selecting an appropriate derivative instrument to counterbalance that risk.
For example:
An airline company concerned about rising fuel costs might use crude oil futures to lock in fuel prices.
A multinational firm expecting payment in euros might use currency forwards to secure the current exchange rate.
By doing so, these entities ensure that fluctuations in market prices do not drastically affect their financial outcomes.
Common Hedging Instruments
Futures and Forwards for Price Risk
Companies use these contracts to fix the buying or selling price of an asset. This reduces uncertainty in cash flows and budgeting.
Options for Downside Protection
Options allow investors to protect against losses while still participating in potential gains. This is often referred to as an “insurance strategy.”
Swaps for Interest Rate and Currency Risk
Swaps are commonly used by corporations to stabilize cash flows and reduce borrowing costs when dealing with fluctuating interest rates or foreign currencies.
Hedging Strategies in Practice
Commodity Hedging
Producers and consumers of commodities such as oil, gold, or wheat use futures and options to stabilize prices and manage inventory risk.
Currency Hedging
Exporters and importers use forward or futures contracts to protect against adverse exchange rate movements. This ensures predictable revenue and cost structures.
Interest Rate Hedging
Financial institutions use interest rate swaps and futures to manage exposure to changing interest rates. For instance, banks with variable-rate assets and liabilities often hedge to maintain stable margins.
Equity Hedging
Investors use options and index futures to protect portfolios from market downturns. A common approach is buying put options on indices to limit losses during a market correction.
Advantages of Using Derivatives for Hedging
Risk Reduction – The primary advantage is minimizing exposure to market volatility.
Cost Efficiency – Derivatives require smaller initial investments than directly buying or selling the underlying asset.
Flexibility – With multiple contract types and structures, hedgers can customize their risk management approach.
Liquidity and Accessibility – Exchange-traded derivatives are liquid and transparent, offering ease of entry and exit.
Risks and Limitations of Derivatives and Hedging
While derivatives are powerful tools, they also carry certain risks that must be carefully managed.
Market Risk – Prices may move unpredictably, resulting in losses even in hedged positions.
Credit (Counterparty) Risk – In OTC contracts like forwards and swaps, there is a risk that one party may default.
Liquidity Risk – Some derivatives may lack buyers or sellers, making it hard to exit positions.
Operational Risk – Errors in execution, settlement, or valuation can lead to losses.
Basis Risk – The hedge and the underlying exposure may not move perfectly in correlation, resulting in imperfect hedges.
Speculative Misuse – Derivatives can be misused for speculative purposes, amplifying losses due to high leverage.
Regulatory Framework and Risk Management
Post the 2008 financial crisis, global regulators emphasized transparency, reporting, and clearing mechanisms for derivatives. Institutions are now required to:
Use central clearinghouses for standardized contracts.
Maintain adequate collateral (margin) to cover exposures.
Conduct regular stress testing and valuation reviews.
These measures aim to reduce systemic risk and ensure that derivatives serve their intended purpose—effective risk mitigation.
Conclusion
Derivatives and hedging together represent the foundation of modern financial risk management. Derivatives provide powerful mechanisms to transfer and manage risk efficiently, while hedging strategies enable investors and corporations to protect themselves from adverse market movements. When used responsibly, derivatives help stabilize earnings, control costs, and improve financial predictability.
However, their complexity demands a deep understanding and disciplined application. Poorly designed or speculative use can lead to severe financial losses, as history has shown. The key to success lies in prudent strategy, robust regulation, and transparent practices. In essence, derivatives and hedging transform uncertainty into opportunity—offering stability in an unpredictable financial world.
Option Trading StrategiesFactors Affecting Option Prices (The Greeks)
Options are influenced by multiple variables, often referred to as Option Greeks. These measure the sensitivity of option prices to different factors:
Delta (Δ): Measures how much the option’s price changes with a ₹1 change in the underlying.
Gamma (Γ): Measures the rate of change of Delta; it indicates stability.
Theta (Θ): Represents time decay; how much the option loses in value per day.
Vega (ν): Measures sensitivity to volatility; higher volatility increases premium.
Rho (ρ): Measures sensitivity to changes in interest rates (less relevant for short-term options).
Understanding Greeks helps traders manage risk and hedging more effectively.

Part 2 Candle Stick PatternOption Writers and Their Role
Every option has a buyer and a seller (writer). The seller earns the premium but carries unlimited risk if the market moves against the position.
For example, if a trader sells a NIFTY 22,000 call and the index rises to 22,500, the seller must compensate the buyer for the 500-point move. Hence, writers usually require higher margin money and risk management discipline.

Introduction to Option Greeks and Hedging1. Understanding the Concept of Option Greeks
Option Greeks are mathematical measures derived from the Black-Scholes model and other pricing models. Each Greek represents a different dimension of risk associated with holding an option position. Collectively, they help traders understand how their portfolio will behave when market variables change. The main Greeks are Delta, Gamma, Theta, Vega, and Rho.
These metrics provide traders with a structured approach to assess risk exposure. By interpreting these values, traders can anticipate potential losses or gains when market conditions shift, allowing them to make timely adjustments through hedging.
2. Delta (Δ): Sensitivity to Price Movement
Delta measures how much the price of an option changes in response to a ₹1 (or $1) change in the price of the underlying asset.
For call options, Delta ranges between 0 and +1.
For put options, Delta ranges between 0 and –1.
For example, if a call option has a Delta of 0.6, it means that for every ₹1 increase in the stock price, the option’s price will increase by ₹0.60.
Interpretation:
A Delta close to 1 (or –1) indicates the option behaves almost like the underlying asset.
A Delta near 0 means the option is far out-of-the-money and less responsive to price changes.
Use in Hedging:
Traders use Delta to create Delta-neutral portfolios. This means the portfolio’s overall Delta equals zero, making it immune to small price movements in the underlying asset. For instance, if a trader holds call options with a total Delta of +100, they can short 100 shares of the underlying asset to neutralize price risk.
3. Gamma (Γ): Rate of Change of Delta
While Delta measures how much an option’s price changes with the underlying, Gamma measures how much Delta itself changes with a ₹1 move in the underlying.
Gamma is highest for at-the-money options and lowest for deep in-the-money or out-of-the-money options.
Interpretation:
A high Gamma means the Delta changes rapidly, leading to higher price sensitivity.
A low Gamma means Delta changes slowly, making the position more stable.
Use in Hedging:
Gamma helps traders understand how stable their Delta hedge is. For instance, if you are Delta-neutral but have high Gamma exposure, even a small move in the stock price can make your portfolio Delta-positive or Delta-negative quickly. Active traders monitor Gamma to rebalance their hedges dynamically.
4. Theta (Θ): Time Decay
Theta represents the rate at which the value of an option declines as time passes, assuming other factors remain constant.
Options are wasting assets, meaning their value decreases as expiration approaches. Theta is usually negative for option buyers and positive for option sellers.
For example, if an option has a Theta of –0.05, it will lose ₹0.05 per day due to time decay.
Interpretation:
Short-term, out-of-the-money options have faster time decay.
Long-term options lose value slowly.
Use in Hedging:
Option sellers (like covered call writers) use Theta to their advantage, as they profit from the natural erosion of time value. On the other hand, buyers may hedge against Theta decay by selecting longer-dated options or adjusting their positions as expiration nears.
5. Vega (ν): Sensitivity to Volatility
Vega measures how much an option’s price changes for a 1% change in implied volatility (IV).
Volatility reflects the market’s expectation of how much the underlying asset will fluctuate. An increase in volatility generally raises option premiums, benefiting buyers and hurting sellers.
Example:
If an option has a Vega of 0.10, a 1% rise in implied volatility will increase the option’s price by ₹0.10.
Interpretation:
Options with more time to expiration have higher Vega.
At-the-money options are more sensitive to volatility changes than deep in/out-of-the-money options.
Use in Hedging:
Traders hedge volatility exposure by taking opposite positions in options with similar Vega but different expirations or strike prices. For example, calendar spreads and straddles are often used to manage Vega risk.
6. Rho (ρ): Sensitivity to Interest Rates
Rho measures how much an option’s price changes for a 1% change in interest rates.
For call options, Rho is positive — higher rates increase their value.
For put options, Rho is negative — higher rates reduce their value.
While Rho is less impactful in short-term trading, it can influence long-term options significantly, especially when central banks alter monetary policy.
7. Combining Greeks for Effective Hedging
A successful options trader doesn’t look at any single Greek in isolation. Each Greek interacts with others, influencing risk and reward simultaneously. For example:
A position may be Delta-neutral but still exposed to Gamma and Vega risks.
Theta decay may offset Vega gains in some situations.
Therefore, professional traders use multi-Greek hedging — balancing Delta, Gamma, and Vega together to minimize exposure to market fluctuations, volatility changes, and time decay.
8. Practical Hedging Strategies Using Option Greeks
Here are some common hedging approaches that rely on understanding and adjusting Greeks:
a. Delta Hedging
The most common form of hedging. Traders adjust their stock or futures positions to offset the Delta of their options portfolio. This ensures that small price moves in the underlying have minimal impact on total portfolio value.
b. Gamma Hedging
Used by professional traders to reduce the rate at which Delta changes. This typically involves adding options positions that balance out the portfolio’s Gamma exposure, keeping Delta more stable as prices move.
c. Vega Hedging
To manage volatility exposure, traders use spreads such as calendar or diagonal spreads. These involve buying and selling options with different expiration dates or strikes to neutralize Vega.
d. Theta Management
For option buyers, Theta is a cost that must be managed by timing trades or using longer expirations. For sellers, it is a profit mechanism — hence, they may hedge Delta exposure but keep Theta positive to benefit from time decay.
9. Real-World Example
Imagine a trader buys a NIFTY call option with a Delta of 0.5, Gamma of 0.03, Vega of 0.08, and Theta of –0.04.
If the NIFTY index rises by 100 points, the option’s price should increase by approximately 50 points due to Delta. However, because of Gamma, Delta itself will rise slightly, amplifying the next move.
If market volatility increases by 1%, the option gains another 8 points from Vega. But as time passes, the option loses 4 points per day due to Theta.
By analyzing these Greeks together, the trader can anticipate how the position will behave and decide whether to hedge using futures or additional options.
10. Importance of Greeks and Hedging in Risk Management
In modern trading, understanding Option Greeks is essential not only for speculation but for risk management. They transform options from gambling instruments into sophisticated financial tools.
Delta helps manage directional exposure.
Gamma ensures stability of hedging.
Theta highlights the cost of holding positions.
Vega monitors volatility risk.
Rho prepares for interest rate shifts.
Through hedging, traders can create positions that align with their risk appetite and market outlook. The goal is not to eliminate risk entirely, but to control and balance it.
Conclusion
Option Greeks are the heartbeat of options pricing and risk management. They allow traders to quantify and predict how market variables—price, time, volatility, and interest rates—affect their positions. Mastering these Greeks is the first step toward becoming a disciplined, professional trader.
By integrating Greeks into hedging strategies, traders can protect their portfolios from adverse movements, stabilize returns, and operate with confidence in volatile markets. In essence, Greeks transform options trading from speculation into a science of probability and precision — where managing risk is as important as chasing profits.

The Relationship Between Risk and Position Size1. Understanding Risk in Trading
Risk in trading refers to the potential for financial loss on a given trade or investment. Every time you enter a trade, you expose yourself to uncertainty — the market may move in your favor, but it can also move against you.
Traders quantify risk in several ways:
Monetary Risk: The amount of money that could be lost on a trade.
Percentage Risk: The portion of total account capital that could be lost if the trade fails.
Market Risk: The possibility of price movement against your position due to volatility, news, or macroeconomic factors.
For instance, if you have a ₹100,000 trading account and you risk ₹2,000 on a single trade, your risk per trade is 2% of your capital. Managing this risk percentage is fundamental to long-term survival in the markets.
2. What Is Position Size?
Position size determines how much of your total trading capital you allocate to a specific trade. It’s not just about how many shares or contracts you buy; it’s about how much money you’re willing to risk on that position.
For example, suppose you buy 100 shares of a stock at ₹500 with a stop-loss at ₹490. Your risk per share is ₹10, and the total risk on the trade is ₹1,000 (100 shares × ₹10). If your maximum risk per trade is ₹1,000, then your position size (100 shares) aligns perfectly with your risk tolerance.
Thus, position size acts as a bridge between your risk limit and market volatility.
3. The Risk-Position Size Equation
The core relationship between risk and position size can be summarized in one simple formula:
Position Size = Account Risk Amount / Trade Risk per Unit
Where:
Account Risk Amount = (Total account balance × Percentage of risk per trade)
Trade Risk per Unit = (Entry price − Stop-loss price)
Example:
Let’s say:
Account size = ₹200,000
Risk per trade = 2% (₹4,000)
Entry = ₹1,000, Stop-loss = ₹980 (₹20 risk per share)
Then:
Position Size = ₹4,000/ ₹20 = 200 shares
This means you can safely buy 200 shares of that stock while keeping risk under 2% of your capital.
4. Why Position Sizing Is Critical
Position sizing is one of the most effective tools for controlling risk and ensuring longevity in trading. Even if you have an excellent strategy, poor sizing can wipe out your account after just a few losing trades.
Here’s why it matters:
Capital Preservation: Proper position sizing ensures you never lose too much on a single trade.
Emotional Stability: Knowing your risk in advance helps reduce emotional stress during volatile market movements.
Consistency: By maintaining a fixed risk percentage per trade, your results become more predictable and controlled.
Compounding Growth: Smaller, consistent losses allow capital to compound over time rather than being eroded by large drawdowns.
5. The Role of Stop-Loss in Position Sizing
Stop-loss orders are essential in defining how much you risk per trade. Without a stop-loss, you can’t calculate your position size accurately because you don’t know where the trade is invalidated.
When traders set their stop-loss, they define:
The maximum loss per share/unit, and
The total amount they’re willing to lose on that trade.
For instance, a wider stop-loss (say ₹50 per share) means you must take a smaller position to maintain the same total risk. Conversely, a tighter stop-loss (₹10 per share) allows for a larger position. Thus, stop-loss distance directly affects position size.
6. Fixed Fractional Position Sizing
One of the most common risk management methods is Fixed Fractional Position Sizing, where you risk a fixed percentage (usually 1–2%) of your total account on every trade.
If your account grows, your risk amount grows proportionally; if your account shrinks, the amount you risk decreases automatically. This approach ensures you adapt to both profits and drawdowns dynamically.
Example:
Account Size 2% Risk per Trade ₹ Risk Amount Stop Loss (₹10) Position Size
₹100,000 2% ₹2,000 ₹10 200 shares
₹120,000 2% ₹2,400 ₹10 240 shares
₹80,000 2% ₹1,600 ₹10 160 shares
This method helps traders scale their positions safely as they grow their capital.
7. Risk-to-Reward Ratio and Position Size
While position size controls risk, the risk-to-reward ratio (R:R) determines whether a trade is worth taking. Traders typically look for trades where the potential reward outweighs the risk — often at least 1:2 or 1:3.
For instance, if your stop-loss is ₹10 below entry and your target is ₹30 above, your R:R is 1:3. Even with a 40% win rate, you can still be profitable because your winning trades yield more than your losses.
Position sizing ensures that even if you lose multiple trades in a row, your average loss remains small, while profitable trades make up for the setbacks.
8. The Psychological Connection
Traders often underestimate the psychological comfort that comes from correct position sizing. Over-leveraging — taking oversized positions relative to account size — leads to stress, fear, and impulsive decisions. On the other hand, trading too small may limit returns and confidence.
A well-calibrated position size:
Reduces fear of loss
Prevents emotional overreaction
Builds trading discipline
Psychologically, traders who respect their risk limits are more consistent because they are not emotionally attached to single trades — they think in terms of probabilities rather than outcomes.
9. Advanced Approaches to Position Sizing
Professional traders often use adaptive or dynamic position sizing models, which adjust based on volatility, performance, or confidence level.
Volatility-Based Position Sizing: Uses tools like Average True Range (ATR) to adjust position size. If volatility increases, position size decreases to maintain consistent risk.
Kelly Criterion: A mathematical model used to maximize long-term growth by balancing risk and return.
Equity Curve-Based Adjustments: Increasing risk slightly after winning streaks or reducing it during drawdowns to manage performance-based emotions.
These methods fine-tune the balance between aggression and safety.
10. The Balance Between Risk and Opportunity
The relationship between risk and position size is about finding equilibrium — taking enough risk to grow your capital but not so much that you blow up after a few losses.
Trading is not about avoiding risk entirely; it’s about controlling and pricing it intelligently. When position sizing is aligned with your risk tolerance, trading edge, and emotional stability, you achieve consistency — the key to long-term profitability.
Conclusion
The relationship between risk and position size defines the foundation of successful trading. Without proper position sizing, even the best strategies can fail due to uncontrolled losses. By managing risk per trade, setting disciplined stop-losses, and aligning position size with account capital, traders can survive drawdowns and thrive during profitable phases.
Ultimately, trading is not about predicting every move — it’s about managing uncertainty. Position sizing transforms that uncertainty into a controlled and measurable risk, giving traders the confidence and consistency needed to succeed in any market environment.
In short: Position sizing is not just a number — it’s your safety net, your strategy, and your survival plan.
Types of Trading Strategies1. Scalping Strategy
Scalping is one of the fastest trading styles, where traders aim to profit from small price movements within very short timeframes — sometimes just seconds or minutes. Scalpers make multiple trades throughout the day, capturing small gains that can accumulate into significant profits over time.
Key Features:
Very short-term trades (seconds to minutes).
High number of trades per day.
Focus on liquidity and tight spreads.
Heavy reliance on technical indicators such as moving averages, Bollinger Bands, and volume indicators.
Advantages:
Quick results and high trading frequency.
Reduced exposure to overnight risk.
Disadvantages:
Requires constant monitoring and quick decision-making.
High transaction costs due to frequent trades.
Scalping is best suited for highly experienced traders with fast execution systems and access to low transaction fees.
2. Day Trading Strategy
Day trading involves buying and selling financial instruments within the same trading day to capitalize on intraday price movements. Traders close all positions before the market closes to avoid overnight risks like unexpected news or global events.
Key Features:
Positions last from minutes to hours.
No overnight holdings.
Heavy use of technical analysis and intraday charts like 5-minute or 15-minute timeframes.
Common Tools Used:
VWAP (Volume Weighted Average Price)
Relative Strength Index (RSI)
MACD (Moving Average Convergence Divergence)
Support and resistance levels
Advantages:
Avoids overnight market gaps and risks.
Multiple opportunities within a single session.
Disadvantages:
High emotional and mental pressure.
Requires significant time and attention during market hours.
Day trading is popular among retail traders and professionals who thrive in fast-paced environments.
3. Swing Trading Strategy
Swing trading is a medium-term strategy that aims to capture price "swings" within a trend. Traders hold positions for several days to weeks, seeking to benefit from short-term momentum.
Key Features:
Time horizon: few days to a few weeks.
Combination of technical and fundamental analysis.
Focus on trend reversals and continuation patterns.
Tools & Indicators:
Trendlines and channels
Moving averages (20, 50, 200 EMA)
Fibonacci retracement levels
Candlestick patterns
Advantages:
Less time-intensive than day trading.
Opportunity to capture larger price moves.
Disadvantages:
Exposure to overnight or weekend risks.
Requires patience and discipline.
Swing trading is ideal for part-time traders who cannot monitor the market all day but still want to actively participate in trading opportunities.
4. Position Trading Strategy
Position trading is a long-term approach where traders hold positions for weeks, months, or even years. It relies more on fundamental analysis—such as company earnings, interest rate trends, or macroeconomic indicators—than on short-term price patterns.
Key Features:
Long-term holding period.
Minimal monitoring compared to short-term trading.
Focus on underlying market fundamentals.
Examples:
Buying undervalued stocks for long-term appreciation.
Holding commodities or currencies based on economic cycles.
Advantages:
Lower transaction costs.
Reduced stress and less market noise.
Disadvantages:
Capital gets locked for longer periods.
Market reversals can lead to larger drawdowns.
Position trading suits investors with patience and a long-term vision.
5. Momentum Trading Strategy
Momentum traders aim to capture profits by trading stocks or assets showing strong price movement in one direction with high volume. The idea is to “ride the wave” of momentum until signs of reversal appear.
Key Features:
Focus on assets with strong trend and volume.
Technical indicators like RSI, MACD, and moving averages are crucial.
Entry often occurs after a breakout from key levels.
Advantages:
Can generate large profits in trending markets.
Simple concept based on market psychology.
Disadvantages:
Reversal risk: momentum can fade suddenly.
Requires strict stop-loss management.
Momentum trading is effective in volatile markets where price trends are strong and sustained.
6. Breakout Trading Strategy
Breakout trading focuses on entering trades when price breaks through a predefined support or resistance level with strong volume. The idea is that once a key level is broken, price tends to continue moving in that direction.
Key Features:
Entry upon confirmed breakout (above resistance or below support).
Stop-loss often placed near the breakout point.
Works well in trending markets.
Advantages:
Early entry in new trends.
High reward potential when breakouts are strong.
Disadvantages:
False breakouts can lead to losses.
Requires confirmation with volume and momentum indicators.
Breakout traders often use chart patterns such as triangles, flags, or rectangles to identify setups.
7. Mean Reversion Strategy
The mean reversion concept assumes that prices will eventually revert to their historical average or “mean.” Traders look for assets that have deviated significantly from their average and place trades expecting a correction.
Key Tools:
Bollinger Bands
Moving Averages
Z-score or Standard Deviation
Example:
If a stock trades far above its average price, a trader might short it expecting a pullback; if it’s below average, they might go long.
Advantages:
Works well in range-bound markets.
Statistically driven and often systematic.
Disadvantages:
Ineffective during strong trending periods.
Risk of extended deviations before mean reversion happens.
Mean reversion is popular in algorithmic and quantitative trading systems.
8. Arbitrage Strategy
Arbitrage trading exploits price differences of the same or related assets across different markets or platforms. It involves buying an asset at a lower price in one market and selling it at a higher price in another.
Types of Arbitrage:
Spatial arbitrage: Same asset on different exchanges.
Statistical arbitrage: Price inefficiencies identified through algorithms.
Merger arbitrage: Trading based on corporate event outcomes.
Advantages:
Low risk when executed properly.
Often provides consistent, small profits.
Disadvantages:
Requires large capital and fast execution systems.
Opportunities are short-lived due to market efficiency.
Arbitrage is mostly used by institutional and algorithmic traders.
9. Algorithmic (Algo) Trading Strategy
Algorithmic trading uses computer programs to execute trades automatically based on pre-defined rules and market conditions. It eliminates emotional bias and can process vast amounts of data quickly.
Key Aspects:
Quantitative models and statistical analysis.
Uses technical indicators, price action, and AI-based decision systems.
Can include high-frequency trading (HFT).
Advantages:
Precision and speed.
Emotion-free and backtestable strategies.
Disadvantages:
Requires programming knowledge and infrastructure.
High risk of system errors or overfitting.
Algo trading dominates institutional markets and is increasingly popular among advanced retail traders.
10. News-Based or Event-Driven Trading Strategy
News-based traders take advantage of volatility caused by economic releases, earnings reports, or geopolitical events. They analyze how markets react to new information and place trades accordingly.
Examples of Events:
Central bank rate decisions.
Corporate earnings announcements.
Political elections or wars.
Advantages:
High volatility offers quick profit opportunities.
Based on real-time data rather than chart patterns.
Disadvantages:
Extremely risky due to unpredictability.
Slippage and widening spreads can occur during volatile events.
This strategy requires sharp analytical skills and real-time information access.
Conclusion
Each trading strategy has its own risk, reward potential, and time commitment. Scalping and day trading suit active traders seeking quick profits, while swing and position trading cater to those preferring a more relaxed pace. Momentum and breakout strategies thrive in trending markets, while mean reversion and arbitrage strategies work in stable or range-bound conditions.
The key to successful trading lies not in using the most popular strategy, but in finding one that fits your personality, capital, time, and risk appetite. Consistent discipline, risk management, and continuous learning form the foundation of every profitable trading strategy.
Global Cues & GIFT Nifty TradingIntroduction
In today’s interconnected financial ecosystem, no market operates in isolation. Global economic events, central bank policies, geopolitical tensions, and market trends from the U.S., Europe, and Asia all influence trading sentiment in India. This interconnectedness is what we call “global cues.” Traders closely watch these cues to anticipate how the GIFT Nifty (formerly SGX Nifty) and the Indian stock markets might open or behave during the trading day.
GIFT Nifty serves as a key pre-market indicator for the Indian equity market, offering traders a glimpse into potential market direction even before the domestic markets open. Let’s explore how global cues interact with GIFT Nifty trading and shape the overall sentiment in India’s financial markets.
What Are Global Cues?
Global cues refer to signals or influences originating from international markets that impact domestic trading behavior. These cues include movements in:
Major Global Indices like the Dow Jones, S&P 500, NASDAQ, FTSE 100, Nikkei 225, Hang Seng, and DAX.
Commodity Prices, such as crude oil, gold, and base metals.
Currency Movements, particularly USD/INR, EUR/USD, and other major pairs.
Bond Yields and global interest rates.
Macroeconomic Data, including inflation, GDP growth, and employment figures from key economies.
Geopolitical Events, such as wars, sanctions, trade agreements, or political instability.
These global indicators collectively affect investor confidence, risk appetite, and capital flows — which ultimately influence Indian markets and the GIFT Nifty.
Understanding GIFT Nifty
GIFT Nifty, officially known as GIFT Nifty 50 Futures, is traded on the NSE International Exchange (NSE IX), located in the GIFT City (Gujarat International Finance Tec-City) in India. It replaced the SGX Nifty (Singapore Exchange Nifty), which was previously traded in Singapore until 2023.
The transition to GIFT Nifty marked India’s effort to bring offshore Nifty trading back within its borders, giving Indian regulators more control and transparency over derivatives linked to Indian markets.
Key features of GIFT Nifty:
Traded almost 21 hours a day, bridging Asian, European, and U.S. time zones.
Denominated in U.S. dollars, attracting foreign institutional participation.
Tracks the performance of the Nifty 50 index, India’s leading stock market benchmark.
Serves as a pre-market indicator for the direction of the Indian equity market.
Because GIFT Nifty trades while Indian markets are closed, its price movement gives traders an idea of how the Indian stock market may open the next morning.
The Role of Global Cues in GIFT Nifty Movements
GIFT Nifty is highly sensitive to global cues due to its extended trading hours overlapping with international markets. Here’s how global factors typically influence its performance:
1. U.S. Market Performance
The U.S. markets, especially indices like Dow Jones, S&P 500, and NASDAQ, play a dominant role in setting global risk sentiment. A strong rally on Wall Street often leads to bullish sentiment in Asian markets and GIFT Nifty, whereas a sharp decline usually results in bearish trends.
For instance, if the NASDAQ closes higher due to strong tech earnings, GIFT Nifty futures may rise overnight, hinting at a positive start for Indian markets.
2. Asian Market Trends
Since GIFT Nifty overlaps with Asian trading hours, performance in indices like Nikkei 225 (Japan), Hang Seng (Hong Kong), and Shanghai Composite (China) can significantly impact it. Weak Chinese data or yen fluctuations can trigger risk aversion across Asian equities, pulling down GIFT Nifty as well.
3. Crude Oil Prices
India is a major importer of crude oil. Rising oil prices increase India’s import bill, widen the current account deficit, and can fuel inflation—all negatives for the Indian economy. As a result, higher oil prices often pressure GIFT Nifty and the Indian rupee. Conversely, a sharp fall in oil prices tends to boost GIFT Nifty sentiment.
4. Currency Movements (USD/INR)
A weakening Indian rupee against the U.S. dollar usually signals foreign outflows and inflationary pressure, which dampen investor sentiment. GIFT Nifty tends to fall in such scenarios. On the other hand, a strengthening rupee supports positive sentiment and may lift GIFT Nifty.
5. U.S. Federal Reserve and Global Interest Rates
The Federal Reserve’s monetary policy decisions are closely tracked worldwide. Any hint of rate hikes or hawkish tone increases global risk aversion, leading to sell-offs in equities and a drop in GIFT Nifty. Conversely, dovish policies (rate cuts or liquidity support) boost risk-taking and lift markets globally.
6. Geopolitical Developments
Geopolitical events such as wars, trade conflicts, or sanctions can cause market volatility. For example, the Russia-Ukraine war initially led to a spike in oil prices and a global risk-off sentiment, dragging GIFT Nifty lower. Similarly, easing geopolitical tensions can trigger recovery rallies.
How Traders Use Global Cues in GIFT Nifty Trading
GIFT Nifty traders often analyze global cues to predict short-term price action and hedge positions in Indian equities. Some common strategies include:
Pre-Market Direction Prediction:
Traders track U.S. and European market closings to gauge where GIFT Nifty may open. This helps in planning trades for the Indian session.
Arbitrage Opportunities:
Since GIFT Nifty trades almost round-the-clock, traders exploit price differences between GIFT Nifty and NSE Nifty futures when domestic markets open.
Hedging FII Exposure:
Foreign institutional investors (FIIs) use GIFT Nifty to hedge their positions in Indian equities based on global risk factors.
Event-Based Trading:
Key global events like U.S. CPI data, Federal Reserve meetings, or OPEC announcements can trigger quick GIFT Nifty reactions. Traders position themselves accordingly before these announcements.
Example: How Global Cues Drive GIFT Nifty
Imagine this scenario:
The Dow Jones surges by 2% overnight on strong U.S. GDP data.
Brent crude drops below $80/barrel, easing inflation fears.
Asian markets open positive.
Result: GIFT Nifty futures jump 100–150 points, signaling a bullish opening for Indian markets the next morning.
In contrast, if:
U.S. bond yields rise sharply,
Crude oil climbs to $95/barrel, and
China reports weak factory data,
GIFT Nifty might fall 150–200 points, reflecting bearish sentiment before the Indian market opens.
Impact of Global Cues on Domestic Market Opening
Because GIFT Nifty trades overnight, it directly influences pre-market sentiment in India. News anchors and analysts frequently refer to “GIFT Nifty indicates a positive/negative start for the Indian markets.”
For example:
If GIFT Nifty is trading 100 points higher, it indicates a likely gap-up opening for Nifty 50.
If it’s 150 points lower, a gap-down opening can be expected.
This helps traders, especially intraday and short-term players, plan their strategies before the NSE opens.
The Future of GIFT Nifty and Global Integration
GIFT Nifty has strengthened India’s position in the global financial ecosystem. With extended trading hours and growing foreign participation, it acts as a bridge between Indian and international investors. As more global funds use GIFT Nifty for exposure to Indian markets, liquidity and volume are expected to rise.
Additionally, the establishment of GIFT City as a global financial hub aligns with India’s vision of becoming a major player in international finance. Over time, more derivative products linked to Indian indices and sectors may be introduced in GIFT City, further deepening market integration.
Conclusion
Global cues and GIFT Nifty trading are tightly interlinked, forming a vital part of India’s financial market ecosystem. Global economic data, geopolitical developments, commodity prices, and central bank policies directly impact GIFT Nifty’s movement — which, in turn, serves as a real-time barometer for the next day’s market sentiment in India.
For traders, understanding these relationships is essential. Those who effectively analyze global cues can make informed trading decisions, manage risk better, and anticipate market direction with greater accuracy. In essence, GIFT Nifty is not just a derivative product — it is India’s window to the world of global finance.
