Things Traders Should Avoid1. Ignoring Risk Management
One of the biggest mistakes traders make is trading without a clear risk management plan. Risk management is the backbone of trading. Without it, even the best strategies will eventually fail.
Key Errors to Avoid:
Over-leveraging: Using high leverage magnifies both profits and losses. Many traders blow up accounts by taking oversized positions.
Not using stop-loss orders: Some traders believe they can manually exit trades at the right time. In reality, markets move too fast, and emotions cloud judgment.
Risking too much on one trade: A common guideline is not to risk more than 1–2% of trading capital per trade. Ignoring this rule can wipe out months of profits in a single mistake.
No position sizing strategy: Jumping into trades with random lot sizes leads to inconsistent results.
👉 Example: Imagine a trader with $10,000 capital risks $5,000 on one trade because they feel “confident.” If the trade goes wrong, half the account is gone. Recovering from such a loss requires a 100% gain, which is extremely difficult.
2. Overtrading
Overtrading happens when traders place too many trades, often driven by greed, boredom, or revenge trading.
Mistakes Within Overtrading:
Chasing the market: Entering trades without proper signals because of fear of missing out (FOMO).
Revenge trading: After a loss, trying to “get back” money quickly by doubling positions.
Trading without rest: Markets will always offer opportunities. Overexposure reduces focus and increases mistakes.
👉 Example: A trader loses $200 on a bad trade. Instead of stopping to analyze the mistake, they place another trade with double the position size, hoping to win back losses. Often, this leads to an even bigger loss.
3. Lack of Trading Plan
Trading without a structured plan is like sailing without a compass. A trading plan defines when to enter, when to exit, how much to risk, and which strategies to follow.
Common Errors:
Random decision-making: Buying or selling based on gut feeling.
No journal keeping: Traders who don’t document their trades cannot identify patterns in their mistakes.
Constantly changing strategies: Jumping from one method to another without giving it time to work.
👉 Example: A trader buys a stock because they “heard on TV it’s going up.” Without entry rules, stop-loss, or profit target, the trade is based purely on luck.
4. Letting Emotions Control Decisions
Trading psychology is often more important than technical skills. Emotional trading leads to poor decisions.
Emotional Traps:
Fear: Prevents traders from taking good trades or causes them to exit too early.
Greed: Leads to holding onto winning positions for too long until profits disappear.
FOMO: Entering trades late because others are profiting.
Ego & overconfidence: Refusing to admit mistakes, holding onto losing trades in the hope they recover.
👉 Example: A trader buys a stock at ₹500, it rises to ₹550, but instead of booking profit, greed makes them wait for ₹600. The stock falls back to ₹480, turning profit into loss.
5. Trading Without Education
Many beginners jump into trading with little knowledge, believing they can “figure it out as they go.” This often ends in losses.
What Traders Avoid Learning:
Market fundamentals: Basic concepts like how interest rates, inflation, or company earnings affect prices.
Technical analysis: Chart patterns, indicators, and price action signals.
Risk-reward ratio: Understanding whether a trade is worth the potential risk.
Brokerage & fees: Ignoring transaction costs that eat into profits.
👉 Example: A new trader hears about “options trading” and buys random call options without knowing how time decay works. Even though the stock moves slightly in their favor, the option premium decays, and they lose money.
6. Relying Too Much on Tips & News
Traders who depend solely on TV channels, social media influencers, or WhatsApp tips rarely succeed.
Mistakes:
Acting on rumors: Many news stories are exaggerated or already priced in.
Not verifying sources: Following random advice without checking fundamentals or technicals.
Late entry: By the time news is public, smart money has already acted.
👉 Example: A trader buys a stock after hearing “strong quarterly results” on TV. But by then, the stock is already up 10%. The trader enters late and suffers when the price corrects.
7. Ignoring Market Trends
Fighting the trend is one of the costliest mistakes. Many traders try to “pick tops and bottoms” instead of riding the trend.
Errors:
Catching falling knives: Buying a stock just because it “has fallen too much.”
Selling too early in a bull run: Going short against strong upward momentum.
Not respecting price action: Ignoring charts that clearly show the trend direction.
👉 Example: During a bull market, a trader repeatedly short-sells thinking “this rally can’t last.” Each time, they lose money as the market keeps moving higher.
8. Poor Time Management
Successful trading requires patience and timing. Rushing into trades or neglecting the right timeframes leads to losses.
Errors:
Day trading without time: Traders with full-time jobs trying to scalp during lunch breaks.
Ignoring timeframes: Using a 1-minute chart for long-term investments or a daily chart for intraday scalps.
Not waiting for setups: Jumping in before confirmation.
👉 Example: A trader sees a stock forming a breakout pattern but enters early. The stock pulls back before breaking out, hitting their stop-loss.
9. Overcomplicating Strategies
Many traders load their charts with 10+ indicators, hoping for a perfect signal. In reality, complexity leads to confusion.
Mistakes:
Indicator overload: RSI, MACD, Bollinger Bands, Stochastic, all at once.
No price action focus: Forgetting that price itself is the ultimate indicator.
Constant tweaking: Changing settings after every losing trade.
👉 Example: A trader waits for five indicators to align before trading. By the time the signals confirm, the price has already moved.
10. Lifestyle & Psychological Habits to Avoid
Trading is not just about charts and strategies—it’s also about mindset and lifestyle.
Mistakes:
Lack of sleep: Fatigue reduces focus and increases impulsive decisions.
Trading under stress: Personal problems or financial pressure cloud judgment.
Unrealistic expectations: Believing trading will double money every month.
Neglecting health: Sitting for hours without breaks affects mental sharpness.
👉 Example: A trader under debt pressure tries to make “quick money” by doubling account size. Stress pushes them into risky trades, worsening the situation.
11. Not Adapting to Market Conditions
Markets are dynamic. A strategy that works in a trending market may fail in a range-bound market.
Errors:
Rigid strategies: Refusing to adapt when volatility changes.
Ignoring global events: Economic data, elections, or geopolitical tensions affect all markets.
No backtesting: Not testing strategies across different conditions.
👉 Example: A trader uses breakout strategies during low volatility. Instead of clean moves, the market fakes out, hitting stop-loss repeatedly.
12. Treating Trading Like Gambling
Trading is about probabilities, not luck. When traders treat it like a casino, losses are inevitable.
Mistakes:
All-in bets: Putting entire capital on one trade.
No analysis: Buying or selling randomly.
Relying on luck: Believing one “big trade” will make them rich.
👉 Example: A trader bets entire account on a penny stock hoping it will double. Instead, the stock crashes, wiping them out.
Conclusion
Trading can be rewarding, but only for those who avoid the common traps. The key things traders should avoid include:
Ignoring risk management
Overtrading
Trading without a plan
Emotional decision-making
Relying on tips and news
Fighting the trend
Poor time management
Overcomplicating strategies
Unrealistic expectations
The markets will always be uncertain. A trader’s job is not to predict perfectly but to manage risk, follow discipline, and protect capital. By avoiding the mistakes outlined above, traders can significantly improve their chances of long-term success.
X-indicator
AI Trading Psychology1. The Role of Psychology in Traditional Trading
Before AI, trading was primarily a human-driven endeavor. Every market move reflected the collective emotions of thousands of participants. Understanding traditional trading psychology provides the foundation for how AI modifies it.
Key Psychological Factors in Human Trading
Fear and Greed: Fear leads to panic selling; greed fuels bubbles. Together, they explain much of market volatility.
Loss Aversion: Traders hate losing money more than they enjoy making money. This leads to holding losing trades too long and selling winners too early.
Overconfidence: Many traders believe their analysis is superior, leading to risky positions and underestimating market uncertainty.
Herd Behavior: People often follow the crowd, especially in uncertain conditions, which creates manias and crashes.
Confirmation Bias: Traders seek information that supports their views and ignore contradictory evidence.
Example
During the 2008 financial crisis, fear spread faster than rational analysis. Even fundamentally strong stocks were sold off because investor psychology turned negative. Similarly, the Dot-com bubble of 2000 was fueled more by collective greed and hype than by realistic fundamentals.
In short, psychology is central to markets. AI trading challenges this dynamic by removing emotional decision-making from the execution layer.
2. How AI Transforms Trading Psychology
AI changes trading psychology in two major ways:
On the trader’s side, by reducing the emotional burden of decision-making.
On the market’s side, by reshaping collective behavior through algorithmic dominance.
AI’s Strengths in Overcoming Human Weaknesses
No emotions: AI doesn’t panic, doesn’t get greedy, and doesn’t second-guess itself.
Data-driven: It relies on massive datasets instead of gut feelings.
Consistency: It sticks to strategy rules without deviation.
Speed: It reacts in milliseconds, often before human traders even notice market changes.
Example
High-frequency trading (HFT) firms use algorithms that can execute thousands of trades per second. Their strategies rely on speed and mathematics, not human intuition. The psychological edge comes from removing human hesitation and inconsistency.
The Psychological Shift
For traders, using AI means learning to trust algorithms over instinct. This is not easy, because humans are naturally emotional and skeptical of machines making high-stakes financial decisions. The new psychological challenge is not just controlling one’s emotions but balancing trust and oversight in AI systems.
3. Human-AI Interaction: Trust, Fear, and Overreliance
One of the most important psychological dimensions of AI trading is human trust in technology. Traders must decide how much autonomy to give AI.
Trust Issues
Overtrust: Believing AI is infallible, leading to blind reliance.
Undertrust: Constantly interfering with AI decisions, which undermines performance.
Fear of the Unknown
Many traders feel anxious about “black-box AI” models like deep learning, where even developers cannot fully explain why the system makes certain decisions. This lack of transparency creates psychological unease.
Overreliance
Some traders outsource their entire decision-making process to AI. While this removes emotional interference, it also creates dependency. If the system fails or encounters unseen market conditions, the trader may be ill-prepared to respond.
Example
The 2010 Flash Crash showed the danger of overreliance. Algorithms created a cascade of selling that temporarily erased nearly $1 trillion in market value within minutes. Human oversight was slow to react because many traders trusted the machines too much.
This highlights a paradox: AI reduces human psychological flaws but introduces new psychological risks related to trust, dependence, and control.
4. Cognitive Biases in AI Trading
Although AI itself is not emotional, the humans designing and using AI systems bring their own biases into the process.
Designer Bias
AI reflects the assumptions, goals, and limitations of its creators.
For example, if a model is trained only on bullish market data, it may perform poorly in bear markets.
User Bias
Traders may interpret AI outputs selectively, aligning them with pre-existing beliefs (confirmation bias).
Some traders only follow AI signals when they match their own intuition, which defeats the purpose.
Automation Bias
Humans tend to favor automated suggestions over their own judgment, even when the machine is wrong. In trading, this can lead to dangerous blind spots.
Anchoring Bias
If an AI system provides a target price, traders may anchor to that number instead of re-evaluating based on new data.
In essence, AI does not eliminate psychological biases; it shifts them from direct decision-making to the way humans interact with AI systems.
5. Emotional Detachment vs. Emotional Influence
AI offers emotional detachment in execution. A machine doesn’t panic-sell during volatility. But human emotions still play a role in how AI systems are used.
Benefits of Emotional Detachment
Prevents irrational trades during panic.
Maintains discipline in following strategies.
Reduces stress and fatigue from constant monitoring.
The Emotional Influence Remains
Traders still feel anxiety when giving up control.
Profit or loss generated by AI still triggers emotional reactions.
Traders may override AI decisions impulsively, especially after losses.
Example
A retail trader using an AI-based trading bot may panic when seeing consecutive losses and shut it down prematurely, even if the system is statistically sound in the long run. Here, psychology undermines the benefit of AI’s discipline.
6. AI’s Psychological Impact on Market Participants
AI does not only affect individual traders—it changes the psychology of entire markets.
Increased Efficiency but Reduced Transparency
Markets with high algorithmic participation move faster and more efficiently. However, the lack of transparency in AI strategies creates uncertainty, which increases anxiety among traditional traders.
Psychological Divide
Professional traders with AI tools feel empowered, confident, and competitive.
Retail traders without access often feel disadvantaged and fearful of being exploited by machines.
Market Sentiment Acceleration
AI can amplify psychological extremes:
Positive sentiment spreads faster due to automated buying.
Negative sentiment cascades into rapid sell-offs.
This leads to shorter cycles of fear and greed, creating more volatile but efficient markets.
7. Ethical and Behavioral Implications
AI trading psychology extends into ethics and behavior.
Ethical Questions
Should traders use AI to exploit behavioral weaknesses of retail investors?
Is it ethical for algorithms to manipulate order books or engage in predatory strategies?
Behavioral Shifts
Younger traders may grow up trusting AI more than human intuition.
Traditional investors may resist, clinging to human-driven analysis.
This divide reflects not just technological adoption but also psychological adaptation to a new era of finance.
8. The Future of AI Trading Psychology
Looking ahead, AI trading psychology will continue to evolve.
Human-AI Symbiosis
The best outcomes will likely come from a hybrid approach:
AI handles execution and data analysis.
Humans provide judgment, ethical oversight, and adaptability.
Enhanced Transparency
To build trust, future AI systems may integrate explainable AI (XAI), allowing traders to understand the reasoning behind decisions. This will reduce anxiety and increase confidence.
Education and Adaptation
As traders become more familiar with AI, the psychological barriers of fear and mistrust will decline. Training in both technology and behavioral finance will be essential.
Market Psychology Evolution
Over time, collective market psychology may shift. Instead of being dominated by fear and greed of individuals, markets may increasingly reflect the programmed logic and optimization goals of algorithms. However, since humans still control AI design, psychology will never fully disappear—it will just manifest differently.
Conclusion
AI trading psychology is a fascinating blend of traditional behavioral finance and modern technological adaptation. While AI removes human emotions from execution, it introduces new psychological dynamics: trust, fear, overreliance, and ethical dilemmas.
The key insight is that psychology doesn’t vanish with AI—it transforms. Traders must now master not only their own emotions but also their relationship with algorithms. At the same time, AI reshapes the collective psychology of markets, accelerating cycles of fear and greed while creating new layers of uncertainty.
In the future, the traders who succeed will not be those who fight against AI, but those who learn to integrate human intuition with machine intelligence, balancing emotional wisdom with computational power.

Divergence SecretsHow Options Work in Real Life
Imagine buying insurance:
You pay a premium to the insurance company.
If an accident happens, you claim and get compensated.
If nothing happens, your premium is lost.
Options work the same way:
Premium = Insurance cost.
Strike Price = Insured value.
Expiry Date = Policy end date.
So, options are like insurance policies for traders!
Why Trade Options? (Advantages)
Leverage: Small capital can control a large position.
Flexibility: Profit in bullish, bearish, or sideways markets.
Hedging: Protects portfolio from big losses.
Defined Risk for Buyers: You only lose the premium paid.
Income Generation: Sellers earn premium regularly.

Demat & Trading AccountsIntroduction
If you want to invest in the stock market or hold securities in India, two terms you will always come across are Demat Account and Trading Account. These two accounts are like the backbone of modern investing. Without them, buying and selling shares in today’s electronic stock market would be nearly impossible.
Earlier, shares were held in physical form (paper certificates). If you wanted to buy or sell, you had to physically deliver these certificates to the buyer or to the exchange. This process was time-consuming, risky (due to frauds, fake certificates, theft, or loss), and created unnecessary delays. To solve this, India adopted the system of dematerialization (demat) in the 1990s.
Today, all trades in the stock market happen online using these two accounts:
Demat Account → for holding securities electronically.
Trading Account → for buying and selling them through the stock exchange.
This write-up will explore both accounts in detail, explain their importance, features, working, types, and practical role in the Indian stock market.
1. Understanding the Basics
1.1 What is a Demat Account?
A Demat Account (short for Dematerialized Account) is an account that holds your shares, bonds, mutual funds, ETFs, and other securities in electronic format.
Think of it like a bank account, but instead of holding money, it holds your financial securities. When you buy shares, they get credited to your Demat Account. When you sell, they get debited.
Example: If you buy 100 shares of Infosys, instead of getting paper certificates, these 100 shares are electronically stored in your Demat Account.
In India, Demat Accounts are maintained by Depositories:
NSDL (National Securities Depository Limited)
CDSL (Central Depository Services Limited)
These depositories hold securities, while intermediaries called Depository Participants (DPs) (like banks, brokers, or financial institutions) give investors access to open and manage accounts.
1.2 What is a Trading Account?
A Trading Account is an account that allows you to place buy or sell orders in the stock market.
You cannot directly go to NSE or BSE to buy stocks. You need a broker who provides you with a Trading Account.
Through this account, you send orders (like “Buy 10 shares of TCS at ₹3500”) which get executed on the stock exchange.
In simple words:
Trading Account = Interface between you and the stock exchange.
Demat Account = Storage for your securities.
1.3 How Demat & Trading Accounts Work Together
Both accounts are interconnected. Here’s the flow of a transaction:
You place a buy order via your Trading Account.
Money gets debited from your Bank Account.
Shares are transferred into your Demat Account.
Similarly, when you sell shares:
You place a sell order in the Trading Account.
Shares get debited from your Demat Account.
Money gets credited into your Bank Account.
Thus, three accounts are linked:
Bank Account (funds)
Trading Account (market transactions)
Demat Account (holdings)
2. History & Evolution in India
2.1 Before Demat Accounts
Shares were issued in physical form.
Transfer of ownership required endorsement and physical delivery.
Problems: Fake certificates, theft, delays in settlement, bad deliveries.
2.2 Introduction of Demat System
1996: India introduced Dematerialization under SEBI regulation.
First electronic trade took place with NSDL as the main depository.
Later, CDSL was established.
Today, more than 99% of trades in India happen in electronic form.
3. Features of Demat Account
Paperless Holding – No physical certificates, only electronic form.
Multiple Securities – Can hold shares, bonds, ETFs, government securities, mutual funds, etc.
Easy Transfer – Quick transfer of shares during buying/selling.
Safety – Reduces risk of theft, forgery, and loss.
Nomination Facility – You can nominate someone to inherit your securities.
Corporate Benefits – Dividends, bonuses, stock splits, and rights issues are automatically credited.
Accessibility – Can be accessed via online platforms, mobile apps, or brokers.
4. Features of Trading Account
Market Access – Enables buying/selling on NSE, BSE, MCX, etc.
Multiple Segments – Can trade in equity, derivatives (F&O), commodities, and currencies.
Order Types – Market order, limit order, stop-loss order, etc.
Leverage/Margin Trading – Allows intraday and margin trading.
Technology Driven – Mobile apps, algo-trading, advanced charts.
Real-Time Updates – Live prices, executed trades, P&L statements.
5. Types of Demat Accounts
Regular Demat Account – For Indian residents to hold securities.
Repatriable Demat Account – For NRIs, linked with NRE bank account.
Non-Repatriable Demat Account – For NRIs, linked with NRO bank account.
Basic Services Demat Account (BSDA) – For small investors, with low charges.
Corporate Demat Account – For companies and institutions.
6. Types of Trading Accounts
Equity Trading Account – For stocks and equity derivatives.
Commodity Trading Account – For commodities (gold, oil, agricultural products).
Currency Trading Account – For forex trading.
Derivatives Trading Account – For futures and options.
Discount Brokerage Account – For low-cost trading, minimal services.
Full-Service Brokerage Account – With advisory, research, and premium services.
7. Process of Opening Accounts
7.1 Opening a Demat Account
Steps:
Choose a Depository Participant (DP) (bank, broker, NBFC).
Fill application form (KYC).
Submit documents (Aadhar, PAN, photo, bank proof).
Sign agreement with DP.
Get your Demat Account Number (DP ID + Client ID).
7.2 Opening a Trading Account
Steps:
Choose a broker (full-service or discount).
Fill KYC & account opening form.
Link Bank Account and Demat Account.
Get Login ID & Password for online trading.
8. Charges & Costs
Demat Account Charges
Account Opening Fee (some brokers offer free).
Annual Maintenance Charges (AMC).
Transaction Charges (per debit).
Custodian Fee (rare now).
Trading Account Charges
Brokerage Fee (flat fee or percentage).
Transaction Charges (exchange fee).
Securities Transaction Tax (STT).
SEBI Turnover Fees.
GST & Stamp Duty.
9. Advantages of Demat & Trading Accounts
Convenience – Buy/sell in seconds from anywhere.
Safety – No risk of fake/lost certificates.
Transparency – Easy tracking of holdings & trades.
Liquidity – Quick conversion of investments into cash.
Integration – Bank, trading, and demat are linked.
Corporate Benefits – Automatic credit of dividends/bonus.
Access to Multiple Markets – Equity, commodity, currency, derivatives.
10. Risks & Limitations
Technical Failures – System downtime can block trades.
Fraud Risks – If login/password is misused.
Charges – Brokerage and maintenance fees can reduce profits.
Overtrading – Easy access may tempt frequent trading, leading to losses.
Cybersecurity Threats – Hacking of accounts.
11. Role of Demat & Trading Accounts in Indian Stock Market
Helped India move from paper-based to electronic system.
Improved market efficiency and liquidity.
Attracted more retail investors with easy digital access.
Essential for IPOs (Initial Public Offerings) – shares are credited only in Demat form.
Integrated with apps & online platforms (Zerodha, Upstox, Angel One, ICICI Direct, HDFC Securities, etc.).
12. Practical Example
Suppose you want to invest in Reliance Industries:
You log in to your Trading Account and place a buy order for 50 shares.
Money is deducted from your Bank Account.
After settlement (T+1 day), 50 shares appear in your Demat Account.
Later, when Reliance declares a dividend, the amount is directly credited to your Bank Account.
If Reliance issues bonus shares, they are automatically credited to your Demat Account.
This shows the smooth link between all three accounts.
13. Future of Demat & Trading Accounts in India
More digital integration with UPI, AI-based advisory, and robo-trading.
Growth in retail participation due to mobile apps.
Expansion of commodity and global investing options.
Reduced charges with increasing competition among brokers.
Enhanced cybersecurity measures for safer trading.
Conclusion
Demat and Trading Accounts have revolutionized the Indian stock market. They replaced the old paper-based system, making investing faster, safer, and more efficient.
A Demat Account stores your securities.
A Trading Account lets you buy/sell them on exchanges.
Together, they act as the gateway for every investor to participate in the financial markets.
Whether you are a beginner or an experienced trader, understanding these two accounts is the first step toward wealth creation through the stock market.
Difference Between Shares & Mutual Funds1. Introduction
Investing is one of the most powerful ways to grow wealth. However, beginners often get confused about where to invest – should they directly buy shares of a company, or should they put money into mutual funds?
Both are popular investment vehicles in India and worldwide, but they work very differently. Shares represent direct ownership in a company, while mutual funds represent indirect ownership, where a professional fund manager pools money from many investors and invests in shares, bonds, or other securities on their behalf.
Understanding the difference between the two is crucial because your choice will depend on your risk appetite, knowledge, investment horizon, and financial goals.
In this article, we will deeply explore the differences between shares and mutual funds in simple, human-friendly language.
2. What are Shares?
Definition:
A share is a unit of ownership in a company. When you buy shares of a company, you become a shareholder, which means you own a small portion of that company.
Example: If a company issues 1,00,000 shares and you buy 1,000 of them, you own 1% of the company.
Key Features of Shares:
Direct Ownership – You directly hold a piece of the company.
Voting Rights – Shareholders often get voting rights in company decisions.
Dividends – Companies may share profits with shareholders in the form of dividends.
Capital Appreciation – If the company grows, the value of your shares rises.
Types of Shares:
Equity Shares – Regular shares with ownership and voting rights.
Preference Shares – Fixed dividend, but limited voting rights.
Example:
Suppose you buy shares of Reliance Industries. If Reliance grows, launches new businesses, and earns higher profits, the value of your shares may increase from ₹2,500 to ₹3,500, giving you a good return.
But if Reliance faces losses, the share price may fall, and you can lose money.
Thus, shares are high-risk, high-reward investments.
3. What are Mutual Funds?
Definition:
A mutual fund is an investment vehicle that collects money from many investors and invests it in a diversified portfolio of shares, bonds, or other assets.
A professional fund manager decides where to invest, so you don’t have to pick individual stocks.
Key Features of Mutual Funds:
Indirect Ownership – You don’t directly own shares of companies; you own units of the mutual fund.
Diversification – Money is spread across many securities, reducing risk.
Professional Management – Experts manage your money.
Liquidity – You can redeem your units anytime (except in lock-in funds like ELSS).
Types of Mutual Funds:
Equity Mutual Funds – Invest mainly in company shares.
Debt Mutual Funds – Invest in bonds and fixed-income securities.
Hybrid Funds – Invest in a mix of equity and debt.
Index Funds – Simply track an index like Nifty 50.
Example:
Suppose you invest ₹50,000 in an HDFC Equity Mutual Fund. That money may get spread across 30–50 different stocks like Infosys, TCS, HDFC Bank, Reliance, etc. Even if one stock falls, the other stocks may balance it out.
Thus, mutual funds are moderate-risk, managed investments suitable for beginners.
4. Key Differences Between Shares & Mutual Funds
Feature Shares Mutual Funds
Ownership Direct ownership in a company Indirect ownership through fund units
Risk High (depends on single company) Lower (diversified portfolio)
Returns High potential but uncertain Moderate and stable
Management Self-managed (you decide) Professionally managed
Cost Brokerage + Demat charges Expense ratio (1–2%)
Liquidity High (buy/sell anytime in market hours) High (redeem units, except in lock-in)
Taxation Capital gains tax Capital gains tax, indexation benefit on debt funds
Knowledge Needed High (requires market understanding) Low (fund manager handles it)
5. Advantages & Disadvantages of Shares
✅ Advantages:
High return potential.
Direct ownership and control.
Dividends as additional income.
Liquidity – can sell anytime.
❌ Disadvantages:
Very risky and volatile.
Requires knowledge and research.
No guaranteed returns.
Emotional stress during market falls.
6. Advantages & Disadvantages of Mutual Funds
✅ Advantages:
Diversification reduces risk.
Managed by experts.
Suitable for beginners.
Flexible – SIP (Systematic Investment Plan) possible.
❌ Disadvantages:
Returns are moderate compared to direct stocks.
Expense ratio reduces profits.
No control over which stocks are chosen.
Some funds may underperform.
7. Which is Better for You?
If you have time, knowledge, and risk appetite, go for Shares.
If you want professional management and diversification, go for Mutual Funds.
Many investors do a mix of both – mutual funds for long-term stability and some shares for higher returns.
8. Practical Examples
Investor A buys Infosys shares for ₹1,00,000. If Infosys doubles in 5 years, he makes ₹2,00,000. But if Infosys crashes, he may end up with only ₹50,000.
Investor B puts ₹1,00,000 in a Mutual Fund that holds Infosys + 30 other stocks. Even if Infosys crashes, other stocks balance out, and his fund grows steadily to ₹1,60,000 in 5 years.
9. Conclusion
The main difference between Shares and Mutual Funds lies in direct vs. indirect ownership, risk levels, and management style.
Shares are like driving your own car – full control, high speed, but risky if you don’t know how to drive.
Mutual Funds are like hiring a driver – safer, more comfortable, but less thrilling.
For beginners, mutual funds are safer, while for experienced investors, shares offer higher growth opportunities.
Ultimately, the best strategy is to balance both according to your financial goals.
Hammer Candlestick Reversals - Bullish & Bearish Setups🔹 Intro / Overview
In this idea, we focus on the Hammer candlestick pattern — both Bullish and Bearish variations.
The Hammer is a powerful reversal signal formed with a small body, a long shadow, and defined highs/lows.
When combined with EMA High–Low Band Confirmation and swing structure, it creates rule-based trading opportunities with clear validation and devalidation rules.
---
📖 Bullish & Bearish Hammer Intro
🟢 Bullish Hammer → Appears after a downtrend / at swing low . Buyers step in strongly, rejecting lower prices.
- EMA Band should be above the candle.
- Candle High = Validation line.
- Candle Low = Devalidation line.
- Entry → Close above the High.
- Stop-Loss → Candle Low.
- Target → 1x risk, with remaining lots trailed (ATR, Fibonacci, Box Trailing).
🔴 Bearish Hammer → Appears after a uptrend / at swing high . Sellers take control after rejecting higher prices.
- EMA Band should be below the candle.
- Candle Low = Validation line.
- Candle High = Devalidation line.
- Entry → Close below the Low.
- Stop-Loss → Candle High.
- Target → 1x risk, with remaining lots trailed.
---
📌 How to Use
🟢 Bullish Hammer Spotted
- Validation → Close above the Hammer’s high.
- Devalidation → Close below the Hammer’s low. (before validation)
- SL → Hammer Low.
- Target → 1x risk, remaining lots trail with ATR/Fibonacci.
🔴 Bearish Hammer Spotted
- Validation → Close below the Hammer’s low.
- Devalidation → Close above the Hammer’s high. (before validation)
- SL → Hammer High.
- Target → 1x risk, remaining lots trail with ATR/Fibonacci.
---
🎯 Trading Plan
- Entry → On validation close (Bullish above High, Bearish below Low).
- Stop Loss → Defined by Hammer candle (Low for Bullish, High for Bearish).
- Target → First TP = 1R, Remaining lots trailed for extended moves.
---
📊 Chart Explanation
1️⃣ 🟢 Bullish Hammer Spotted
- Candle validated as price closed above the high.
- 🎯 Target 1 achieved, remaining lots managed with trailing methods. Trailing Exit could be at swing top with best trailing
2️⃣ 🛑 Bearish Hammer →
- Candle validated as price closed below the low.
- 🎯 Target 1 achieved, remaining lots managed with trailing methods. Trailing Exit could be at swing bottom with best trailing
3️⃣ 🛑 Bearish Hammer →
- ❌ Devalidated
- Candle devalidated as price closed above the high.
4️⃣ 🛑 Bearish Hammer →
-Candle validated as price closed below the low.
⛔ Stop-Loss hit
- stop loss ensures risk management and discipline in trading.
5️⃣ 🛑Bearish Hammer →
-Candle validated as price closed above the low.
- 🎯 Target 1 achieved, remaining lots managed with trailing methods. Trailing Exit could be at swing bottom with best trailing
---
👀 Observation
- Bullish Hammer → Works best after prolonged downtrend at support zones.
- Bearish Hammer → Stronger after extended uptrends or near resistance zones.
- EMA Band → Confirms market bias and filters false signals.
- Risk Management → Defined SL + structured TP protect capital and maximize reward.
---
❗ Why It Matters?
- Clear rules: Validation, Devalidation, Entry, SL, and TP.
- Combines price action (Hammer) with EMA Band confirmation.
- Ensures disciplined trading instead of emotional decisions.
- Allows both conservative and aggressive management via trailing.
---
🎯 Conclusion
The Bullish & Bearish Hammer patterns, when combined with EMA High–Low Band confirmation, provide a structured reversal trading strategy.
By following strict entry, SL, and TP rules, traders can filter false setups and capture strong reversals at swing highs and lows.
🔥 Patterns don’t predict. Rules protect. 🚀
---
⚠️ Disclaimer
For educational purposes only · Not SEBI registered · Not a buy/sell recommendation · Not financial advice — purely a learning resource.

Part 6 Learn Institutional TradingHow Options are Priced
Options are more complex than stocks because they have two value components:
Intrinsic Value = Difference between spot price and strike price (if profitable).
Time Value = Extra premium traders pay for the possibility of future moves.
The pricing is influenced by The Greeks:
Delta: Sensitivity of option price to underlying asset moves.
Theta: Time decay (options lose value as expiry nears).
Vega: Impact of volatility on option price.
Gamma: Rate of change of delta.
Understanding Greeks is essential for advanced option strategies.
Types of Options
Options exist across asset classes:
Equity Options: Stocks like Reliance, TCS, Infosys.
Index Options: Nifty, Bank Nifty, Sensex.
Currency Options: USD/INR, EUR/INR.
Commodity Options: Gold, Crude oil, Agricultural products.

Part 2 Ride The Big MovesRisks & Rewards in Options Trading
Unlike stock trading, options have asymmetric risk-reward structures:
Option Buyers: Risk limited to premium paid, but potential profit can be unlimited (for calls) or large (for puts).
Option Sellers (Writers): Profit limited to premium received, but risk can be very high if the market moves sharply.
Hence, option writing is generally done by professional traders with high capital and hedging systems.
Option Trading in India
In India, options trading is regulated by SEBI and conducted on exchanges like NSE and BSE.
Lot Sizes: Options are traded in lots (e.g., Nifty = 50 units, Bank Nifty = 15 units).
Margins: Sellers must deposit margin with brokers to cover risk.
Expiry Cycle: Weekly (indices) and monthly (stocks).
Liquidity: Index options are most liquid (Nifty & Bank Nifty).

Part 1 Ride The Big MovesTypes of Options
Options exist across asset classes:
Equity Options: Stocks like Reliance, TCS, Infosys.
Index Options: Nifty, Bank Nifty, Sensex.
Currency Options: USD/INR, EUR/INR.
Commodity Options: Gold, Crude oil, Agricultural products.
Option Trading Strategies
Options are versatile because traders can combine calls and puts for different outcomes.
Basic Strategies
Covered Call: Holding a stock and selling a call option for income.
Protective Put: Buying a put to protect stock holdings from downside.
Intermediate Strategies
Straddle: Buying both call & put at same strike → profits from volatility.
Strangle: Buying call & put at different strikes → cheaper than straddle.
Advanced Strategies
Butterfly Spread: Limited risk, limited reward strategy for range-bound markets.
Iron Condor: Selling both OTM calls & puts → income in stable markets.
Calendar Spread: Using different expiries to capture time decay.

Part 1 Master Candlestick PatternHow Options Work (Premiums, Strike Price, Expiry, Moneyness)
Every option has certain key components:
Premium: The price you pay to buy the option. This is determined by demand, supply, volatility, and time to expiry.
Strike Price: The fixed price at which the option holder can buy/sell the asset.
Expiry Date: Options are valid only for a certain period. In India, index options have weekly and monthly expiries, while stock options usually expire monthly.
Moneyness: This defines whether an option has intrinsic value.
In the Money (ITM): Already profitable if exercised.
At the Money (ATM): Strike price equals the current market price.
Out of the Money (OTM): Not profitable if exercised immediately.
Why Trade Options?
Options trading is popular because it serves multiple purposes:
Hedging: Protecting investments from adverse price movements. Example: A farmer uses commodity options to protect against falling crop prices.
Speculation: Traders can bet on market direction with limited capital.
Income Generation: Selling (writing) options like covered calls can generate steady income.
Leverage: With a small premium, traders can control large positions.

PCR Trading StrategiesIntroduction to Options Trading
The world of financial markets is vast, offering different ways to invest, trade, and manage risks. Among these instruments, Options have gained immense popularity because they offer flexibility, leverage, and unique strategies that regular stock trading cannot provide.
Options trading is not new—it has been around for decades in global markets—but in recent years, with the rise of online platforms and growing financial literacy, even retail traders are actively participating in it.
At its core, an option is a financial contract that gives the buyer the right, but not the obligation, to buy or sell an underlying asset (like a stock, index, currency, or commodity) at a predetermined price, within a certain period. This ability to choose—without compulsion—is what makes options unique compared to other financial products.
Basics of Options (Calls & Puts)
There are two main types of options:
Call Option: Gives the holder the right to buy the underlying asset at a fixed price (called the strike price) before or on the expiry date.
Example: You buy a Reliance call option with a strike price of ₹2500. If Reliance rises to ₹2700, you can buy at ₹2500 and gain from the difference.
Put Option: Gives the holder the right to sell the underlying asset at the strike price before expiry.
Example: You buy a Nifty put option with a strike price of 22,000. If Nifty falls to 21,500, your put gains in value since you can sell higher (22,000) while the market trades lower.
In simple terms:
Calls = Right to Buy
Puts = Right to Sell

Role of Brokers and Sub-Brokers in IndiaIntroduction
The Indian financial market is one of the largest and fastest-growing markets in the world, supported by a strong regulatory framework, technological adoption, and rising investor participation. Stock exchanges like the Bombay Stock Exchange (BSE) and the National Stock Exchange (NSE) are at the center of this growth, facilitating billions of trades every day. But ordinary investors cannot directly access these exchanges—there is an important intermediary system that bridges the gap between the investor and the stock market.
This intermediary system consists of stock brokers and sub-brokers, who play a pivotal role in connecting individuals and institutions to the securities market. Their functions go beyond simply buying and selling shares—they are responsible for advisory services, compliance, risk management, investor education, and ensuring fair trade execution.
In this article, we will explore in detail the role of brokers and sub-brokers in India, their regulatory framework, services, business models, challenges, and the evolving dynamics of brokerage in a digital-first economy.
Chapter 1: Understanding Brokers in India
1.1 Who is a Broker?
A stock broker is a market intermediary who is authorized to trade in securities on behalf of investors. Brokers are registered members of recognized stock exchanges like BSE, NSE, MCX, etc., and they execute buy/sell orders for clients in return for a commission or brokerage fee.
A broker can be:
Full-service broker: Offers a wide range of services including investment advice, research, portfolio management, and wealth management. Examples: ICICI Direct, Kotak Securities, HDFC Securities.
Discount broker: Focuses on low-cost trading with minimal services, leveraging technology to reduce costs. Examples: Zerodha, Upstox, Angel One, Groww.
1.2 Role of Brokers in the Indian Capital Market
The broker’s role is not limited to just order execution. Their responsibilities include:
Order Execution: Placing buy/sell orders for clients at the best possible prices.
Advisory Services: Guiding investors on market trends, stock recommendations, and investment strategies.
Research & Analysis: Providing technical, fundamental, and sectoral research reports.
Compliance & KYC: Ensuring client KYC, anti-money laundering (AML) checks, and regulatory compliance.
Risk Management: Monitoring margin requirements, exposure limits, and preventing defaults.
Investor Education: Conducting webinars, training, and knowledge sessions for retail investors.
Chapter 2: Understanding Sub-Brokers in India
2.1 Who is a Sub-Broker?
A sub-broker is an agent or franchisee who works under a registered broker to provide access to clients. Unlike brokers, sub-brokers are not direct members of the stock exchange. They act as local representatives of big brokerage houses, extending their services to smaller towns and cities.
For example: A small-town investor in Uttar Pradesh may trade via a sub-broker of ICICI Direct or Angel One, instead of directly connecting with the central brokerage.
2.2 Functions of Sub-Brokers
Client Acquisition: Bringing in new investors from local regions.
Client Servicing: Assisting clients with account opening, trade execution, and documentation.
Relationship Management: Maintaining trust and long-term relations with investors.
Education: Guiding first-time investors about markets and trading platforms.
Revenue Sharing: Earning a portion of brokerage generated by clients they onboard.
2.3 Sub-Broker vs Authorized Person (AP)
Earlier, SEBI recognized “sub-brokers” as intermediaries. However, since 2018, the concept of sub-brokers has been merged with the category of Authorized Persons (APs).
A sub-broker license is no longer issued.
New intermediaries now register as Authorized Persons under brokers, making the system simpler and more transparent.
Chapter 3: Regulatory Framework Governing Brokers and Sub-Brokers
3.1 SEBI Regulations
The Securities and Exchange Board of India (SEBI) regulates all brokers and sub-brokers in India. Key responsibilities include:
Registration of brokers and APs.
Setting capital adequacy requirements.
Ensuring fair practices and investor protection.
Monitoring brokerage charges.
Enforcing compliance, penalties, and suspensions when required.
3.2 Stock Exchanges’ Role
Exchanges like NSE and BSE maintain:
Membership eligibility criteria.
Trading and risk management systems.
Grievance redressal mechanisms for clients.
3.3 Compliance Requirements for Brokers
Net Worth Requirements: Minimum net worth for full-service and discount brokers.
Deposits: Security deposits with stock exchanges.
KYC Norms: Adherence to KYC and AML regulations.
Audit Reports: Submission of financial and compliance audits.
Chapter 4: Services Offered by Brokers and Sub-Brokers
4.1 Trading Facilities
Equity delivery & intraday trading.
Futures & options (F&O) derivatives trading.
Commodity trading (MCX, NCDEX).
Currency derivatives.
4.2 Investment Services
Mutual funds distribution.
IPO investments.
Bonds, debentures, and government securities.
Portfolio management services (PMS).
4.3 Research & Advisory
Technical charts, indicators, and patterns.
Fundamental analysis of companies.
Sectoral & macroeconomic research.
Personalized advisory for HNIs (High Net Worth Individuals).
4.4 Technology & Platforms
Modern brokers offer:
Mobile trading apps.
Algo-trading and APIs.
AI-based portfolio analysis.
Robo-advisory services.
Chapter 5: Business Models of Brokers and Sub-Brokers
5.1 Brokerage Fee Models
Percentage-based brokerage: Charged as % of transaction value (common in full-service brokers).
Flat-fee brokerage: Fixed fee per trade (popular with discount brokers like Zerodha, Groww).
5.2 Revenue Sharing Model with Sub-Brokers/APs
Sub-brokers earn a percentage (30–60%) of the brokerage generated by their clients.
Larger franchisees with bigger client bases get better revenue-sharing ratios.
5.3 Value-Added Services
Insurance distribution.
Wealth management.
Research subscriptions.
Chapter 6: Importance of Brokers and Sub-Brokers in India
Market Access: Enable lakhs of investors to trade without being direct members of exchanges.
Financial Inclusion: Expand capital market reach to tier-2 and tier-3 cities.
Liquidity Creation: More participants = higher market liquidity.
Investor Education: Teach first-time traders about risks and opportunities.
Compliance & Safety: Safeguard investors through regulated trading systems.
Chapter 7: Challenges Faced by Brokers and Sub-Brokers
Competition from Discount Brokers: Traditional brokers face pricing pressure.
Regulatory Burden: Constant compliance requirements increase costs.
Technological Upgradation: Need to invest heavily in digital platforms.
Client Defaults & Fraud: Risk of misuse of margin or client funds.
Thin Margins: Reduced brokerage rates have lowered profitability.
Chapter 8: Future of Brokers and Sub-Brokers in India
Shift to Technology: AI, machine learning, and algo-trading adoption.
Rise of Discount Brokers: Market share shifting to low-cost platforms like Zerodha & Groww.
Hybrid Model: Combination of advisory + low-cost execution.
Financial Inclusion: Deeper penetration in rural India through APs and digital platforms.
Global Integration: Indian brokers offering access to global equities, ETFs, and commodities.
Conclusion
Brokers and sub-brokers (or Authorized Persons) form the backbone of India’s stock market ecosystem. They democratize access to markets, educate investors, provide liquidity, and ensure regulatory compliance. Over the decades, their role has evolved from traditional floor-based trading to digital-first platforms, with a growing emphasis on low-cost execution, technology, and advisory services.
While discount brokers are reshaping the competitive landscape, full-service brokers and sub-brokers remain vital for personalized services, financial literacy, and expanding market reach. The future will likely see a convergence of technology, advisory, and financial inclusion, making brokers and sub-brokers even more crucial in India’s journey toward becoming a global financial powerhouse.

Types of Market ParticipantsIntroduction
Financial markets are vast ecosystems where millions of transactions take place daily, involving buyers, sellers, intermediaries, regulators, and institutions. Each participant plays a unique role, and together, they form the lifeblood of the global economy. Just like any well-functioning system, financial markets rely on a diverse group of actors whose motives range from profit-making, hedging risks, raising capital, or ensuring stability and liquidity.
In simple terms, market participants are all the individuals, institutions, and entities that engage in trading financial instruments—stocks, bonds, derivatives, currencies, commodities, and more. Their presence ensures that markets remain liquid, efficient, and capable of transmitting signals about economic health.
Understanding the types of market participants is essential for traders, investors, policymakers, and students of finance. Different participants bring different motivations and strategies: while some seek long-term value, others look for short-term profits; while some provide regulation and order, others bring in liquidity. This dynamic interaction creates both opportunities and risks in markets.
This article provides a comprehensive exploration of the various types of market participants, categorized based on their roles, objectives, and influence.
Broad Categories of Market Participants
Before diving deep, let’s break down the broad categories:
Individual Investors / Retail Participants
Institutional Investors
Market Intermediaries (Brokers, Dealers, Exchanges, etc.)
Hedgers and Arbitrageurs
Speculators and Traders
Regulators and Policymakers
Issuers (Corporates and Governments)
Foreign Investors and Global Participants
High-Frequency Traders and Algorithmic Players
Market Makers and Liquidity Providers
Now, let’s discuss each in detail.
1. Individual Investors (Retail Participants)
Retail investors are individuals investing their personal funds in financial markets. They usually trade smaller amounts compared to institutions, but collectively they represent a massive pool of capital.
Characteristics of Retail Investors:
Use their own money (not pooled funds).
Investment horizon varies (short-term, medium-term, long-term).
Motivated by wealth creation, savings growth, retirement planning.
Increasingly influenced by technology (mobile apps, online trading platforms).
Types of Retail Investors:
Active traders: Regularly buy and sell securities for quick gains.
Passive investors: Prefer long-term investments like index funds or mutual funds.
Speculative retail investors: Engage in options, futures, and cryptocurrencies.
Role in the Market:
Retail investors enhance liquidity, provide diversity of opinion, and influence sentiment-driven movements. However, they are often more vulnerable to volatility and herd behavior.
2. Institutional Investors
Institutional investors are large organizations that invest on behalf of others. They have access to substantial capital, advanced research, and professional expertise.
Types of Institutional Investors:
Mutual Funds: Pool money from many investors to invest in diversified portfolios.
Pension Funds: Manage retirement savings and invest for long-term returns.
Insurance Companies: Invest premiums collected from policyholders to earn returns.
Sovereign Wealth Funds (SWFs): State-owned funds that invest national reserves.
Endowments and Foundations: Manage funds for universities, NGOs, and charities.
Characteristics:
Hold significant influence over markets.
Long-term investment horizon, though some engage in active trading.
Often considered more stable than retail investors.
Role in the Market:
Institutional investors are stabilizers of financial markets due to their deep pockets and diversified holdings. However, their concentrated moves can create big shifts in asset prices.
3. Market Intermediaries
Market intermediaries are the connectors that facilitate transactions. Without them, buyers and sellers would struggle to find each other efficiently.
Types of Intermediaries:
Stockbrokers: Act as agents executing trades on behalf of clients.
Dealers: Trade securities for their own accounts and provide liquidity.
Exchanges: Platforms like NSE, BSE, NYSE, NASDAQ, which match buyers and sellers.
Clearinghouses: Ensure settlement of trades and manage counterparty risk.
Depositories: Safekeep securities in electronic form (e.g., NSDL, CDSL in India).
Investment Banks: Help companies raise capital via IPOs, debt issues, mergers, and acquisitions.
Role in the Market:
Intermediaries ensure market efficiency, transparency, and liquidity. They are essential in maintaining trust and smooth functioning.
4. Hedgers
Hedgers are participants who enter markets primarily to reduce risk exposure. They are not focused on profit-making from price changes but on safeguarding their core business or portfolio.
Examples:
A farmer using futures contracts to lock in crop prices.
An airline hedging against fuel price volatility.
An investor using options to protect a stock portfolio from downturns.
Role in the Market:
Hedgers bring stability by offsetting risks. Their activity increases demand for derivative instruments and makes markets more complete.
5. Speculators and Traders
Speculators take on risk in pursuit of profit. Unlike hedgers, they actively seek to benefit from price fluctuations.
Types of Traders:
Day Traders: Buy and sell securities within the same day.
Swing Traders: Hold positions for days/weeks to capture short-term trends.
Position Traders: Hold longer-term bets based on fundamental analysis.
Options/Futures Traders: Engage in derivatives for leverage and profit opportunities.
Role in the Market:
Speculators add liquidity and price discovery. They take risks that others (hedgers) want to avoid. However, excessive speculation can increase volatility.
6. Arbitrageurs
Arbitrageurs exploit price differences of the same asset in different markets.
Examples:
Buying a stock on NSE while simultaneously selling it on BSE if there’s a price gap.
Using currency arbitrage in Forex markets.
Exploiting futures-spot price differences.
Role in the Market:
Arbitrageurs eliminate pricing inefficiencies, keeping markets aligned and fair. They are critical to maintaining balance.
7. Regulators and Policymakers
Markets cannot function smoothly without oversight. Regulators set the rules, monitor activities, and prevent malpractice.
Examples:
SEBI (India): Securities and Exchange Board of India.
SEC (USA): Securities and Exchange Commission.
RBI (India): Regulates currency and banking markets.
CFTC (USA): Commodity Futures Trading Commission.
Roles of Regulators:
Protect investors.
Ensure transparency and fair play.
Prevent frauds, insider trading, and market manipulation.
Stabilize markets during crises.
8. Issuers (Corporates and Governments)
Issuers are entities that raise capital from markets by issuing securities.
Types:
Corporates: Issue equity (shares) or debt (bonds, debentures) to fund growth.
Governments: Issue bonds and treasury bills to finance expenditure.
Municipalities: Issue municipal bonds for infrastructure projects.
Role in the Market:
Issuers are the suppliers of investment products. Without them, there would be nothing to trade.
9. Foreign Investors and Global Participants
Globalization has turned local markets into international ones.
Types:
Foreign Institutional Investors (FIIs): Large funds investing in emerging markets.
Foreign Portfolio Investors (FPIs): Individuals or institutions buying foreign stocks/bonds.
Multinational Corporations: Investing cross-border for expansion.
Role:
Foreign investors bring in capital, liquidity, and global integration, but also add volatility when they withdraw funds during crises.
10. High-Frequency Traders (HFTs) and Algorithmic Participants
With technology, machines are now major participants.
Characteristics:
Use algorithms and superfast systems.
Trade thousands of times in milliseconds.
Seek to exploit micro-price differences.
Role:
HFTs improve liquidity and tighten bid-ask spreads but raise concerns about flash crashes and systemic risks.
Conclusion
The financial market is not just about numbers and charts—it is about participants with diverse objectives interacting to create opportunities, manage risks, and allocate resources. From retail investors saving for retirement to sovereign wealth funds shaping national strategies, from hedgers protecting against volatility to high-frequency traders running algorithms at lightning speed—each plays a vital role.
A proper understanding of types of market participants gives clarity about how markets work, why they move the way they do, and how risks and rewards are distributed. Just like a symphony requires different instruments, financial markets require this variety of participants to function harmoniously.
Part 2 Trading Master ClassPsychology of Options Trading
Discipline and patience are crucial. Many beginners lose money because they:
Over-leverage.
Ignore volatility.
Fail to manage positions.
Professional traders rely on data-driven strategies, not emotions.
Conclusion
Options trading strategies are powerful tools that allow traders to tailor risk and reward according to their outlook. From simple long calls and puts to complex spreads and condors, each strategy has its place in the trader’s toolkit. The key is to understand market conditions, implied volatility, and risk tolerance.
In essence, options trading is like a chess game in the financial markets—requiring foresight, planning, and strategic execution. Traders who master options can generate income, hedge portfolios, and take advantage of unique opportunities that stocks alone cannot offer.
Why Use Options?
Options provide traders with:
Leverage: Control a large position with a smaller investment.
Flexibility: Create strategies for any market scenario.
Risk Management: Hedge against adverse price movements.
Income Generation: Sell options to collect premium.

Part 2 Support and ResistanceWhy Use Options?
Options provide traders with:
Leverage: Control a large position with a smaller investment.
Flexibility: Create strategies for any market scenario.
Risk Management: Hedge against adverse price movements.
Income Generation: Sell options to collect premium.
Simple Options Trading Strategies
These strategies are suitable for beginners. They involve limited positions and simple risk-reward profiles.
Long Call
Outlook: Bullish
How it works: Buy a call option when expecting price to rise.
Risk: Limited to premium paid.
Reward: Unlimited upside.
Example: Stock trading at ₹100, buy a call with strike ₹105 for ₹3 premium. If stock rises to ₹120, profit = (120–105–3) = ₹12.
Long Put
Outlook: Bearish
How it works: Buy a put option when expecting price to fall.
Risk: Limited to premium paid.
Reward: Potential profit increases as price drops (limited to strike price minus premium).
Example: Stock at ₹100, buy a put strike ₹95 for ₹2. If stock falls to ₹85, profit = (95–85–2) = ₹8.
Covered Call
Outlook: Neutral to mildly bullish
How it works: Own stock and sell a call against it.
Risk: Downside risk in stock, upside capped at strike.
Reward: Earn premium income.
Protective Put
Outlook: Hedge
How it works: Own stock and buy a put to protect downside.
Risk: Limited (stock downside hedged).
Reward: Unlimited upside, protection from losses.

Algorithmic & Quantitative TradingIntroduction
Trading has evolved dramatically over the past few decades. From the days of shouting bids in open-outcry pits to today’s ultra-fast trades executed in milliseconds, technology has transformed how markets operate. Two of the most important concepts in this transformation are algorithmic trading and quantitative trading.
At their core, both involve using mathematics, statistics, and technology to make trading decisions instead of relying purely on human judgment. While traditional traders might rely on intuition, news, and gut feeling, algo and quant traders build rules, models, and systems to trade with consistency and efficiency.
In this comprehensive guide, we’ll dive into:
The basics of algorithmic & quantitative trading.
Their differences and overlaps.
The strategies they use.
The technologies and tools behind them.
Risks, challenges, and regulatory aspects.
The future of algo & quant trading.
By the end, you’ll understand how these forms of trading dominate global financial markets today.
1. Understanding Algorithmic Trading
Definition
Algorithmic trading (often called algo trading) is the process of using computer programs and algorithms to automatically place buy or sell orders in financial markets. The algorithm follows a set of predefined instructions based on variables like:
Price
Volume
Timing
Technical indicators
Market conditions
The key idea is automation: once the rules are programmed, the system executes trades without manual intervention.
Why Algorithms?
Speed: Computers can process data and execute trades in milliseconds, far faster than humans.
Accuracy: Algorithms eliminate emotional decision-making.
Efficiency: They can scan thousands of instruments simultaneously.
Consistency: Strategies are applied without deviation or hesitation.
Examples of Algo Trading in Action
A program that buys stock when its 50-day moving average crosses above its 200-day moving average.
A system that places trades when prices deviate 1% from fair value in futures vs. spot markets.
High-frequency algorithms that profit from microsecond price differences across exchanges.
2. Understanding Quantitative Trading
Definition
Quantitative trading (quant trading) uses mathematical and statistical models to identify trading opportunities. Instead of intuition, it relies on data-driven analysis of price patterns, volatility, correlations, and probabilities.
In simple words:
Algo trading = How trades are executed.
Quant trading = How strategies are designed using math and data.
Many traders combine both: they design quantitative strategies and then execute them algorithmically.
Why Quantitative?
Markets are complex and noisy. Statistical models help filter out randomness.
Data-driven strategies can uncover hidden opportunities humans can’t easily spot.
Backtesting allows quants to test ideas on historical data before risking real money.
Quantitative Models Used
Mean Reversion Models – assuming prices return to their average over time.
Trend-Following Models – capturing momentum in markets.
Statistical Arbitrage Models – exploiting mispricings between correlated assets.
Machine Learning Models – using AI to adapt and predict market moves.
3. Algo vs. Quant Trading: Key Differences
Although often used interchangeably, there are subtle differences:
Feature Algorithmic Trading Quantitative Trading
Focus Execution of trades using automation Strategy design using math & statistics
Tools Algorithms, order routing systems Models, statistical analysis, simulations
Objective Speed, precision, automation Finding profitable patterns
Example VWAP (Volume Weighted Average Price) execution algorithm Pairs trading based on correlation
In practice, quant trading often leads to algo trading:
Quants design models.
Those models are turned into algorithms.
Algorithms execute trades automatically.
4. Key Strategies in Algorithmic & Quantitative Trading
Both algo and quant trading employ a wide variety of strategies. Let’s explore them in depth.
A. Trend-Following Strategies
Based on the belief that prices tend to move in trends.
Uses tools like moving averages, momentum indicators, and breakout levels.
Example: Buy when 50-day MA > 200-day MA (Golden Cross).
B. Mean Reversion Strategies
Assumes prices revert to their average over time.
Tools: Bollinger Bands, RSI, Z-score analysis.
Example: If stock deviates 2% from its mean, bet on reversal.
C. Arbitrage Strategies
Exploit price discrepancies between related securities.
Statistical Arbitrage – trading correlated assets (like Coke vs. Pepsi).
Merger Arbitrage – trading on price gaps during acquisitions.
Index Arbitrage – between index futures and underlying stocks.
D. Market-Making Strategies
Provide liquidity by continuously quoting buy and sell prices.
Profit comes from the bid-ask spread.
Requires ultra-fast systems.
E. High-Frequency Trading (HFT)
Subset of algo trading with extremely high speed.
Millisecond or microsecond execution.
Often used for arbitrage, market making, and exploiting tiny inefficiencies.
F. Machine Learning & AI-Based Strategies
Use large datasets and predictive models.
Neural networks, reinforcement learning, and deep learning applied to market data.
Example: Predicting volatility spikes or option price movements.
G. Execution Algorithms
These are not designed to predict prices but to optimize order execution:
VWAP (Volume Weighted Average Price) – executes in line with average traded volume.
TWAP (Time Weighted Average Price) – spreads order evenly over time.
Iceberg Orders – hides large orders by breaking them into small chunks.
5. Tools & Technologies Behind Algo & Quant Trading
Trading at this level requires robust infrastructure.
A. Data
Historical Data – for backtesting strategies.
Real-Time Data – for live execution.
Alternative Data – satellite images, social media, news sentiment, credit card usage, etc.
B. Programming Languages
Python – easy, rich libraries (pandas, numpy, scikit-learn).
R – strong for statistics and visualization.
C++/Java – high-speed execution.
MATLAB – research-heavy environments.
C. Platforms
MetaTrader, NinjaTrader, Amibroker – retail algo platforms.
Interactive Brokers API, FIX protocol – institutional-grade.
D. Infrastructure
Low-latency servers close to exchange data centers.
Cloud computing for scalability.
Databases (SQL, NoSQL) to handle terabytes of data.
6. Advantages of Algo & Quant Trading
Speed – execute trades in milliseconds.
Emotion-Free – avoids greed, fear, panic.
Backtesting – test before risking capital.
Diversification – manage thousands of instruments simultaneously.
Liquidity Provision – improves market efficiency.
Scalability – one strategy can be deployed globally.
7. Risks & Challenges
Despite advantages, algo & quant trading face serious risks.
A. Market Risks
Models might fail during extreme market conditions.
Example: 2008 financial crisis saw many quant funds collapse.
B. Technology Risks
Latency issues.
Software bugs leading to erroneous trades (e.g., Knight Capital loss of $440M in 2012).
C. Overfitting in Models
A strategy may look profitable in historical data but fail in real-time.
D. Regulatory Risks
Authorities impose strict rules to avoid market manipulation.
Example: SEBI in India regulates algo orders with checks on co-location and latency.
E. Ethical Risks
HFT firms sometimes exploit slower participants.
Raises fairness concerns.
8. Algo & Quant Trading in Global Markets
US & Europe: Over 60-70% of equity trading is algorithmic.
India: Around 50% of trades on NSE are algorithm-driven, with growing adoption.
Emerging Markets: Adoption is slower but rising as infrastructure improves.
Major players include:
Citadel Securities
Renaissance Technologies
Two Sigma
DE Shaw
Virtu Financial
9. Regulations Around Algo Trading
Different regulators have implemented measures:
SEC (US) – Market access rule, risk controls for algos.
MiFID II (Europe) – Transparency and monitoring of algo strategies.
SEBI (India) – Approval for brokers, limits on co-location, kill switches for runaway algos.
The aim is to balance innovation with market stability.
10. The Future of Algo & Quant Trading
The next decade will see major shifts:
AI & Deep Learning – self-learning trading models.
Quantum Computing – solving optimization problems faster.
Blockchain & Smart Contracts – decentralized, transparent execution.
Alternative Data Explosion – satellite data, IoT, ESG metrics.
Retail Algo Access – democratization through APIs and brokers.
Markets will become more data-driven, automated, and technology-intensive.
Conclusion
Algorithmic and quantitative trading represent the intersection of finance, mathematics, and technology. Together, they have reshaped global markets by making trading faster, more efficient, and more complex.
Algorithmic trading focuses on execution automation.
Quantitative trading focuses on designing mathematically-driven strategies.
From trend-following to machine learning, from VWAP execution to HFT, these approaches dominate today’s trading world.
However, with great power comes great risk—overreliance on models, tech glitches, and ethical debates remain.
Looking ahead, advancements in AI, alternative data, and quantum computing will further revolutionize how markets operate. For traders, investors, and policymakers, understanding these dynamics is crucial.
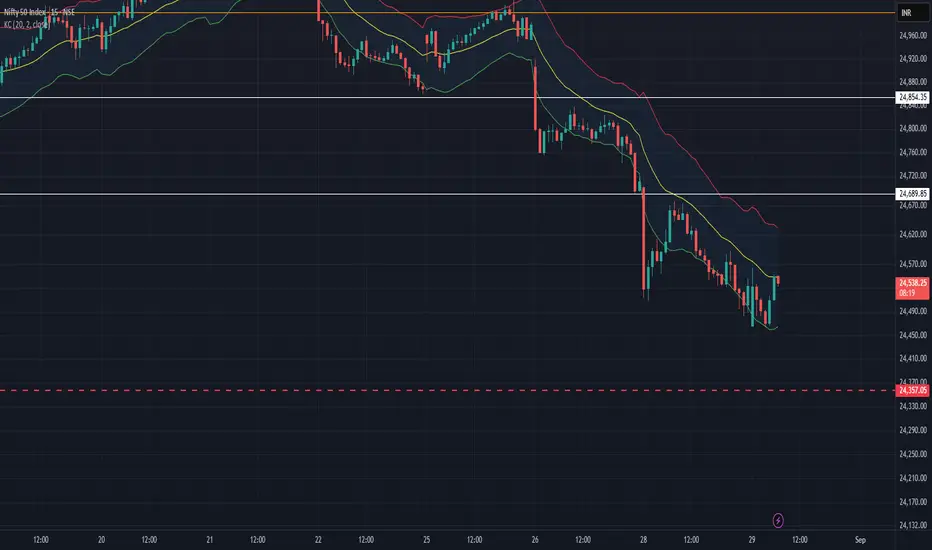
next support for niftyNifty continues to face selling pressure at higher levels.
Immediate support is now seen at 24,357. There can be sharp bounce from this level be cautious
Part 1 Master Candlestick PatternOptions in the Indian Stock Market
In India, options trading is booming, especially in:
Nifty & Bank Nifty (Index options).
Stock Options (Reliance, TCS, HDFC Bank, etc.).
👉 Interesting fact: Over 90% of trading volume in NSE comes from options today.
Expiry days (Thursdays for weekly index options) see massive action, as traders bet on final movements.
The Power of Weekly Options
Earlier, only monthly options were available. Now NSE has weekly expiries for Nifty, Bank Nifty, and even stocks.
Weekly options = cheaper premiums.
Traders use them for intraday or short-term bets.
But time decay is very fast.

Part 4 Institutional Trading Simple Option Strategies
Options allow creativity. Instead of just buying/selling, traders create strategies by combining calls & puts.
a) Protective Put
Buy stock + Buy Put option = Insurance against downside.
b) Covered Call
Own stock + Sell Call option = Earn income if stock stays flat.
c) Straddle
Buy Call + Buy Put (same strike, same expiry) = Profit from big moves either way.
d) Strangle
Buy OTM Call + OTM Put = Cheaper than straddle but requires bigger move.
e) Iron Condor
Sell OTM Call + OTM Put, while buying further OTM options = Profit if market stays in range.
These are just a few. Professional traders use dozens of strategies depending on market condition.
Risks in Options Trading
Options are attractive, but risky too.
Time Decay (Theta) → Every day, options lose value as expiry approaches.
Wrong Direction → If your view is wrong, you lose the premium.
Liquidity Risk → Some strikes may have no buyers/sellers.
Over-Leverage → Small premium tempts traders to overtrade, leading to big losses.

Part 1 Ride The Big MovesKey Terminologies in Options
Before diving deeper, you need to know the “language of options.”
Strike Price → The fixed price at which you can buy/sell (like 2500 in Reliance example).
Premium → The cost you pay to buy an option.
Expiry Date → Options have a life—weekly, monthly, quarterly. After expiry, they are worthless.
Lot Size → Options are not traded in single shares. They come in fixed quantities called lots (e.g., Nifty lot size = 50).
In the Money (ITM) → Option has intrinsic value.
Out of the Money (OTM) → Option has no value (only time value).
At the Money (ATM) → Strike price = Current market price.
How Option Prices Are Decided
Option premiums are not random. They are influenced by:
Intrinsic Value (IV) → Difference between current price and strike price.
Example: Reliance at ₹2600, Call 2500 → Intrinsic value = ₹100.
Time Value → More time till expiry = higher premium.
Volatility → If a stock is volatile, options are expensive because chances of big movement are high.
Interest rates & Dividends → Minor but relevant in longer-term options.

F&O Trading & SEBI Regulations1. Introduction
The Indian stock market has seen remarkable growth over the last few decades, and one of the most fascinating areas of this growth has been in derivatives trading. Derivatives are financial instruments that derive their value from an underlying asset, and in India, the most widely traded derivatives are Futures and Options (F&O).
F&O trading allows investors and traders to participate in the price movement of stocks, indices, and commodities without necessarily owning them. It provides opportunities to hedge risks, speculate, and arbitrage.
However, with great power comes great responsibility. The Securities and Exchange Board of India (SEBI)—the market regulator—plays a crucial role in ensuring that F&O trading does not turn into a high-risk gamble for unsuspecting investors. SEBI lays down strict rules and guidelines to maintain market integrity, protect investors, and reduce systemic risks.
This article will give you a comprehensive understanding of F&O trading and SEBI’s regulations governing it.
2. Understanding Derivatives
Before diving into F&O, let’s clarify what derivatives are.
A derivative is a financial contract whose value depends on the performance of an underlying asset. In India, the underlying assets include:
Equity shares (like Reliance, Infosys, HDFC Bank)
Stock indices (like Nifty 50, Bank Nifty)
Commodities (like gold, crude oil)
Currencies (like USD/INR)
Types of derivatives:
Forwards – Customized contracts between two parties, traded over-the-counter (OTC).
Futures – Standardized contracts traded on exchanges like NSE & BSE.
Options – Contracts that give the right, but not the obligation, to buy or sell an asset.
Swaps – Mostly used in currency and interest rate markets.
In India, Futures and Options are the most liquid and popular derivative instruments, especially in the stock market.
3. What is F&O Trading?
3.1 Futures
A Futures contract is an agreement to buy or sell an underlying asset at a predetermined price on a specific date in the future.
Example: If you buy Nifty Futures at 20,000 today, you are betting that Nifty will be above 20,000 on the expiry date.
If Nifty rises to 20,500, you make a profit.
If Nifty falls to 19,500, you incur a loss.
3.2 Options
An Options contract gives the buyer the right but not the obligation to buy or sell the underlying asset at a predetermined price.
Two types of options:
Call Option (CE): Right to buy.
Put Option (PE): Right to sell.
Example:
If you buy Reliance Call Option at ₹2,500 strike, you profit if Reliance moves above ₹2,500.
If you buy Reliance Put Option at ₹2,500 strike, you profit if Reliance falls below ₹2,500.
Options also have premium, strike price, and expiry terms.
3.3 Why do people trade F&O?
Hedging: Protecting investments from adverse price movements.
Speculation: Betting on price movements for profit.
Arbitrage: Exploiting price differences between markets.
Leverage: Controlling large positions with small capital.
4. Growth of F&O Trading in India
The Indian F&O market has grown tremendously since it was introduced in 2000. NSE and BSE both offer equity derivatives, but NSE has emerged as the dominant player.
Key reasons for popularity:
High liquidity in index derivatives like Nifty 50 & Bank Nifty.
Opportunity for intraday traders to capture price swings.
Low margin requirements compared to cash market.
Availability of weekly options.
However, SEBI has also noticed risks—especially from retail investors treating F&O like gambling, leading to heavy losses. Reports show that nearly 9 out of 10 retail traders lose money in F&O trading.
This has pushed SEBI to tighten regulations.
5. SEBI’s Role in Regulating F&O
The Securities and Exchange Board of India (SEBI) is the watchdog of Indian financial markets. Its mission is to:
Protect investor interests.
Promote fair and efficient markets.
Regulate intermediaries and stock exchanges.
Minimize systemic risks.
For F&O trading, SEBI has set strict rules, margins, disclosures, and eligibility criteria.
6. SEBI Regulations on F&O Trading
Let’s explore the major regulations SEBI has imposed:
6.1 Eligibility of Stocks for Derivatives
Not all stocks can be traded in F&O. To qualify:
The stock must have a minimum market capitalization of ₹5,000 crore.
Average daily traded value should be high.
Adequate liquidity must exist.
Price band restrictions and surveillance mechanisms should be applicable.
This ensures that only liquid and stable stocks are allowed in F&O.
6.2 Contract Specifications
SEBI mandates standardization of contracts:
Lot size: Minimum notional value (₹5-10 lakhs).
Expiry: Monthly & weekly expiries.
Strike intervals: Based on stock/index price range.
Tick size: ₹0.05 for equity derivatives.
This standardization prevents manipulation.
6.3 Margin Requirements
Margins are crucial in derivatives as they are leveraged products.
Types of margins:
SPAN Margin – Based on risk of position.
Exposure Margin – Additional buffer.
Premium Margin – For option buyers.
Mark-to-Market (MTM) Margin – Daily settlement of gains/losses.
This ensures that traders have skin in the game and cannot default.
6.4 Risk Mitigation Measures
Daily price bands for stocks in derivatives.
Position limits for clients, members, and FIIs.
Ban periods for stocks crossing OI (Open Interest) limits.
Intraday monitoring of margins and positions.
6.5 Disclosure Requirements
Brokers must give risk disclosure documents before enabling F&O trading.
Investors must sign an agreement acknowledging risks.
Margin details and exposure reports are sent via SMS/email daily.
6.6 Segregation of Clients’ Funds
Brokers must segregate their own funds from clients’ funds. Misuse of client collateral is strictly prohibited.
6.7 Investor Protection & Education
SEBI regularly issues advisories warning retail traders about F&O risks.
Investor education campaigns (e.g., “Options are not lottery tickets”).
Free online resources for risk management.
7. SEBI’s New Regulations (Recent Developments)
In the last few years, SEBI has tightened norms further:
Peak Margin Reporting (2021):
Traders must maintain full margin upfront.
No more leveraging via intraday tricks.
Intraday Leverage Ban (2022):
Brokers cannot offer more than 20% margin funding.
This reduced excessive speculation.
Increased Disclosure of F&O Risks (2023-24):
Exchanges must display warnings showing percentage of retail traders losing money.
Eligibility Tightening (2023):
SEBI proposed reviewing stocks in derivatives regularly. Illiquid stocks may be excluded.
Investor Suitability Check (2024 Proposal):
Only financially literate and risk-capable investors may be allowed in F&O in future.
8. Benefits of SEBI Regulations
Market Stability: Prevents manipulation and speculation bubbles.
Investor Protection: Safeguards retail traders from blind gambling.
Transparency: Standardized contracts and disclosure norms.
Risk Management: Margins and limits reduce systemic collapse.
Trust in Markets: Encourages more participation in regulated environment.
9. Challenges & Criticisms
Despite SEBI’s efforts, challenges remain:
Retail Traders’ Losses: Majority still lose money due to lack of knowledge.
Over-regulation Concerns: Some argue SEBI rules reduce liquidity.
Complexity: F&O remains difficult for beginners despite regulations.
Broker Malpractices: Some brokers mis-sell options strategies to clients.
Speculative Craze: Many traders treat weekly options like gambling.
10. Future of F&O Trading in India
Looking ahead:
F&O will remain the largest contributor to market volumes.
SEBI may bring financial literacy tests before allowing retail traders.
More focus on institutional participation and reducing retail over-exposure.
Increased use of AI-driven surveillance to detect manipulation.
Potential restrictions on weekly options if speculation rises.
Conclusion
Futures and Options trading is an exciting and powerful tool in the financial markets, offering opportunities for hedging, speculation, and arbitrage. But it is also risky, especially for retail investors without proper knowledge and discipline.
The Securities and Exchange Board of India (SEBI) plays a vital role in ensuring that F&O trading remains fair, transparent, and not a casino for retail investors. Its regulations on eligibility, margins, disclosures, and risk management are designed to create a balance between freedom and protection.
As India’s capital markets continue to grow, SEBI’s regulations will evolve further. Traders must remember that regulations are not restrictions but safeguards—helping ensure that markets grow sustainably while protecting investors.
The future of F&O in India is bright, but only if traders approach it with knowledge, discipline, and respect for risk management.

Part 3 Trading Master ClassHow Options Work in Practice
Let’s take a real-life relatable scenario:
👉 Suppose you think Nifty (20,000) will rise in the next week.
You buy a Nifty Call Option 20,200 Strike at premium ₹100.
Lot size = 50, so total cost = ₹5,000.
Now:
If Nifty goes to 20,400 → Your option is worth ₹200 (profit ₹5,000).
If Nifty stays at 20,000 → Option expires worthless (loss = ₹5,000).
So, with only ₹5,000, you controlled exposure worth ₹10 lakhs. That’s leverage.
Participants in Options Market
There are four main categories of traders:
Call Buyer → Expects price to go UP.
Call Seller (Writer) → Expects price to stay flat or go DOWN.
Put Buyer → Expects price to go DOWN.
Put Seller (Writer) → Expects price to stay flat or go UP.

Divergence SecretsOptions vs Futures
Futures = Obligation to buy/sell at fixed price.
Options = Right but not obligation.
Options require smaller margin (if buying).
Real-Life Example of Hedging
Suppose you own TCS shares worth ₹10 lakhs. You fear the market may fall in the next month.
👉 Solution: Buy a Put Option.
Strike: Slightly below current market price.
Cost: Small premium.
If market falls → Loss in shares covered by profit in Put.
If market rises → You lose premium but enjoy profit in shares.
This is like insurance.
Psychology of Options Trading
Options require quick decision-making. Traders often get trapped in:
Over-leverage → Buying too many lots.
Greed → Holding positions too long.
Fear → Exiting too early.
Successful option traders follow discipline, risk management, and proper strategy.
