Institutional Option Trading Institutional Option Trading
Institutional option trading involves using options as part of sophisticated strategies to hedge risk, enhance returns, or speculate.
Objectives of Institutional Option Trading
Hedging: Protecting large portfolios against market downturns.
Income Generation: Selling options to collect premiums.
Speculation: Taking directional bets with options.
Arbitrage: Exploiting price inefficiencies across markets.
Common Institutional Option Strategies
Covered Call Writing: Selling call options against stock holdings to generate income.
Protective Puts: Buying puts to insure portfolios against downside risk.
Spreads (Vertical, Horizontal, Diagonal): Limiting risk while aiming for a defined profit range.
Straddles and Strangles: Betting on volatility, regardless of market direction.
Iron Condors: Selling out-of-the-money calls and puts to profit from low volatility.
X-indicator

Institutional Option Trading Part -5Institutional Option Trading
Institutional option trading involves using options as part of sophisticated strategies to hedge risk, enhance returns, or speculate.
Objectives of Institutional Option Trading
Hedging: Protecting large portfolios against market downturns.
Income Generation: Selling options to collect premiums.
Speculation: Taking directional bets with options.
Arbitrage: Exploiting price inefficiencies across markets.

Institutional Option Trading Part -6Institutional trading and investing significantly differ from retail activities. Institutions trade in large volumes, use complex strategies, and have access to exclusive information and tools. This guide will provide a comprehensive overview of institutional option trading, investing, and general trading practices, detailing their methodologies, tools, and market impacts.
Understanding Institutional Investors
Institutional investors include mutual funds, hedge funds, pension funds, insurance companies, and large banks. These entities manage vast sums of money, often on behalf of others, and possess substantial market influence.
Key Characteristics:
Large Capital Base: Institutions trade in millions or billions.
Market Influence: Their trades can impact prices significantly.
Professional Resources: Access to cutting-edge research, proprietary algorithms, and high-speed trading platforms.

Put Call Ratio (PCR) Explained in Simple TermsWhat is PCR?
The Put-Call Ratio (PCR) is a popular market sentiment indicator used in option trading. It helps traders understand whether more people are buying put options (bearish bets) or call options (bullish bets) at a given time.
Put Options: Contracts betting the price will go down.
Call Options: Contracts betting the price will go up.
How to Read PCR?
PCR < 1: More call options → Bullish sentiment.
PCR > 1: More put options → Bearish sentiment.
PCR = 1: Neutral sentiment.
But extreme values often suggest the opposite:
Very High PCR: Possible market reversal upwards (too many bearish bets).
Very Low PCR: Possible market reversal downwards (too many bullish bets).
Example:
Put OI: 5,00,000 contracts
Call OI: 10,00,000 contracts
PCR = 5,00,000 / 10,00,000 = 0.5 → This indicates bullish sentiment.
Why PCR Matters?
Helps identify market mood (bullish or bearish).
Gives contrarian signals (overcrowded trades can reverse).
Used in option trading strategies for timing entry and exit.

Learn Institutional Trading Pros and Cons
Pros: Early signals, useful for reversals.
Cons: Requires confirmation, may produce false signals.
Technical Trading
What is Technical Trading?
Technical trading focuses on using historical price data, volume, and technical indicators to predict future price movements. Traders use charts and patterns instead of company fundamentals.
Key Tools in Technical Trading
Price Charts: Candlestick, line, bar charts.
Indicators: Moving averages, RSI, MACD, Bollinger Bands.
Chart Patterns: Head and Shoulders, Triangles, Double Tops, Flags.
Support and Resistance Levels: Key price points where stocks reverse.

Learn Institutional Trading Part-10What is Divergence?
Divergence occurs when the price of a stock and an indicator (like RSI, MACD, or momentum indicators) move in opposite directions. It is often considered a warning that the current trend may be losing strength.
Types of Divergence
Regular Divergence:
Indicates potential trend reversal.
Example: Price makes a new high, but RSI makes a lower high.
Hidden Divergence:
Indicates trend continuation.
Example: Price makes a higher low, but RSI makes a lower low.
How to Use Divergence
Combine with support and resistance levels.
Confirm with volume and candlestick patte

Learn Institutional Option Trading Part-4Recent Growth of Options in India:
Retail participation has surged.
Weekly expiry options (especially on Bank Nifty) have become extremely popular.
SEBI introduced lot size and margin regulations to control excessive speculation.
Investing in India
What is Investing?
Investing means allocating money into assets like stocks, mutual funds, bonds, gold, or real estate to earn returns over time.
Major Investment Options in India:
Equities (Shares)
Mutual Funds
Fixed Deposits
Public Provident Fund (PPF)
Gold (Physical and Digital)
Real Estate
Bonds and Debentures

Learn Institutional Option Trading Part-3In India, options are traded primarily on:
NSE (National Stock Exchange)
BSE (Bombay Stock Exchange)
The Securities and Exchange Board of India (SEBI) regulates the derivatives market and ensures fair practices.
Why is Option Trading Popular in India?
Leverage: Traders can control large positions with small capital.
Hedging: Investors use options to protect their portfolios from market fluctuations.
Income Generation: Strategies like covered calls can provide regular income.
Speculation: Traders can bet on price movements with limited risk.

Institutions Option Database Trading Part-6Deep Dive into Options Basics (For Data Traders)
Options are contracts giving the right but not the obligation to buy or sell an asset at a certain price before a set date. They are used for hedging, speculation, and generating income.
🛠️ Two Types:
Call Option: Right to buy an asset.
Put Option: Right to sell an asset.
Backtesting means testing a strategy using past data to check performance. Key for data-driven option trading.
Example:
Load 1-year option chain data for BANKNIFTY.
Apply rules: Buy Call when IV drops by 10% & PCR < 0.8.
Check PnL for each trade.
Filter for success rate > 65%.

Institutions Option Database TradingDatabase Option Trading is a powerful blend of market logic and data science. With structured data, intelligent scanning, and strategic execution, traders gain a massive edge over emotional/manual decisions. This approach is ideal for traders aiming for consistent performance, lower drawdowns, and systematic growth. The more you code, automate, and analyze—the better you trade.
Sample Strategy - PCR + OI Spike
Strategy Logic:
If PCR > 1.3 and Call OI Spike at ATM > 15%, initiate a Put Sell.
Exit when PCR drops below 1.1 or OI unwinds.
Backtest Results (NIFTY Options):
Win Rate: 72%
Avg Profit per Trade: ₹4800
Max Drawdown: ₹9800

Long Term Database TradingHow Institutions Use Option Databases
🔍 Institutional Insights:
Banks & HFTs (High-Frequency Traders) run option strategies over petabytes of data.
Real-time arbitrage opportunities are found using option databases.
They model Vega, Theta & IV impact per stock and expiry.
Example Institutional Workflow:
Pull 10 years of NIFTY options.
Train ML model to predict next-day IV.
Execute based on high-probability straddles/strangles.
Exit before expiry using trailing delta hedge.

Database Trading Introduction to Database Option Trading
Database Option Trading is an advanced strategy where traders use massive historical and real-time market data stored in structured databases to identify profitable option trades. Unlike conventional trading, this approach focuses on data-driven decision-making—leveraging algorithms, statistics, and pattern recognition rather than pure technical/fundamental analysis.
2. The Role of Data in Option Trading
Types of Data Used:
Option Chain Data: Strike prices, premiums, LTP, OI, IV, volume.
Historical Data: Past price action, volatility, Greeks, PCR.
Sentiment Data: FII/DII positions, news sentiment.
Real-Time Market Feeds: Tick-by-tick updates.
Macroeconomic Data: Interest rates, inflation, events.

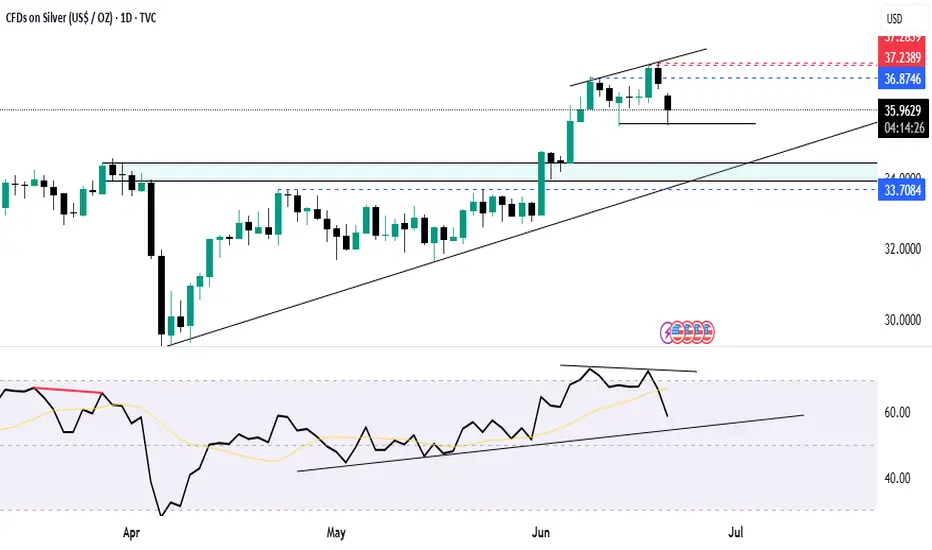
SILVER 1D🔹 Silver Technical View
🔸 Timeframe:
🔸 Bias:
🔸 Strategy:
🧠 Key Levels Marked on Chart
Below 35.56 can see 34.40/34.00
Above 36.50 can see 37.90+
Slow movements in forexUSDJPY is bullish or bearish or sideways.
Whatever it is, focus on your strategy and size.
Everyday progress is process of becoming big, not profits.
#usdjpy #usd #gold #xauusd #forex

Option Trading How Institutions Operate:
Use Option Greeks (Delta, Gamma, Theta, Vega) for precise positioning
Follow OI (Open Interest) data for liquidity zones
Monitor FIIs/DII data from NSE reports
Combine options with futures arbitrage or cash segment hedging
🔹 Tools Used by Institutions:
Bloomberg Terminal
Custom-built Quant Models
NSE Option Chain + IV Analysis
Algo-driven trading based on volatility signals

Learn Institution Trading What is Institutional Option Trading?
It refers to large-scale option strategies used by hedge funds, banks, and FIIs to manage risk, hedge portfolios, or create directional bets with high precision.
🔹 Key Institutional Strategies:
Buy-Write (Covered Call):
Holding stocks and selling calls to earn premium.
Protective Put:
Buying puts as insurance to hedge stock positions.
Multi-leg Spreads (Iron Condor, Butterfly):
Neutral strategies to profit from range-bound markets.
Put-Call Ratio Analysis (PCR):
Gauging market sentiment from institutional flow.

Advanced Divergence Trading What is Divergence?
Divergence happens when the price moves in the opposite direction of an indicator (like RSI, MACD, or Momentum). It signals a possible trend reversal or trend weakening.
🔹 Types of Divergence:
Regular Divergence (Trend Reversal):
Bullish: Price makes lower lows, but indicator makes higher lows → Reversal up
Bearish: Price makes higher highs, but indicator makes lower highs → Reversal down
Hidden Divergence (Trend Continuation):
Bullish: Price makes higher lows, indicator makes lower lows → Trend continuation up
Bearish: Price makes lower highs, indicator makes higher highs → Trend continuation down
🔹 Advanced Tips:
Use on higher timeframes for accuracy
Confirm with volume, trendlines, or price action
Combine with support/resistance or Fibonacci zones
🔹 Pro Tools to Use:
RSI (Relative Strength Index)
MACD (Moving Average Convergence Divergence)
Stochastic Oscillator
OBV (On Balance Volume)

Support and Resistance Support Level:
A price level where demand is strong enough to prevent the price from falling further. It's like a floor—buyers enter here expecting prices to rise.
Example: If Nifty falls to 22,000 repeatedly and bounces back, 22,000 becomes a support level.
🔹 Resistance Level:
A price level where selling pressure overcomes buying, preventing prices from rising. It's like a ceiling—sellers dominate at this level.
Example: If Bank Nifty rises to 50,000 but fails to move above, 50,000 is resistance.
📊 How to Identify Them:
Historical price charts
Trendlines
Moving averages
Fibonacci levels
Volume analysis
📈 Use in Trading:
Buy near support
Sell near resistance
Use breakout strategy when price breaches either level

Advanced Institutions Option Trading - Part 10Option Pricing Models
Institutions rely on theoretical models to value options precisely.
Models Used:
Black-Scholes Model: Most common for European Options
Binomial Model: For American options
Monte Carlo Simulations: For complex path-dependent options
Bachelier Model: For negative rate scenarios
These models help forecast fair value, hedge ratios, and profit probabilities.
🔹 17. Algorithmic and Quant Option Trading
Institutional desks often use automation for efficiency.
Tools & Techniques:
Python, R, C++ for strategy coding
Machine Learning for volatility prediction
Option Flow Analysis (Unusual Orders)
Real-time Gamma Exposure Mapping
Quant desks track Volga, Vanna, Charm, and other second-order Greeks for precise hedging.

Advanced Institutions Option Trading - Part 8Institutional Option Trading Strategies
Let’s dive deeper into how big players operate:
🔶 Volatility Arbitrage:
Take advantage of IV mispricing across strikes/months.
Long low IV, short high IV – Net neutral delta.
🔶 Dispersion Trading:
Buy individual stock options, short index options.
Profit from correlation divergence.
🔶 Box Spread (Synthetic Arbitrage):
Arbitrage between synthetic long/short positions.
Very low risk, used by HFT desks.
Institutions use algorithms to run thousands of such strategies in real time.

Advanced Institutions Option Trading - Part 4 Technical and Fundamental Analysis in Option Trading
Fundamental Analysis: Evaluate company value, earnings, sector performance
Technical Analysis: Price action, patterns, indicators like RSI, MACD
IV & HV Tools: Helps in choosing optimal strike prices based on volatility
Understanding market structure is essential for timing entries/exits in options.
Advanced Institutional Options Trading
Institutions like hedge funds, banks, and proprietary desks use options for complex strategies:
Delta Hedging: Maintain a neutral position
Portfolio Insurance: Using puts during economic downturns
Volatility Arbitrage: Capitalizing on volatility mispricing
Structured Products: Combine options with bonds or equities for customized payoff
These strategies require deep understanding of volatility surfaces, risk models, and massive capital.

Advanced Institutions Option TradingFinancial Market is a marketplace where assets such as stocks, bonds, commodities, and derivatives (like options) are bought and sold.
Key components:
Equity Markets – Shares of companies
Debt Markets – Government or corporate bonds
Derivatives Market – Futures, Options
Currency and Commodity Markets
Options are financial contracts giving the buyer the right (not obligation) to buy/sell an asset at a set price before a specific date.
✅ Types of Options:
Call Option: Right to Buy
Put Option: Right to Sell
✅ Key Terminologies:
Strike Price: Agreed price to buy/sell
Premium: Cost of the option
Expiration Date: Validity of the contract
ITM/ATM/OTM: In-the-money / At-the-money / Out-of-the-money

Advanced Put Call Ratio (PCR)Slide 1: Introduction to Advanced Put Call Ratio (PCR)
The Put Call Ratio (PCR) is a widely used sentiment indicator in options trading. It measures the volume or open interest of put options relative to call options. Advanced analysis of PCR helps traders gauge market sentiment—whether fear or greed is dominant—and anticipate potential reversals or continuations.
Slide 2: Basic Formula and Types
PCR Formula:
Volume-based PCR = Total Put Volume / Total Call Volume
Open Interest-based PCR = Total Put OI / Total Call OI
Interpretation:
PCR > 1: Bearish sentiment (more puts)
PCR < 1: Bullish sentiment (more calls)
Key Types:
Index PCR – NIFTY, BANKNIFTY PCR
Stock PCR – For individual stocks
Slide 3: Advanced Interpretation of PCR
1. Contrarian Indicator:
Very high PCR (e.g., >1.5): Indicates excess fear, potential reversal upward
Very low PCR (e.g., <0.6): Indicates extreme optimism, potential market correction
2. Trend Confirmation:
Stable rising PCR in uptrend = Confirmed strength
Falling PCR in downtrend = Confirmed weakness
3. Divergence Signal:
If prices rise but PCR also rises → underlying caution (hidden bearishness)
If prices fall but PCR drops → lack of fear (hidden bullishness)
Slide 4: Using PCR with Other Tools
Combine PCR with:
Volume & OI Data – To confirm trader positions
Implied Volatility (IV) – High PCR + high IV = fear-based overreaction
Support/Resistance Levels – Look for breakout confirmations
Technical Indicators – RSI, MACD, VWAP with PCR for enhanced edge
