Divergence SecretsOption Greeks: Measuring Sensitivity
The Option Greeks are metrics that measure how different factors affect an option’s price. The key Greeks include:
Delta: Change in option price relative to the underlying asset’s price.
Theta: Time decay effect.
Vega: Sensitivity to volatility changes.
Gamma: Rate of change of Delta.
Rho: Sensitivity to interest rates.
These Greeks help traders understand risk exposure and manage positions scientifically. For example, a trader might use Theta to manage time decay in short-term options or Vega to hedge against volatility spikes. Mastery of Greeks is crucial for professional option traders who aim for consistency and precision.
X-indicator

Option Trading Leverage and Speculation in Option Trading
Options provide leverage, allowing traders to control large positions with small investments. For instance, buying a single call option can represent ownership of 100 shares, magnifying both profits and losses. Speculators use this leverage to capitalize on short-term market moves. However, leverage also increases risk—if the market moves against the position, the entire premium can be lost. Successful speculators use strict risk management, combining analysis of volatility, momentum, and time decay to optimize entries and e

Part 1 Intraday Trading Master ClassOption Premium and Its Components
The premium is the price paid to acquire an option contract. It consists of two parts: intrinsic value and time value. Intrinsic value reflects the actual profitability if exercised immediately, while time value represents the potential for further profit before expiry. Several factors influence premiums—especially implied volatility (IV), time to expiration, and interest rates. Higher volatility generally increases premiums since potential price swings make the option more valuable. Traders analyze these components using models like Black-Scholes to determine fair value. Understanding premium behavior helps in selecting the right option strategy, whether to buy undervalued options or sell overvalued ones.

Part 2 Intraday Master ClassHedging and Risk Management with Options
One of the main uses of options is hedging, or protecting against adverse price movements. For example, a portfolio manager might buy put options on stocks to guard against potential losses during market declines. This acts like insurance—limiting downside while keeping upside potential. Options can also hedge currency, interest rate, or commodity exposure. However, hedging isn’t free; the premium cost reduces overall returns. Smart traders use hedging selectively, balancing risk and cost. In volatile markets, effective hedging with options can prevent significant capital erosion and ensure stability in long-term investment strategies.

Part 12 Trading Master ClassThe Role of the Strike Price and Expiry Date
Each option contract includes a strike price and an expiry date. The strike price determines the level at which the asset can be bought or sold, while the expiry date sets the time limit. The relationship between the strike price and the market price determines whether an option is in-the-money (ITM), at-the-money (ATM), or out-of-the-money (OTM). As expiry nears, the option’s time value decreases—a concept known as time decay. Short-term options lose value faster, while long-dated ones retain time premium longer. Successful option traders always monitor how close prices are to the strike and how much time remains to expiry before making or exiting trades.

Part 11 Trading Master ClassCall and Put Options Explained
A Call Option gives the buyer the right to purchase an asset at a specific price (strike price) before or on the expiry date. Investors buy calls when they expect the asset’s price to rise. Conversely, a Put Option gives the buyer the right to sell the asset at the strike price, used when expecting a price fall. Sellers of options (writers) have obligations—call writers must sell, and put writers must buy if exercised. The interplay between call and put options allows for complex strategies, such as spreads and straddles. Understanding how both function is vital for predicting market direction and building profitable positions.

Part 10 Trade Like Institution Understanding the Concept of Options
Option trading involves financial contracts that give buyers the right, but not the obligation, to buy or sell an underlying asset—like a stock, index, or commodity—at a predetermined price within a specific period. The two main types are Call Options (buy rights) and Put Options (sell rights). Unlike owning shares directly, options let traders speculate on price movements with limited capital. The right to buy or sell comes at a cost known as the premium. Options are widely used for hedging, speculation, and income generation. Their value is influenced by factors such as volatility, time decay, and market sentiment. Understanding these dynamics helps traders manage risk and seize market opportunities efficiently.

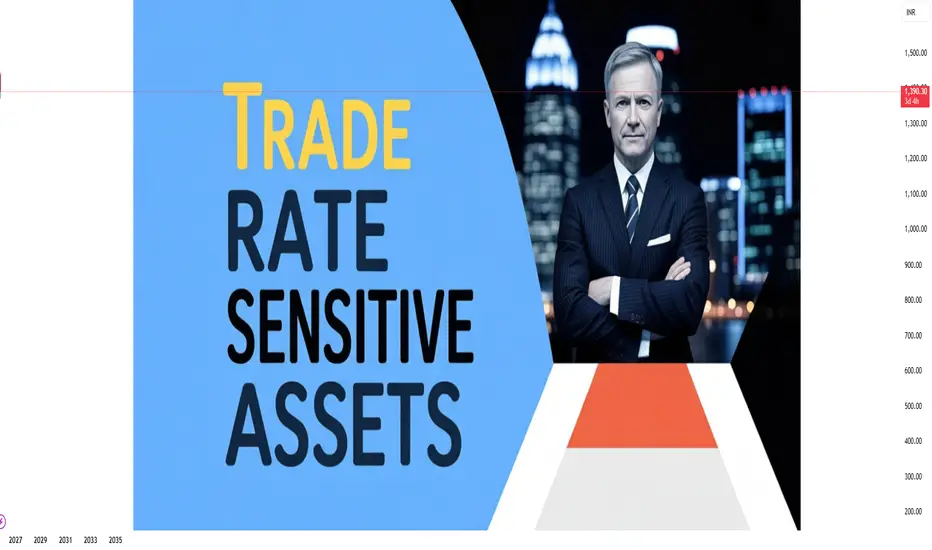
Trade Rate Sensitive Assets: An In-depth Analysis1. Understanding Trade Rate Sensitive Assets
Trade rate sensitive assets refer to financial instruments or investments whose values fluctuate in response to changes in interest rates, trade volumes, or trade-related policies. The term combines two dimensions:
Interest Rate Sensitivity: Many financial assets, particularly fixed-income securities like bonds and debentures, exhibit price fluctuations when market interest rates change.
Trade Sensitivity: Assets involved in international trade, export-import businesses, or commodities often respond to shifts in trade policies, tariffs, currency fluctuations, and global demand-supply dynamics.
In essence, trade rate sensitive assets are influenced by both monetary factors (interest rates) and macroeconomic factors (trade activities).
2. Key Types of Trade Rate Sensitive Assets
A. Fixed-Income Securities
Bonds, debentures, and other debt instruments are classic examples of trade rate sensitive assets. Their prices are inversely related to interest rate movements. When interest rates rise, existing bonds with lower coupon rates lose market value, and vice versa.
Government Bonds: These are highly sensitive to interest rate changes due to their low risk and fixed coupon payments.
Corporate Bonds: The sensitivity varies depending on the credit rating and maturity period of the bond.
Treasury Bills (T-Bills): Short-term instruments whose yields are directly impacted by central bank rate changes.
Example: Suppose an investor holds a 10-year government bond paying 5% interest. If market rates rise to 6%, the bond’s market price falls because new bonds offer higher returns.
B. Equities of Interest Rate-Sensitive Sectors
Certain industries and companies are more affected by interest rate changes due to their capital structure, borrowing requirements, or trade exposure.
Financial Institutions: Banks and insurance companies are sensitive to interest rate fluctuations because they affect loan demand, net interest margins, and investment income.
Real Estate Companies: High debt dependency makes them vulnerable to rising interest rates.
Export-Oriented Industries: Companies engaged in international trade are sensitive to trade policies, tariffs, and currency exchange rates.
Example: A company exporting electronic goods to the US may experience profit fluctuations if rising interest rates in the US strengthen the dollar against the local currency.
C. Foreign Exchange and Trade-Linked Assets
Assets denominated in foreign currencies, or those linked to international trade, react to both interest rate changes and trade dynamics.
Forex Holdings: Exchange rates are influenced by differential interest rates between countries.
Trade Receivables in Foreign Currency: Companies may face gains or losses due to fluctuating currency rates and interest rate adjustments by central banks.
Commodity Exports: Prices of oil, metals, and agricultural products are sensitive to global demand and trade policies.
D. Derivatives and Structured Products
Derivative instruments such as interest rate swaps, futures, and options are inherently sensitive to interest rate changes. These tools are often used to hedge against or speculate on rate fluctuations.
Interest Rate Swaps: Allow companies to exchange fixed-rate debt for floating-rate debt to mitigate interest rate risk.
Options on Bonds: Their value changes as underlying bond prices fluctuate due to rate movements.
Currency Futures: Used by traders to hedge against foreign exchange and trade-related risks.
3. Factors Influencing Trade Rate Sensitive Assets
Several interrelated factors determine the performance of trade rate sensitive assets:
A. Central Bank Policies
Interest rate adjustments by central banks are among the most direct influencers of trade rate sensitive assets. For instance, rate hikes increase borrowing costs, reducing corporate profits and lowering bond prices. Conversely, rate cuts tend to boost asset values.
B. Inflation Expectations
High inflation often prompts central banks to raise interest rates, affecting both fixed-income and equity markets. Assets with longer maturities or high debt exposure are particularly vulnerable.
C. Global Trade Conditions
Trade-sensitive assets are influenced by international demand, tariffs, and supply chain disruptions. Changes in trade policies, such as import/export restrictions, can dramatically affect commodity-linked equities and currencies.
D. Currency Exchange Rates
Assets involved in cross-border trade are sensitive to exchange rate movements. Interest rate differentials between countries can strengthen or weaken currencies, impacting the value of trade-linked assets.
E. Economic Growth
Economic expansion or contraction influences interest rate decisions, trade volumes, and asset demand. For example, during a recession, central banks may lower interest rates, which typically supports bond prices but may depress export revenues due to reduced global demand.
4. Risks Associated with Trade Rate Sensitive Assets
Investing in trade rate sensitive assets carries multiple risks that investors must carefully consider:
A. Interest Rate Risk
This is the most direct risk, especially for fixed-income securities. Rising interest rates reduce the market value of existing bonds and increase borrowing costs for companies.
B. Currency Risk
Assets tied to foreign trade or denominated in foreign currency are exposed to currency fluctuations. Exchange rate volatility can amplify gains or losses.
C. Market Risk
Equities and commodities linked to trade are vulnerable to broader market swings and geopolitical events. Trade wars, sanctions, or supply chain disruptions can lead to sudden asset price changes.
D. Liquidity Risk
Some trade rate sensitive assets, particularly certain corporate bonds or niche commodities, may have limited market liquidity, making them difficult to sell without incurring losses.
E. Credit Risk
For corporate bonds or trade receivables, the possibility of default adds another layer of risk. Rising interest rates can strain financially leveraged companies, increasing default probability.
5. Measuring Sensitivity: Duration and Convexity
To quantify interest rate sensitivity, financial analysts often use metrics such as duration and convexity:
Duration: Measures the weighted average time it takes to receive bond cash flows. Higher duration implies higher sensitivity to interest rate changes.
Convexity: Accounts for the non-linear relationship between bond prices and interest rate changes. It refines duration estimates and helps in better risk management.
For equities and commodities, beta coefficients and sensitivity to macroeconomic indicators can measure their exposure to rate and trade-related fluctuations.
6. Strategies for Managing Trade Rate Sensitivity
Investors employ multiple strategies to manage risks associated with trade rate sensitive assets:
A. Diversification
Spreading investments across multiple asset classes, industries, and geographies can reduce the impact of interest rate or trade shocks.
B. Hedging
Using derivatives like interest rate swaps, options, and futures can hedge against adverse movements in interest rates or currency fluctuations.
C. Laddering Bonds
Investing in bonds with staggered maturities reduces exposure to interest rate risk and ensures liquidity over time.
D. Focus on Low-Volatility Sectors
Investors may prefer sectors less sensitive to interest rate changes, such as consumer staples or utilities, for stability during volatile periods.
E. Active Monitoring of Trade Policies
For trade-sensitive assets, monitoring international trade agreements, tariffs, and global supply-demand trends is crucial for timely adjustments.
7. Case Studies and Real-World Examples
A. US Federal Reserve Rate Hikes
When the Fed increases interest rates, US Treasury yields rise, causing the prices of existing bonds to drop. This also impacts equities in interest-sensitive sectors like real estate and utilities.
B. India’s Export-Oriented IT Companies
Indian IT exporters earn revenue in foreign currency. Appreciation of the Indian Rupee due to global rate hikes can reduce dollar-denominated profits, affecting stock prices.
C. Commodity Trade Disruptions
Oil prices, a trade-sensitive commodity, reacted sharply during global trade disputes and geopolitical tensions, highlighting how trade policies and international interest rates influence asset values.
8. Implications for Investors and Policymakers
Understanding trade rate sensitive assets is crucial for:
Investors: To optimize portfolio returns and manage interest rate and trade-related risks.
Corporations: To strategize financing, hedging, and trade operations efficiently.
Policymakers: To predict market reactions to interest rate changes, trade policies, and macroeconomic interventions.
Investors need to balance risk and return while factoring in global economic conditions, interest rate forecasts, and trade trends.
9. Conclusion
Trade rate sensitive assets are integral components of modern financial markets. Their values are intricately linked to interest rates, global trade dynamics, currency fluctuations, and economic policies. While they offer significant opportunities for returns, they also come with substantial risks that require careful assessment and strategic management.
By understanding the types of trade rate sensitive assets, the factors influencing their performance, and effective risk management techniques, investors can make informed decisions in both domestic and international markets. Whether through diversification, hedging, or active monitoring of trade policies, navigating the complexities of trade rate sensitive assets demands vigilance, analytical skill, and a proactive investment approach.
In an era of globalization, rapidly changing interest rates, and trade volatility, mastering the dynamics of trade rate sensitive assets is not just advantageous—it is essential for sustainable financial growth and risk management.
SME IPO Buzz for Huge ProfitsUnderstanding SME IPOs
An SME IPO is an offering where small and medium-sized enterprises list their shares on a stock exchange specifically designed for SMEs. Unlike the main board of stock exchanges such as NSE or BSE, SME platforms provide an alternative for companies that may not meet the rigorous requirements of the main board. For instance, the BSE SME platform and NSE Emerge cater exclusively to SMEs, offering a regulated space for capital-raising while giving investors a chance to enter early-stage growth companies.
SME IPOs serve multiple purposes for companies:
Raising Capital for Expansion: SMEs often require funds for scaling operations, launching new products, or entering new markets.
Enhancing Visibility and Credibility: Listing on a stock exchange enhances transparency and corporate governance, boosting investor confidence.
Providing Liquidity for Founders: Early investors and promoters gain an exit route or partial liquidity.
Attracting Institutional and Retail Investors: SME listings bring in a wider investor base, including retail, institutional, and high-net-worth individuals.
Why SME IPOs are Attractive for Investors
Investors are drawn to SME IPOs for several compelling reasons:
1. Early-Stage Growth Potential
SMEs typically operate in niche markets with high growth trajectories. Investing at an early stage allows investors to ride the growth curve before the company becomes a large-cap entity. If the SME successfully scales operations and captures market share, the returns can be significant.
2. Price Discovery Advantage
SME IPOs are often priced at lower levels compared to established companies. This provides investors the chance to buy shares at a relatively affordable valuation, amplifying potential upside if the company performs well.
3. Portfolio Diversification
Including SME stocks in a portfolio introduces diversity by sector, size, and growth profile. Many SMEs operate in innovative sectors such as fintech, healthtech, renewable energy, and manufacturing, providing exposure beyond conventional blue-chip stocks.
4. Potential for High Listing Gains
A well-performing SME IPO can witness immediate listing gains, creating short-term profit opportunities for investors. Investors often see a surge in stock price upon listing due to the novelty and excitement surrounding these companies.
Risks Associated with SME IPO Investments
While SME IPOs hold the promise of huge profits, they also come with inherent risks that investors must understand:
1. Limited Track Record
Many SMEs have a short operating history and limited financial data, making it challenging to evaluate long-term sustainability. Investors rely heavily on management quality, business model, and market potential rather than historical performance.
2. Liquidity Concerns
SME stocks often have lower trading volumes compared to mainboard stocks. This limited liquidity can result in price volatility and difficulties in buying or selling large quantities without impacting the stock price.
3. High Volatility
Due to small market capitalization and sensitivity to business performance, SME stocks can be highly volatile. A single news event, earnings report, or market sentiment shift can significantly affect stock prices.
4. Regulatory and Compliance Risks
Though SME exchanges provide regulatory oversight, SMEs may be more prone to operational or governance challenges. Investors must scrutinize financial statements, management credibility, and compliance with listing norms.
5. Market Sentiment Dependency
SME IPO performance is often heavily influenced by investor sentiment and market trends. A bearish market or economic slowdown can dampen IPO performance irrespective of the company’s fundamentals.
The Regulatory Framework for SME IPOs in India
The Securities and Exchange Board of India (SEBI) has established clear guidelines to protect investors while enabling SMEs to raise capital efficiently. Key features include:
Eligibility Criteria:
Minimum net worth requirements for promoters.
Track record of profitability for a specific period.
Minimum post-IPO capital to ensure sustainability.
Disclosure Norms:
SMEs must submit a detailed prospectus (Offer Document) including:
Business overview and expansion plans.
Financial statements audited by certified professionals.
Risks and uncertainties associated with operations.
Listing Norms:
SME shares can be listed on SME exchanges with less stringent norms compared to the main board.
Mandatory compliance with SEBI regulations regarding corporate governance, reporting, and investor protection.
Investor Protection:
Retail investors often receive a preferential allotment.
SEBI mandates transparency to reduce fraudulent practices and enhance trust.
Strategies to Maximize Profits from SME IPOs
Investing in SME IPOs requires a blend of research, timing, and strategy. Here are some approaches:
1. Research the Company Thoroughly
Before investing, study the SME’s business model, revenue streams, management team, competitive advantage, and sector growth potential. Understanding the company’s market positioning can help identify whether it has the potential for long-term profits.
2. Evaluate the IPO Valuation
Analyze the price-to-earnings (P/E) ratio, price-to-book (P/B) ratio, and industry benchmarks. SMEs with reasonable valuations relative to their growth prospects tend to offer better returns.
3. Focus on Management Quality
The credibility, vision, and track record of promoters and key management personnel play a critical role in determining success. Experienced and visionary leadership increases the likelihood of sustainable growth.
4. Diversify Investments
Investing in multiple SME IPOs can mitigate risk. Diversification reduces dependence on the performance of a single company and increases the chances of capturing profitable opportunities.
5. Timing of Exit
Decide whether to pursue short-term listing gains or long-term growth. Some SME IPOs provide immediate listing gains due to high initial demand, while others may take months or years to realize their full potential.
6. Monitor Post-Listing Performance
After listing, monitor quarterly earnings, operational performance, and market trends. Consistent growth and positive news flow often lead to sustained price appreciation.
Sector Trends Driving SME IPOs
Several sectors are fueling the SME IPO buzz:
Technology and IT Services: SMEs in software development, fintech, and cloud solutions are attracting investors due to exponential growth potential.
Healthcare and Pharmaceuticals: Healthtech and pharma SMEs benefit from rising healthcare demands and innovation in diagnostics and therapeutics.
Renewable Energy: With global emphasis on sustainability, SMEs in solar, wind, and green technologies are capturing investor interest.
Consumer Goods and Retail: SMEs catering to niche markets in FMCG, e-commerce, and specialty products show promising revenue growth.
Manufacturing and Infrastructure: SMEs in specialized manufacturing and infrastructure contribute to India’s industrial growth, providing strong profit potential.
The Investor Psychology Behind SME IPO Buzz
The excitement around SME IPOs is partly driven by investor psychology. Early investors are drawn to stories of rapid growth, innovation, and market disruption. Media coverage, social buzz, and peer discussions often create a sense of urgency, amplifying demand. Additionally, success stories of SME IPOs delivering massive returns reinforce optimism and speculation. While this buzz can lead to profitable opportunities, it can also inflate valuations and increase short-term volatility.
Case Studies of Profitable SME IPOs
Several SMEs have generated significant returns post-IPO:
Company A (IT SME): Listed at ₹50 per share and scaled rapidly in cloud services. Within two years, the share price appreciated fivefold.
Company B (Healthcare SME): A diagnostics company leveraged innovative technology to capture market share, yielding substantial listing gains for early investors.
Company C (Renewable SME): Focused on solar energy solutions and benefited from government incentives, leading to consistent stock appreciation post-IPO.
These examples illustrate that careful selection, backed by research and market understanding, can translate SME IPO investments into substantial profits.
Conclusion
SME IPOs represent a dynamic and profitable segment of the Indian capital market, offering investors a chance to participate in early-stage growth companies. The potential for huge profits stems from affordable valuations, high growth potential, and market excitement. However, these opportunities are accompanied by risks such as limited track record, volatility, and liquidity challenges.
A successful SME IPO investment strategy requires thorough research, careful evaluation of management quality, diversification, and monitoring post-listing performance. By balancing risk and reward, investors can capitalize on the SME IPO buzz while contributing to the growth of India’s vibrant entrepreneurial ecosystem.
Ultimately, SME IPOs are not just investment vehicles—they are gateways to participating in the nation’s growth story, offering both financial returns and the satisfaction of supporting innovative enterprises that shape the future of the economy.

Modern Market Explosion: Understanding the Phenomenon1. Historical Context of Market Evolution
To understand the modern market explosion, it is essential to consider the historical evolution of markets. Traditional markets were largely localized. Traders and merchants operated within geographic constraints, and trade was limited by logistical, technological, and regulatory barriers. Economic activity was driven by physical commodities, and transactions were largely cash-based or involved simple barter systems.
The Industrial Revolution marked a turning point. Mass production, improved transportation networks, and the rise of factories enabled businesses to scale operations beyond local markets. Subsequently, the 20th century witnessed further market expansion with globalization, advancements in communication, and the liberalization of trade policies. Multinational corporations began operating across continents, and financial markets expanded in size and scope, laying the foundation for today’s explosive market growth.
2. Drivers of the Modern Market Explosion
The modern market explosion is driven by several interrelated factors:
2.1 Technological Advancements
Technology is the primary catalyst for market expansion. The digital revolution, characterized by the rise of the internet, mobile technology, and cloud computing, has created new markets and transformed existing ones. E-commerce platforms, fintech applications, and digital payment systems have made it possible for businesses to reach consumers globally with minimal cost. Artificial intelligence (AI), machine learning, and big data analytics have enhanced market efficiency by enabling predictive modeling, targeted marketing, and personalized consumer experiences.
Blockchain and cryptocurrency technologies have introduced decentralized finance (DeFi) and digital assets, adding entirely new dimensions to global markets. Technology also supports real-time communication and logistics management, reducing transaction friction and enabling just-in-time supply chains.
2.2 Globalization
Globalization has exponentially increased market reach. Trade liberalization, the reduction of tariffs, and the establishment of free trade agreements have integrated economies worldwide. Businesses can now source raw materials from one continent, manufacture in another, and sell products globally. This integration has expanded consumer bases, diversified product offerings, and intensified competition. Globalization has also facilitated cross-border investments, enabling capital to flow more freely and boosting market liquidity.
2.3 Financial Innovation
Modern financial markets have grown through innovation. Derivatives, exchange-traded funds (ETFs), and securitization have increased market complexity while providing investors with diverse opportunities for risk management and profit generation. The rise of retail investing, supported by digital trading platforms and mobile apps, has democratized access to markets, contributing to higher transaction volumes and market participation.
2.4 Consumer Behavior and Social Trends
Changing consumer behavior has further accelerated market growth. Modern consumers demand convenience, variety, and personalized experiences. The rise of social media and influencer culture has altered purchasing patterns, creating viral trends that can rapidly inflate demand for products and services. Millennials and Gen Z, in particular, prioritize experiences, sustainability, and digital engagement, shaping market offerings in unprecedented ways.
2.5 Policy and Regulatory Environment
Governments and regulatory authorities play a critical role in enabling market expansion. Policies that promote entrepreneurship, protect intellectual property, and ensure financial stability encourage business growth. Conversely, relaxed regulations in digital finance and cross-border commerce have facilitated innovative market models, including fintech startups, gig economy platforms, and decentralized marketplaces.
3. Characteristics of Modern Market Explosion
The modern market explosion exhibits several distinctive characteristics:
3.1 Scale and Speed
Modern markets operate on an unprecedented scale and at extraordinary speed. Global supply chains, e-commerce, and digital finance allow businesses to scale rapidly. Information spreads instantly, enabling consumers to respond to trends in real-time, which amplifies market volatility and opportunity.
3.2 Diversification
Markets are increasingly diversified. Beyond traditional goods and services, there are emerging sectors such as renewable energy, artificial intelligence, electric vehicles, digital entertainment, and virtual assets. This diversification reduces reliance on single industries while creating new economic opportunities and employment avenues.
3.3 Interconnectedness
Modern markets are highly interconnected. Economic events in one region can rapidly affect global markets, as witnessed during the 2008 financial crisis and the COVID-19 pandemic. Interconnectedness increases both the potential for growth and the susceptibility to shocks.
3.4 Consumer-Centricity
The explosion of modern markets is heavily driven by consumer-centric models. Businesses leverage data analytics and AI to anticipate consumer needs, personalize offerings, and optimize engagement. Direct-to-consumer (D2C) models, subscription services, and platform-based marketplaces exemplify this shift.
3.5 Financialization
Financialization of markets—where financial markets and instruments dominate economic activity—has accelerated growth. Companies can raise capital more efficiently, investors can access diverse asset classes, and speculative trading contributes to rapid market expansion. However, this also increases systemic risk, as market bubbles and crashes can propagate quickly.
4. Technological Catalysts in Depth
4.1 E-commerce and Digital Platforms
E-commerce platforms like Amazon, Alibaba, and Flipkart have revolutionized retail markets. Consumers can purchase products from anywhere, while businesses can reach global audiences without investing in physical stores. Digital marketplaces reduce barriers to entry for small and medium-sized enterprises (SMEs), fostering entrepreneurship and competition.
4.2 Artificial Intelligence and Automation
AI and automation enhance efficiency in supply chains, inventory management, customer service, and financial trading. AI-driven algorithms can predict market trends, optimize pricing strategies, and personalize consumer experiences, accelerating market activity and growth.
4.3 Cryptocurrency and Blockchain
Blockchain technology enables decentralized markets that operate independently of traditional financial systems. Cryptocurrencies, smart contracts, and NFTs (non-fungible tokens) have created entirely new investment avenues, attracting retail and institutional participation alike.
5. Economic and Social Implications
The explosion of modern markets has profound economic and social consequences:
5.1 Economic Growth
Market expansion drives economic growth by increasing production, employment, and consumer spending. Emerging sectors, particularly in technology and renewable energy, stimulate innovation and long-term economic resilience.
5.2 Inequality and Market Access
While markets have grown, access is not uniform. Digital divides, regulatory barriers, and capital concentration can exacerbate inequality. Wealth and market influence often cluster among large corporations and tech giants, raising concerns about monopoly power and market fairness.
5.3 Volatility and Risk
Rapid market expansion increases volatility. High-frequency trading, speculative investment, and global interconnectivity mean that shocks can propagate rapidly. Regulatory oversight and risk management are crucial to prevent systemic crises.
5.4 Consumer Empowerment
Consumers benefit from greater choice, convenience, and competitive pricing. The explosion of markets empowers individuals to make informed decisions, access global products, and influence market trends through social and digital platforms.
6. Case Studies of Market Explosion
6.1 Technology Sector
The rise of technology companies exemplifies market explosion. Firms like Apple, Google, Microsoft, and Amazon have scaled rapidly, creating new market categories while reshaping existing ones. Their influence spans multiple sectors, from cloud computing to entertainment, reflecting the interconnected nature of modern markets.
6.2 E-commerce and Retail
E-commerce has transformed retail markets globally. During events like Black Friday or festive seasons, platforms witness unprecedented transaction volumes. Social commerce, live-stream selling, and digital marketing have accelerated consumer engagement and market growth.
6.3 Renewable Energy
The renewable energy market has exploded due to global sustainability goals, policy incentives, and technological innovation. Solar, wind, and battery storage markets have expanded rapidly, attracting investment and creating new industries, illustrating how market growth aligns with social and environmental priorities.
7. Challenges and Risks
Despite opportunities, the modern market explosion presents challenges:
Market Volatility: Rapid growth and speculation can lead to sudden crashes.
Regulatory Lag: Regulations often struggle to keep pace with innovation, particularly in digital finance and cryptocurrencies.
Inequality: Concentration of wealth and market power can marginalize smaller players.
Sustainability: Unsustainable business practices may undermine long-term market stability.
8. Future Outlook
The future of market growth will likely be shaped by emerging technologies such as AI, quantum computing, and advanced robotics. Sustainability and ESG (Environmental, Social, Governance) considerations will increasingly influence investment and consumer decisions. Global markets will continue to integrate, but geopolitical tensions, trade conflicts, and technological competition will introduce uncertainties.
The democratization of markets through digital platforms, social media, and decentralized finance will continue to empower individuals and SMEs. However, balancing innovation with regulation, stability, and inclusivity will be critical to ensuring sustainable growth.
Conclusion
The modern market explosion is a defining characteristic of the 21st-century economy. It is driven by technological innovation, globalization, financial innovation, and changing consumer behavior. While it offers unprecedented opportunities for growth, entrepreneurship, and consumer empowerment, it also presents challenges related to volatility, inequality, and regulatory oversight. Understanding this phenomenon requires a holistic view of the interconnected social, technological, and economic forces shaping modern markets. As markets continue to evolve at a rapid pace, stakeholders—from policymakers to businesses and consumers—must navigate both the opportunities and risks to harness the full potential of this extraordinary expansion.

Trading Order Basics1. What is a Trading Order?
A trading order is a formal instruction to buy or sell an asset at a particular price or under specific conditions. Orders ensure that trades are executed according to a trader’s strategy and risk preferences. They are essential in modern electronic markets, where speed, price accuracy, and order type determine profitability and efficiency.
Every order has two primary components:
Direction: Buy or sell.
Quantity: The number of units (shares, contracts, lots, etc.) to be traded.
Orders are executed either immediately at the market price or at a predetermined price specified by the trader.
2. Types of Trading Orders
Trading orders are classified based on execution method, price conditions, and validity. The main types include:
A. Market Orders
A market order is an order to buy or sell an asset immediately at the best available price.
Characteristics:
Guarantees execution but not the price.
Commonly used when liquidity is high, ensuring rapid entry or exit.
Simple and effective for quick trades.
Example:
If a stock is currently trading at ₹500, a market order to buy 100 shares will be executed at the best price available, which might be ₹500, ₹500.50, or slightly higher, depending on market liquidity.
Pros:
Fast execution.
Ensures the trade occurs.
Cons:
Price may fluctuate during execution.
Not ideal in highly volatile markets.
B. Limit Orders
A limit order specifies the maximum price a trader is willing to pay for a buy order or the minimum price for a sell order.
Characteristics:
Guarantees price, not execution.
Used when traders want to control entry or exit price.
Example:
Buy Limit: A trader places a buy limit order at ₹480 for a stock currently at ₹500. The order executes only if the stock falls to ₹480 or below.
Sell Limit: A trader places a sell limit order at ₹520. The order executes only if the stock reaches ₹520 or above.
Pros:
Price control.
Useful for trading pullbacks or resistance levels.
Cons:
Order may not get executed if the price doesn’t reach the limit.
C. Stop Orders (Stop-Loss and Stop-Limit)
Stop orders are conditional orders used to trigger a trade when an asset reaches a certain price, often to limit losses or protect profits.
Types:
Stop-Loss Order: Automatically sells (or buys in case of short) when the price reaches a specified level to prevent further loss.
Example: A trader owns a stock at ₹500 and sets a stop-loss at ₹480. If the price drops to ₹480, the stop-loss triggers a market order to sell.
Stop-Limit Order: Combines stop-loss and limit orders. When the stop price is hit, the order becomes a limit order instead of a market order.
Example: Stop price ₹480, limit price ₹478. The order executes only within this limit.
Pros:
Protects against significant losses.
Helps automate risk management.
Cons:
In volatile markets, stop orders can trigger at an undesirable price (“slippage”).
D. Trailing Stop Orders
A trailing stop moves automatically with favorable price changes to lock in profits while still protecting against losses.
Mechanism:
For a long position: The stop price rises as the stock price rises but remains fixed if the stock falls.
For a short position: The stop price falls as the stock price falls.
Example:
If a stock is at ₹500 and a trailing stop is set 10 points below the peak price, when the stock rises to ₹520, the stop moves to ₹510. If the stock then falls, the stop triggers at ₹510.
Pros:
Dynamically locks in profits.
Requires less active monitoring.
Cons:
Still susceptible to sudden gaps in price.
E. Good Till Cancelled (GTC) vs. Day Orders
Orders also differ in validity period, which determines how long the order stays active.
Day Order: Expires at the end of the trading day if not executed.
Good Till Cancelled (GTC) Order: Remains active until executed or explicitly cancelled, potentially spanning multiple trading sessions.
Immediate or Cancel (IOC) Orders: Execute immediately any portion available; unexecuted parts are cancelled.
Fill or Kill (FOK) Orders: Must be executed in full immediately, or the entire order is cancelled.
Pros:
Provides flexibility in execution strategies.
Traders can align orders with market timing preferences.
Cons:
Long-term GTC orders may become irrelevant if market conditions change.
F. Other Specialized Orders
Modern markets also offer complex orders for sophisticated strategies:
Bracket Orders: Combines entry, target, and stop-loss in a single order to automate risk management.
OCO (One-Cancels-the-Other): Places two orders simultaneously; execution of one cancels the other.
Iceberg Orders: Large orders broken into smaller visible portions to avoid moving the market.
These orders are especially popular in high-frequency trading, algorithmic trading, and professional strategies.
3. Order Execution Mechanics
When a trading order is placed, it interacts with the order book, which lists all buy and sell orders.
Key Concepts:
Bid Price: Highest price a buyer is willing to pay.
Ask Price: Lowest price a seller is willing to accept.
Spread: Difference between bid and ask, reflecting liquidity and market efficiency.
Execution Steps:
Trader places order via broker or trading platform.
Order reaches exchange or market venue.
Matching engine matches buy and sell orders based on price and priority.
Trade is executed, and confirmation is sent to the trader.
Factors affecting execution:
Market liquidity: More liquidity ensures faster and more accurate execution.
Order type: Market orders execute faster than limit orders.
Volatility: High volatility may cause slippage, especially for market and stop orders.
4. Practical Considerations in Using Trading Orders
A. Choosing the Right Order Type
The choice depends on:
Trading style: Day traders may prefer market orders; swing traders might use limit or stop orders.
Risk management: Stop-loss and trailing stops protect capital.
Market conditions: In volatile or thinly traded markets, limit and stop-limit orders are safer.
B. Avoiding Common Mistakes
Ignoring slippage: Market orders in volatile markets can execute at worse prices than expected.
Overcomplicating orders: Too many conditional orders can confuse risk management.
Not updating orders: GTC or stop orders may become irrelevant if market dynamics change.
C. Leveraging Orders in Strategy
Orders are not just tools for execution—they are strategic instruments:
Entry strategy: Limit orders allow precise entry at support levels.
Exit strategy: Stop-loss and target orders protect profits and limit losses.
Hedging: Conditional and bracket orders can hedge against adverse price movements.
5. Importance of Understanding Orders
Control: Different orders give traders control over price and timing.
Risk Management: Stop and limit orders are crucial for preserving capital.
Efficiency: Automated and complex orders save time and reduce emotional trading.
Adaptability: Knowledge of orders allows traders to adjust strategies in varying market conditions.
Inexperienced traders often focus solely on market orders, which can be risky. Professional traders use a combination of order types to optimize returns and manage risk.
6. Summary Table of Common Orders
Order Type Execution Speed Price Certainty Use Case
Market Order Fast Low Immediate entry/exit
Limit Order Moderate High Targeted price execution
Stop-Loss Order Conditional Medium Loss prevention
Stop-Limit Order Conditional High Controlled exit
Trailing Stop Conditional Medium Lock in profits dynamically
GTC Order Varies Varies Long-term strategy
IOC/FOK Orders Fast Varies Immediate or full execution
Bracket/OCO Orders Automated High Advanced trading strategies
Conclusion
Trading orders are the backbone of financial market operations. A solid understanding of order types—market, limit, stop, trailing stop, and advanced conditional orders—is essential for effective trading. Orders determine not only the timing and price of trades but also risk management and strategic execution.
By mastering trading orders, traders gain:
Greater control over their trades
Efficient execution and reduced slippage
Automated risk management
Flexibility to implement complex trading strategies
Ultimately, trading is not just about predicting market direction—it is also about using orders strategically to ensure that predictions translate into profitable outcomes while limiting potential losses.
Carbon Credits and ESG Investing1. Understanding Carbon Credits
1.1 Definition
A carbon credit is a tradable certificate or permit that represents the right to emit one ton of carbon dioxide (CO₂) or an equivalent amount of another greenhouse gas (GHG). Essentially, it is a financial instrument designed to cap emissions while incentivizing reductions. Carbon credits are central to market-based approaches for controlling global carbon emissions.
1.2 Types of Carbon Credits
Carbon credits can be broadly classified into two categories:
Compliance Carbon Credits:
These are generated and traded under mandatory national or international regulatory frameworks, such as the European Union Emissions Trading System (EU ETS) or the Kyoto Protocol mechanisms. Companies exceeding emission limits can purchase credits to meet compliance.
Voluntary Carbon Credits:
These are used by companies or individuals on a voluntary basis to offset emissions beyond regulatory requirements. The voluntary market supports projects like reforestation, renewable energy, and methane capture.
1.3 Mechanism of Carbon Credits
The carbon credit system operates on the “cap-and-trade” principle:
Cap: Governments or regulatory bodies set a cap on total carbon emissions for specific sectors or organizations.
Allocation: Companies are allocated emission allowances equivalent to the cap.
Trade: If a company emits less than its allowance, it can sell excess credits. Conversely, companies exceeding their limits must purchase credits to comply.
This system creates a financial incentive for companies to reduce emissions efficiently, while providing flexibility in achieving environmental goals.
1.4 Benefits of Carbon Credits
Environmental Impact: Encourages the reduction of greenhouse gas emissions and supports renewable energy and conservation projects.
Economic Incentives: Provides a cost-effective mechanism for companies to manage emission limits.
Global Cooperation: Facilitates cross-border collaboration in combating climate change.
Innovation: Encourages technological advancements in energy efficiency and clean technologies.
1.5 Challenges
Verification and Transparency: Ensuring the authenticity and impact of carbon credits can be difficult, especially in voluntary markets.
Market Volatility: Prices of carbon credits can fluctuate, affecting corporate planning.
Risk of “Greenwashing”: Companies may misuse credits to appear environmentally responsible without genuine sustainability efforts.
2. ESG Investing
2.1 Definition
ESG investing is an investment strategy that integrates Environmental, Social, and Governance factors into financial decision-making. Unlike traditional investment approaches that focus solely on financial returns, ESG investing evaluates how companies manage sustainability risks and social responsibilities.
Environmental: Examines a company’s environmental footprint, including energy use, emissions, waste management, and climate impact.
Social: Focuses on human capital management, labor standards, community relations, and diversity and inclusion.
Governance: Assesses corporate governance practices, board structure, transparency, shareholder rights, and ethical conduct.
2.2 History and Evolution
The concept of ESG investing has evolved over decades:
1960s–1980s: Ethical investing emerged, primarily focused on avoiding “sin stocks” like tobacco and weapons.
1990s–2000s: Socially responsible investing (SRI) began incorporating broader social and environmental concerns.
2010s–Present: ESG investing became mainstream, driven by climate change concerns, regulatory pressure, and growing investor awareness of long-term risks.
2.3 ESG Integration Strategies
Investors can adopt several approaches to integrate ESG factors:
Screening: Excluding companies or sectors that do not meet ESG criteria (negative screening) or including those that do (positive screening).
Integration: Embedding ESG factors into fundamental financial analysis to assess long-term risks and opportunities.
Impact Investing: Targeting investments that generate measurable social and environmental benefits alongside financial returns.
Shareholder Engagement: Using ownership rights to influence company policies on sustainability and corporate governance.
2.4 Importance of ESG Investing
Risk Management: ESG factors help identify potential environmental, social, or governance risks that could impact financial performance.
Long-term Value Creation: Companies with strong ESG performance tend to demonstrate resilience and sustainable growth.
Regulatory Compliance: Governments and regulators are increasingly mandating ESG disclosures and reporting.
Reputation and Consumer Demand: ESG-aligned companies attract customers, employees, and investors seeking responsible businesses.
2.5 Challenges in ESG Investing
Standardization: Lack of uniform ESG metrics and reporting standards makes comparisons difficult.
Greenwashing: Companies may exaggerate ESG credentials to attract investors without real impact.
Short-term vs Long-term: ESG benefits often manifest over the long term, while market pressures may favor short-term gains.
Data Quality: Reliable ESG data can be scarce, inconsistent, or biased.
3. Intersection of Carbon Credits and ESG Investing
Carbon credits and ESG investing are closely linked. Carbon credits primarily address environmental factors, which form a significant part of ESG considerations. Here’s how they intersect:
3.1 Carbon Credits as ESG Tools
Companies can purchase carbon credits to offset emissions, demonstrating commitment to environmental sustainability.
Carbon credits serve as measurable ESG actions that investors can evaluate when assessing environmental performance.
Integration of carbon credits into corporate ESG strategies enhances credibility and transparency in emissions reduction reporting.
3.2 Driving ESG-Compliant Investments
Investors increasingly consider companies’ carbon footprint and offset strategies when making investment decisions. Firms actively participating in carbon markets often attract ESG-focused capital, creating a feedback loop:
Investor Pressure: ESG-conscious investors demand action on climate-related risks.
Corporate Response: Companies adopt carbon offset projects, improve energy efficiency, and reduce emissions.
Market Incentive: This enhances long-term corporate value and reduces exposure to regulatory or environmental risks.
3.3 Role in Sustainable Finance
Sustainable finance refers to integrating ESG factors into financial systems to promote sustainable development. Carbon credits, green bonds, and ESG funds are instruments enabling sustainable finance:
Green Bonds: Proceeds are used for environmentally sustainable projects.
ESG Funds: Allocate capital to companies with strong ESG practices, often including carbon reduction initiatives.
Carbon Markets: Provide financial incentives for emissions reductions, complementing ESG investment strategies.
4. Global Trends and Market Dynamics
4.1 Carbon Market Growth
The global carbon market has expanded rapidly. According to the World Bank:
The market reached over $300 billion in value by 2023, with both compliance and voluntary markets growing.
Regulatory initiatives like the EU ETS, California Cap-and-Trade Program, and China’s national carbon market are driving compliance credit demand.
Voluntary carbon markets are increasingly used by multinational corporations to meet net-zero targets.
4.2 ESG Investment Growth
Global ESG assets are projected to surpass $50 trillion by 2025, representing over a third of total assets under management.
Institutional investors, pension funds, and sovereign wealth funds are incorporating ESG criteria into mainstream investment decisions.
ESG-focused indices and funds are becoming standard offerings in global capital markets.
4.3 Regional Variations
Europe: Leading in ESG adoption due to regulatory frameworks like the EU Sustainable Finance Disclosure Regulation (SFDR).
United States: ESG investing is growing, though regulatory clarity is evolving.
Asia-Pacific: Rapid adoption driven by corporate sustainability initiatives and investor demand, especially in Japan, India, and China.
5. Challenges and Criticisms
5.1 Carbon Credits
Lack of uniform verification standards.
Risk of over-reliance on offsets instead of direct emission reductions.
Potential for double counting or non-additionality (credits not leading to actual emission reductions).
5.2 ESG Investing
ESG rating agencies may use different methodologies, causing discrepancies.
Greenwashing remains a significant concern.
Measuring impact remains complex; financial returns are sometimes uncertain.
5.3 Integration Challenges
Combining ESG investment strategies with carbon credit mechanisms requires robust reporting and transparency.
Investors must carefully evaluate whether carbon offsets genuinely contribute to sustainability or merely serve marketing purposes.
Harmonization of global ESG standards is needed to streamline investment decisions.
6. Future Outlook
6.1 Regulatory Developments
Governments worldwide are introducing stricter ESG reporting and carbon disclosure requirements. These regulations are expected to:
Improve transparency in carbon markets.
Enhance corporate ESG reporting.
Encourage the adoption of standardized ESG metrics.
6.2 Technological Innovations
Blockchain: Enhances transparency in carbon credit trading and ESG reporting.
AI and Big Data: Improve ESG data collection, analysis, and predictive modeling.
Clean Technology: Investments in renewable energy, carbon capture, and sustainable agriculture will expand ESG and carbon credit opportunities.
6.3 Investor Behavior
Younger investors increasingly prioritize sustainability, pushing companies toward ESG compliance.
Impact investing and socially responsible funds will continue to grow.
Integration of carbon pricing into financial models will help assess corporate climate risk more accurately.
Conclusion
Carbon credits and ESG investing are pivotal in the transition toward a sustainable global economy. Carbon credits provide a mechanism to limit greenhouse gas emissions, incentivize environmental projects, and facilitate corporate accountability. ESG investing, on the other hand, allows investors to integrate sustainability into financial decisions, promoting ethical, responsible, and long-term value creation.
The synergy between these two concepts is crucial. Carbon credits complement ESG strategies by providing measurable environmental actions, while ESG investing channels capital toward sustainable and responsible enterprises. Together, they represent a shift in the financial world where profitability, sustainability, and societal impact are no longer mutually exclusive but increasingly interconnected.
As the global community confronts the challenges of climate change, resource scarcity, and social inequality, carbon credits and ESG investing will continue to play transformative roles in shaping investment strategies, corporate behavior, and ultimately, the sustainability of our planet.

Sub-Brokers and Their Impact on IndiaWhat is a Sub-Broker?
A sub-broker is an individual or entity registered with a stock exchange and authorized by a main broker (or stockbroker) to act on their behalf. Sub-brokers do not directly hold clients’ funds or execute trades independently; instead, they act as facilitators, providing advisory services, opening client accounts, and executing transactions through the main broker. In India, sub-brokers are regulated by the Securities and Exchange Board of India (SEBI), which ensures transparency, accountability, and investor protection.
Key Functions of Sub-Brokers:
Client Acquisition: Sub-brokers help main brokers expand their customer base by reaching clients in tier-2 and tier-3 cities, where the presence of large brokerage firms is limited.
Advisory Services: They educate and guide investors about market trends, investment strategies, and risk management.
Trade Execution Assistance: Sub-brokers facilitate trading by transmitting orders from clients to the main broker for execution.
Administrative Support: They assist with documentation, KYC compliance, account opening, and other formalities required for investing in the stock market.
Market Promotion: By engaging directly with local communities, sub-brokers enhance the popularity of stock market investments among the general public.
Historical Perspective of Sub-Brokers in India
Historically, Indian stock markets were concentrated in metros like Mumbai, Delhi, and Kolkata. The cost of trading and lack of awareness restricted participation primarily to urban investors. Sub-brokers emerged as intermediaries in the 1980s and 1990s to bridge this gap. Their presence democratized access to the stock market, especially after the establishment of SEBI in 1992, which formalized regulatory oversight and introduced investor protection mechanisms.
With the advent of technology and online trading in the 2000s, the role of sub-brokers evolved. While digital platforms enabled direct trading, sub-brokers remained crucial in providing advisory services and reaching less tech-savvy populations.
Impact on Indian Financial Markets
1. Enhancing Market Accessibility
India has a vast population, with a significant percentage residing in semi-urban and rural areas. Sub-brokers act as the first point of contact for investors in these regions. By reducing physical and informational barriers, sub-brokers enable wider participation in the capital markets. This not only increases market liquidity but also encourages a culture of investment beyond traditional savings instruments such as fixed deposits or gold.
Example: A sub-broker in a tier-3 town can guide first-time investors to invest in equities, mutual funds, or derivatives, expanding financial market penetration.
2. Promoting Financial Literacy
A significant challenge in India has been low financial literacy. Many potential investors hesitate to enter the stock market due to lack of understanding of investment products, risk factors, and regulatory processes. Sub-brokers bridge this gap by offering guidance, conducting workshops, and explaining complex market concepts in local languages. This contributes to long-term investor confidence and reduces the risk of uninformed or speculative trading.
Example: Sub-brokers often organize local seminars explaining the benefits of SIPs (Systematic Investment Plans) or diversified equity investments, thereby increasing informed participation.
3. Supporting Small and Retail Investors
Large brokerage firms often focus on high-net-worth individuals or urban centers due to higher transaction volumes and profitability. Sub-brokers, however, target retail investors, enabling them to participate in investment opportunities that were previously inaccessible. By supporting small investors, sub-brokers play a role in wealth creation at the grassroots level.
4. Market Liquidity and Depth
Sub-brokers increase the liquidity of financial markets by channeling numerous small transactions into the system. Each sub-broker represents a pool of retail investors, contributing to the overall trading volume. Greater liquidity reduces price volatility and promotes efficient price discovery. This is crucial for market stability and investor confidence, particularly in emerging markets like India.
5. Employment and Economic Growth
Sub-brokers contribute indirectly to the economy by generating employment and entrepreneurial opportunities. Each sub-broker acts as a small business entity, employing staff and creating a local economic ecosystem. This microeconomic impact contributes to broader economic growth by integrating local communities into financial markets.
Example: Sub-brokers often hire relationship managers, office assistants, and market educators, thereby generating local jobs.
6. Encouraging Long-Term Investments
Through personalized advice, sub-brokers promote long-term investing strategies, discouraging speculative or short-term trading behaviors that can destabilize markets. By nurturing a culture of disciplined investment, sub-brokers indirectly enhance the sustainability and maturity of Indian capital markets.
7. Regional Market Development
India’s stock market has historically been concentrated in urban hubs. Sub-brokers enable the growth of regional markets by attracting local investors and integrating them into national trading networks. This decentralization ensures that economic growth is not limited to a few metropolitan areas but spreads to smaller towns and cities.
Regulatory Framework for Sub-Brokers in India
The impact of sub-brokers is strengthened by the regulatory oversight of SEBI, which ensures that investor interests are safeguarded. Key aspects include:
Registration: Sub-brokers must register with SEBI and the stock exchanges they operate in.
Code of Conduct: Sub-brokers adhere to ethical standards to prevent malpractices like mis-selling or mismanagement of client funds.
Training and Certification: SEBI mandates training programs and examinations to ensure sub-brokers are competent and informed about market practices.
Periodic Audits: Exchanges conduct audits to ensure compliance with operational and financial standards.
This framework ensures that sub-brokers positively impact the market while minimizing potential risks for investors.
Challenges Faced by Sub-Brokers
While sub-brokers contribute significantly to market growth, they face several challenges:
Competition from Online Platforms: Digital trading apps offer direct access to the stock market, reducing dependency on sub-brokers.
Limited Revenue Models: Sub-brokers earn primarily from commissions, which can be volatile depending on market conditions.
Investor Trust: Some sub-brokers, particularly in rural areas, face challenges in establishing credibility and trust among first-time investors.
Regulatory Compliance: Adhering to SEBI norms and maintaining transparency requires continuous effort and investment.
Technological Adaptation: To remain relevant, sub-brokers need to embrace technology, which may be challenging in less urbanized regions.
Future Prospects of Sub-Brokers in India
Despite challenges, the future of sub-brokers in India remains promising due to several factors:
Financial Inclusion: India’s push for financial inclusion under programs like PMJDY (Pradhan Mantri Jan Dhan Yojana) and digital banking encourages sub-brokers to extend services to unbanked populations.
Growing Middle Class: Increasing disposable income among India’s middle class creates a larger investor base, offering opportunities for sub-brokers.
Education and Awareness: Government and private initiatives promoting financial literacy provide a fertile environment for sub-brokers to educate investors.
Hybrid Models: By integrating online trading platforms with traditional advisory services, sub-brokers can expand their reach and enhance profitability.
Conclusion
Sub-brokers play an indispensable role in the Indian financial ecosystem. They act as facilitators, educators, and market intermediaries, bridging the gap between formal financial institutions and investors, especially in semi-urban and rural regions. Their contribution is multifaceted: increasing market accessibility, promoting financial literacy, supporting retail investors, enhancing liquidity, and contributing to regional economic development.
While technological advancements and online trading platforms present challenges, sub-brokers remain relevant due to their personal touch, local presence, and advisory services. As India moves towards a more inclusive and digitally connected financial system, sub-brokers will continue to shape the growth of capital markets and contribute to the broader economic development of the country.
In essence, sub-brokers are not merely intermediaries; they are catalysts of financial empowerment, driving the democratization of investment opportunities and fostering a culture of informed and responsible investing across India.

Intraday Trading vs Swing Trading1. Definition and Concept
Intraday Trading:
Intraday trading, often referred to as day trading, involves buying and selling financial instruments within the same trading day. The positions are opened and closed during market hours, ensuring that no trades are carried overnight. The primary objective is to capitalize on short-term price fluctuations, often measured in minutes or hours. Intraday traders rely heavily on technical analysis, real-time charts, and market news to make rapid decisions.
Swing Trading:
Swing trading, on the other hand, is a medium-term strategy where traders aim to profit from price “swings” or trends over several days to weeks. Unlike intraday trading, positions in swing trading are not confined to a single day and may be held for multiple sessions. Swing traders attempt to capture significant market moves rather than minute-to-minute fluctuations, employing both technical and fundamental analysis.
Key Difference:
The central distinction is time horizon. Intraday trading is about short bursts of activity within a day, whereas swing trading spans multiple days to weeks, targeting broader trends.
2. Time Commitment
Intraday Trading:
Intraday trading demands significant attention and engagement throughout the trading session. Traders need to monitor charts, order flows, and news events continuously. This makes intraday trading time-intensive and akin to a full-time job for active traders. Missing even a short market movement can result in lost opportunities or losses.
Swing Trading:
Swing trading requires less constant monitoring. Since positions are held for several days, traders can check the market periodically, adjusting their positions as trends develop. This makes swing trading more suitable for part-time traders or those with other professional commitments.
3. Capital Requirements and Leverage
Intraday Trading:
Day trading often involves high leverage to magnify small price movements into meaningful profits. Many brokers offer intraday margin, allowing traders to take positions several times larger than their actual capital. While leverage increases profit potential, it also amplifies risk, making risk management crucial.
Swing Trading:
Swing trading generally requires more capital upfront because positions are held overnight and are exposed to market gaps and volatility. Leverage may still be used, but it is usually lower than in intraday trading, as the focus is on capturing larger moves rather than rapid micro-fluctuations.
Key Takeaway:
Intraday trading is more capital-efficient due to leverage but riskier in a short timeframe. Swing trading needs more upfront capital, but risk is spread across time, allowing more measured position sizing.
4. Risk and Volatility
Intraday Trading:
Intraday trading exposes traders to high volatility, but the exposure is limited to a single trading session. Traders can use stop-loss orders to manage risk aggressively. However, markets can move unpredictably within minutes, leading to rapid gains or losses.
Swing Trading:
Swing traders face overnight and weekend risk, where significant news events or economic developments can cause price gaps. While daily volatility may be less critical, holding positions overnight increases the potential for unexpected swings, which requires careful risk management.
Comparison:
Intraday trading: High short-term risk, low overnight exposure.
Swing trading: Moderate daily risk, higher overnight/holding risk.
5. Analytical Approach
Intraday Trading:
The strategy relies almost entirely on technical analysis, including:
Candlestick patterns
Intraday charts (1-minute, 5-minute, 15-minute)
Volume analysis
Moving averages, RSI, MACD
News and economic data for intraday sentiment
Fundamental factors are usually secondary, as their impact manifests over a longer timeframe.
Swing Trading:
Swing traders use a blend of technical and fundamental analysis:
Technical analysis identifies entry and exit points using daily or weekly charts.
Fundamental analysis helps assess whether a stock or commodity has the potential for multi-day trends, based on earnings reports, economic indicators, or sectoral developments.
Key Insight:
Intraday trading focuses on price action and market psychology in the very short term, while swing trading integrates market trends with underlying financial health.
6. Profit Potential and Target
Intraday Trading:
Targets small profits per trade, often measured in a few percentage points or fractions thereof.
High frequency of trades is necessary to accumulate meaningful gains.
Profit depends heavily on timing and execution.
Swing Trading:
Targets larger profits per trade, sometimes 5–20% or more depending on the instrument and trend duration.
Fewer trades are executed, but each trade aims to capture a substantial portion of the trend.
Patience is key; missing a trend reversal can significantly affect profitability.
7. Psychological and Emotional Factors
Intraday Trading:
Highly stressful due to rapid decision-making and constant monitoring.
Emotional discipline is critical to avoid impulsive trades based on fear or greed.
Traders often experience burnout, especially during volatile markets.
Swing Trading:
Less stressful in daily execution but requires patience and emotional control over longer periods.
Traders need to resist the urge to exit early or chase market reversals.
Swing trading fosters a calmer, more strategic mindset, focusing on trend-following rather than rapid reaction.
8. Costs and Expenses
Intraday Trading:
Higher transaction costs due to frequent trading.
Broker commissions, spreads, and taxes can eat into profits if not managed efficiently.
Swing Trading:
Lower transaction costs, as trades are less frequent.
Overnight exposure may involve financing costs if positions are leveraged in margin accounts.
Key Observation:
Intraday trading requires high-volume, low-margin efficiency, while swing trading benefits from fewer trades with larger profit potential per trade.
9. Suitability for Different Traders
Intraday Trading:
Suitable for traders with high risk tolerance, strong analytical skills, and the ability to monitor markets constantly.
Ideal for individuals seeking quick returns and able to handle high stress.
Swing Trading:
Better suited for part-time traders, investors who prefer moderate risk, or those who value trend-based strategies.
Aligns with individuals focusing on longer-term wealth accumulation without the need for constant market monitoring.
10. Tools and Technology
Intraday Trading:
Requires real-time data feeds, fast execution platforms, charting software, and news alerts.
Algorithmic trading and automated systems are commonly used to capitalize on micro-movements.
Swing Trading:
Can operate with daily charts, trend indicators, and fundamental reports.
Automation is less critical; research and strategic analysis often suffice.
11. Advantages and Disadvantages
Aspect Intraday Trading Swing Trading
Time Horizon Same-day Several days to weeks
Time Commitment High Moderate
Risk High short-term, low overnight Moderate daily, higher overnight
Profit Potential Small per trade, frequent Larger per trade, less frequent
Capital Efficiency High (via leverage) Requires more capital upfront
Stress Level High Moderate
Analytical Focus Technical only Technical + Fundamental
Transaction Costs High due to frequent trades Low to moderate
Suitability Full-time, active, risk-tolerant traders Part-time, trend-followers, moderate risk
12. Conclusion
Both intraday and swing trading are viable strategies but cater to different personality types, financial goals, and lifestyles. Intraday trading offers the thrill of rapid decision-making and potential for quick profits but requires high dedication, real-time analysis, and exceptional risk management. Swing trading, by contrast, offers a more patient, strategic approach, balancing market analysis with trend-based decisions, suitable for those who cannot dedicate full trading hours but still seek substantial returns.
Choosing between intraday and swing trading depends on multiple factors:
Risk tolerance
Time availability
Capital allocation
Emotional resilience
Market knowledge and analytical skill
Ultimately, successful trading in either domain demands discipline, strategy, and continuous learning. Understanding the nuances of intraday versus swing trading can help traders craft a personalized approach, optimizing both profitability and sustainability in financial markets.

3 Common Trading Mistakes Traders Should AvoidTraders of all levels, from beginners to experienced professionals, can fall prey to psychological mistakes that can lead to poor trading decisions and ultimately, losses. Understanding and avoiding these common mistakes is crucial for developing a sound trading strategy and achieving consistent success in the markets.
Here are three of the most prevalent trading mistakes traders should strive to avoid:
FOMO (Fear of Missing Out): FOMO is a pervasive emotion that can cloud traders' judgment and lead them to make impulsive decisions based on the fear of missing out on potential profits. This often involves chasing trends or entering trades without proper analysis, increasing the risk of losses.
To combat FOMO, traders should adhere to their trading plan, prioritize discipline, and focus on identifying high-probability trading opportunities rather than reacting to market movements out of fear.
Revenge Trading: Revenge trading is the emotional urge to recoup losses from previous trades by making hasty and ill-advised decisions. This often stems from a desire to prove one's rightness or regain a sense of control over the market.
To avoid revenge trading, traders should cultivate emotional detachment, accept losses as a natural part of trading, and avoid the temptation to let emotions dictate their trading decisions.
Gambler's Fallacy: The gambler's fallacy is the mistaken belief that past events influence the outcome of future events, leading to an assumption that trends will continue indefinitely or that random events can be predicted.
To overcome the gambler's fallacy, traders should recognize that each trade is an independent event with its own unique probabilities, and past performance is not a guarantee of future results. They should rely on sound trading analysis and risk management techniques rather than relying on hunches or superstitions.
By avoiding these common psychological mistakes, traders can develop a more disciplined and rational approach to trading, increasing their chances of achieving long-term success in the markets.

Part 8 Trading Master ClassLeverage and Speculation in Option Trading
Options provide leverage, allowing traders to control large positions with small investments. For instance, buying a single call option can represent ownership of 100 shares, magnifying both profits and losses. Speculators use this leverage to capitalize on short-term market moves. However, leverage also increases risk—if the market moves against the position, the entire premium can be lost. Successful speculators use strict risk management, combining analysis of volatility, momentum, and time decay to optimize entries and exits. While leverage makes options attractive, disciplined control is vital to avoid quick capital depletion.

Part 6 Learn Institutional Trading Leverage and Speculation in Option Trading
Options provide leverage, allowing traders to control large positions with small investments. For instance, buying a single call option can represent ownership of 100 shares, magnifying both profits and losses. Speculators use this leverage to capitalize on short-term market moves. However, leverage also increases risk—if the market moves against the position, the entire premium can be lost. Successful speculators use strict risk management, combining analysis of volatility, momentum, and time decay to optimize entries and exits. While leverage makes options attractive, disciplined control is vital to avoid quick capital depletion.

Part 4 Learn Institutional TradingOption Premium and Its Components
The premium is the price paid to acquire an option contract. It consists of two parts: intrinsic value and time value. Intrinsic value reflects the actual profitability if exercised immediately, while time value represents the potential for further profit before expiry. Several factors influence premiums—especially implied volatility (IV), time to expiration, and interest rates. Higher volatility generally increases premiums since potential price swings make the option more valuable. Traders analyze these components using models like Black-Scholes to determine fair value. Understanding premium behavior helps in selecting the right option strategy, whether to buy undervalued options or sell overvalued ones.

Part 3 learn Institutional Trading The Role of the Strike Price and Expiry Date
Each option contract includes a strike price and an expiry date. The strike price determines the level at which the asset can be bought or sold, while the expiry date sets the time limit. The relationship between the strike price and the market price determines whether an option is in-the-money (ITM), at-the-money (ATM), or out-of-the-money (OTM). As expiry nears, the option’s time value decreases—a concept known as time decay. Short-term options lose value faster, while long-dated ones retain time premium longer. Successful option traders always monitor how close prices are to the strike and how much time remains to expiry before making or exiting trades.

Intraday Scalping Tips1. Understanding Intraday Scalping
Definition
Scalping is the practice of profiting from small price changes in a stock, commodity, or currency. Scalpers often aim for gains of just a few points per trade but compensate for the small size with a high volume of trades.
Characteristics of Scalping
Very short holding periods, usually minutes or seconds.
Requires liquid markets where orders can be executed quickly.
Relies heavily on technical indicators, charts, and patterns.
Emphasizes risk management because losses can accumulate quickly.
Scalping is not suitable for everyone. It demands intense focus, fast decision-making, and a temperament capable of handling frequent small losses.
2. Choosing the Right Market and Stocks
Market Selection
Scalping works best in markets that are:
Highly liquid, like major indices (Nifty 50, S&P 500) or high-volume stocks.
Have tight spreads, ensuring minimal slippage between buy and sell orders.
Experience consistent intraday volatility, providing opportunities to profit from small movements.
Stock Selection
For intraday scalping, consider:
High liquidity: Stocks that trade in large volumes are easier to enter and exit.
Low bid-ask spreads: Narrow spreads reduce trading costs.
Volatility: Moderate volatility is ideal; too little movement limits opportunities, while too much increases risk.
3. Technical Tools for Scalping
Scalpers rely heavily on technical tools rather than fundamental analysis. The most commonly used indicators include:
a) Moving Averages
Short-term moving averages (SMA, EMA) like 5-period or 15-period help identify trends and reversals.
Crossovers can signal quick entry or exit points.
b) Bollinger Bands
Measures volatility and can help scalpers spot overbought or oversold conditions.
Price touching the upper band may signal a potential sell, while the lower band may indicate a buy.
c) Relative Strength Index (RSI)
RSI helps detect momentum and potential trend reversals.
A value above 70 indicates overbought conditions, while below 30 suggests oversold conditions.
d) Volume Indicators
Volume confirms strength of a price move.
A sudden spike in volume can indicate a strong intraday trend, ideal for scalping.
4. Scalping Strategies
a) Momentum Scalping
Focuses on stocks showing strong momentum in one direction.
Scalpers enter quickly when a breakout occurs and exit when momentum weakens.
Works well with high-volume news-driven stocks.
b) Range Trading
Used when a stock is trading within a range.
Buy at support levels, sell at resistance.
Requires quick execution and constant monitoring.
c) Trend Following
Scalpers ride a short-term trend, entering on pullbacks and exiting before reversal.
Tools like moving averages and trendlines are crucial.
d) News-Based Scalping
Scalping stocks around news events like earnings announcements or economic data releases.
Requires high-speed execution and understanding of market sentiment.
5. Risk Management
Scalping is high-frequency, and small losses can add up quickly. Effective risk management is essential:
a) Stop-Loss Orders
Always set tight stop-losses, usually 0.2–0.5% of the stock price.
Avoid emotional decisions; strictly adhere to stops.
b) Position Sizing
Only risk a small portion of capital per trade (1–2% of trading capital).
Prevents a single loss from wiping out profits.
c) Avoid Overtrading
Stick to high-probability trades only.
Trading every small movement leads to losses due to slippage and fees.
6. Timing and Market Hours
Scalping is most effective during high volatility periods:
Market open (first 30–60 minutes).
Just before market close.
Avoid the midday session when markets are often quiet and range-bound.
7. Tools and Technology
Scalping demands speed and precision:
Broker with low latency execution.
Real-time charts and Level II market data.
Hotkeys for quick order execution.
Algorithmic or automated tools can help manage multiple trades efficiently.
8. Psychology of a Scalper
Patience and discipline: Wait for setups, don’t force trades.
Detachment: Avoid emotional attachment to positions.
Focus under pressure: Quick decisions without hesitation.
Learning from mistakes: Analyze trades to identify patterns of success or failure.
9. Common Mistakes to Avoid
Ignoring risk management.
Trading illiquid stocks or large spreads.
Overtrading due to impatience or boredom.
Chasing losses instead of cutting them.
Relying solely on indicators without considering price action.
10. Developing a Scalping Plan
A clear plan is essential for long-term success:
Define entry and exit rules.
Set profit targets and stop-loss levels.
Decide on maximum number of trades per day.
Record trades in a journal to refine strategy over time.
11. Conclusion
Intraday scalping can be highly rewarding but is not for the faint-hearted. Success requires a mix of technical expertise, discipline, and psychological resilience. By focusing on high-liquidity stocks, using technical tools effectively, and strictly managing risk, traders can make consistent profits in the fast-paced intraday market.
Remember: Scalping is a skill developed over time, and even small, disciplined gains can accumulate into significant profits when executed correctly.
Introduction to IPOs in IndiaIntroduction
An Initial Public Offering (IPO) represents the first sale of a company's shares to the public, allowing the firm to raise capital from a wide pool of investors. In India, IPOs are a crucial avenue for both corporate growth and investor participation. They allow private companies to transition into publicly listed entities, enhancing their credibility, visibility, and financial flexibility.
The Indian IPO market has seen substantial growth over the past few decades, driven by economic expansion, policy reforms, technological innovation, and increasing investor awareness. For investors, IPOs offer an opportunity to participate in the growth story of emerging companies. For the economy, they facilitate capital formation and resource allocation toward productive sectors.
Regulatory Framework Governing IPOs in India
The IPO process in India is strictly regulated to protect investor interests and ensure transparency. The key regulatory authorities are:
Securities and Exchange Board of India (SEBI): SEBI regulates the issuance of securities under the SEBI (Issue of Capital and Disclosure Requirements) Regulations, 2018. It ensures that companies disclose complete, accurate, and timely information about their financial health, business risks, and objectives of fund utilization.
Stock Exchanges: IPOs must be listed on recognized stock exchanges such as the National Stock Exchange (NSE) or Bombay Stock Exchange (BSE). Exchanges ensure compliance with listing requirements, including corporate governance norms.
RBI (Reserve Bank of India): While RBI is not directly involved in IPO approvals, it oversees foreign investments and ensures compliance with capital account regulations for Non-Resident Indians (NRIs) investing in IPOs.
Merchant Bankers/Lead Managers: Investment banks or merchant bankers facilitate the IPO process, from drafting the prospectus to managing investor subscriptions.
Registrar and Depositories: Registrars handle the allotment of shares, while depositories such as NSDL and CDSL maintain electronic records of shareholding.
The IPO Process in India
The IPO process in India is structured and multi-staged to ensure regulatory compliance and transparency:
1. Pre-IPO Preparation
Before going public, a company must strengthen its internal systems and governance structures. Steps include:
Corporate Restructuring: Streamlining operations, consolidating subsidiaries, and cleaning up financial statements.
Due Diligence: Legal, financial, and operational checks to ensure transparency.
Engaging Advisors: Hiring investment bankers, auditors, and legal advisors.
Board Approval: The company’s board must approve the IPO plan and submission to SEBI.
2. Filing Draft Prospectus with SEBI
The company submits a Draft Red Herring Prospectus (DRHP) to SEBI. The DRHP contains critical information including:
Business model and strategy
Financial statements and projections
Risks and uncertainties
Promoter details and shareholding pattern
Purpose of the IPO (capital utilization plans)
SEBI reviews the DRHP, suggesting modifications or clarifications to ensure investor protection. Once approved, the company can file its Red Herring Prospectus (RHP) with stock exchanges.
3. Pricing and Marketing
The company must decide the IPO pricing mechanism:
Fixed Price IPO: A predetermined price per share is set. Investors know the exact cost.
Book Building IPO: Investors bid within a price band, and the final price is determined based on demand.
During this stage, companies conduct roadshows to market their shares to institutional investors and create awareness. Institutional investors, including mutual funds and insurance companies, play a vital role in subscription and price discovery.
4. IPO Opening and Subscription
The IPO is opened for subscription to:
Retail Investors: Individuals with an investment limit under SEBI norms (usually ₹2 lakh per application).
Qualified Institutional Buyers (QIBs): Banks, mutual funds, insurance companies, and corporates.
Non-Institutional Investors (NIIs): High-net-worth individuals or entities investing above a specified limit.
Investors apply through banks, stockbrokers, or online trading platforms. In modern India, electronic IPO application (ASBA – Application Supported by Blocked Amount) is mandatory for retail and non-institutional investors to ensure a smooth and secure application process.
5. Allotment and Listing
Post-subscription, shares are allotted to investors based on demand. In case of oversubscription, shares are allotted proportionally through a lottery system. Once allotted, shares are credited to investors’ demat accounts.
Finally, shares are listed on NSE and BSE. The listing day is crucial as it sets the market benchmark for IPO performance. A successful listing often leads to a surge in share prices, commonly known as “listing gains.”
Types of IPOs in India
India has witnessed various types of IPO structures:
Initial Public Offering (IPO): Traditional method where shares are offered to the public for the first time.
Follow-on Public Offering (FPO): Additional shares issued by an already listed company.
Rights Issue: Shares offered to existing shareholders before offering to the general public.
Offer for Sale (OFS): Promoters or early investors sell their stake to the public, often seen in large-cap firms.
Book-Built IPOs vs Fixed-Price IPOs: As mentioned earlier, the pricing mechanism differs, with book-building being the more popular modern method.
Trends in the Indian IPO Market
The Indian IPO market has evolved dynamically over the last two decades. Some notable trends include:
Rising Retail Participation: With digital banking and dematerialized accounts, retail investors increasingly participate in IPOs, contributing significantly to subscriptions.
Tech and Start-up IPOs: Companies in the IT, fintech, and e-commerce sectors, such as Zomato, Paytm, and Nykaa, have created high investor excitement.
Large-Cap IPOs: Established companies continue to go public, providing investors with a blend of growth and relative safety.
Regulatory Reforms: SEBI introduced reforms like fast-track IPOs for smaller companies and enhanced disclosure requirements to boost investor confidence.
Global Investor Inflows: Foreign institutional investors (FIIs) actively participate in Indian IPOs, reflecting confidence in India’s growth story.
Advantages of IPOs in India
For companies:
Capital Raising: IPOs provide a large amount of capital without increasing debt.
Brand Visibility: Public listing enhances credibility and visibility.
Liquidity for Promoters: Founders and early investors can monetize part of their holdings.
Expansion Opportunities: Funds raised can be used for acquisitions, research, technology, and market expansion.
For investors:
High Growth Potential: Early investment in high-growth companies can yield significant returns.
Portfolio Diversification: IPOs provide access to new sectors and businesses.
Market Participation: Encourages a culture of investment and wealth creation among the general public.
Risks and Challenges
Despite the potential benefits, IPOs carry significant risks:
Market Volatility: Listing day prices can be highly volatile, influenced by demand-supply dynamics and macroeconomic factors.
Overvaluation: Hype-driven IPOs may trade below issue price post-listing if valuations are unrealistic.
Limited Information: Despite SEBI regulations, investors may not fully understand business risks.
Lock-in Period: Promoter shares often have a lock-in period, which may restrict liquidity in the short term.
Recent Developments in India’s IPO Market
The Indian IPO ecosystem is becoming more sophisticated:
Digital IPO Platforms: Integration with UPI, net banking, and trading apps has simplified subscription and payment processes.
Retail-Centric Approaches: SEBI mandates minimum 35% allocation to retail investors in most IPOs.
Emergence of Unicorn IPOs: Technology startups and fintech companies have gone public, attracting substantial attention from domestic and global investors.
ESOP Buybacks and Employee Incentives: Companies often offer shares to employees before listing, fostering employee wealth creation.
Conclusion
The IPO market in India is a vibrant component of the financial ecosystem, offering a symbiotic platform for companies to raise capital and investors to access early-stage growth opportunities. With robust regulatory oversight, digital infrastructure, and growing investor awareness, India’s IPO market continues to expand and evolve.
However, while IPOs provide opportunities for wealth creation, investors must exercise due diligence, evaluate fundamentals, and assess risks before participating. Understanding the IPO mechanism, market trends, and regulatory landscape is essential for both corporate leaders and investors to make informed decisions.
India’s IPO market not only strengthens individual companies but also contributes to overall economic growth by channeling resources efficiently, promoting transparency, and expanding capital markets. With innovation, technology-driven platforms, and increasing investor participation, India is poised to see more dynamic IPO activity in the years ahead.
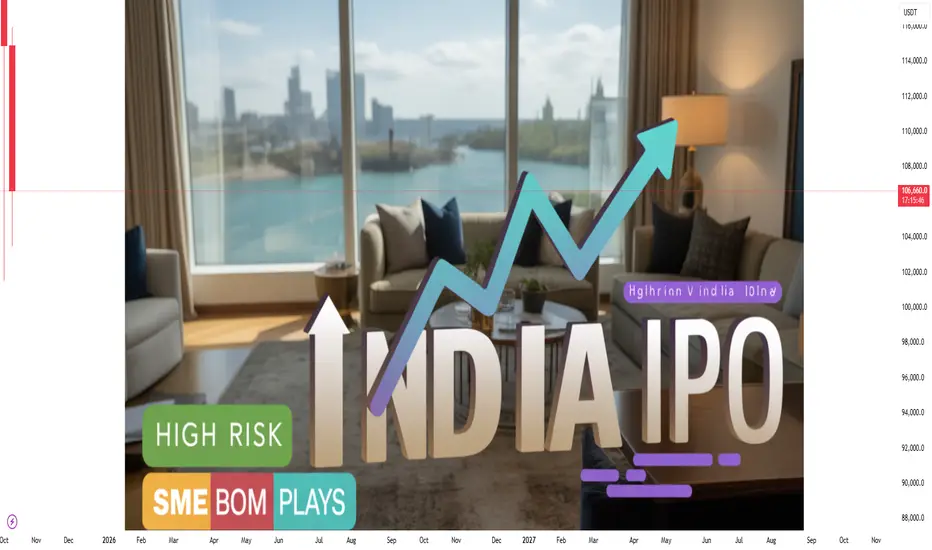
Part 2 Ride The Big Moves Call and Put Options Explained
A Call Option gives the buyer the right to purchase an asset at a specific price (strike price) before or on the expiry date. Investors buy calls when they expect the asset’s price to rise. Conversely, a Put Option gives the buyer the right to sell the asset at the strike price, used when expecting a price fall. Sellers of options (writers) have obligations—call writers must sell, and put writers must buy if exercised. The interplay between call and put options allows for complex strategies, such as spreads and straddles. Understanding how both function is vital for predicting market direction and building profitable positions.

AI Analysis: The Inflation Nightmare ContinuesIntroduction
As we approach the end of 2025, the global economy remains entrenched in an inflationary crisis that shows no immediate signs of abating. From India to the United States, from emerging markets to developed nations, inflation continues to erode purchasing power, disrupt markets, and challenge policymakers. Artificial Intelligence (AI) has become an indispensable tool in analyzing this complex phenomenon, offering insights that blend data science, economics, and forecasting.
This analysis delves into the persistent inflationary trends of 2025, examining their causes, impacts, and the role of AI in understanding and addressing this economic challenge.
Understanding the Inflationary Surge
1. Global Supply Chain Disruptions
The aftermath of the COVID-19 pandemic, coupled with geopolitical tensions, has led to significant disruptions in global supply chains. These disruptions have resulted in shortages of essential goods, driving up prices. AI models have been instrumental in tracking these supply chain bottlenecks, using real-time data to predict potential shortages and price hikes.
2. Energy Prices and Commodity Inflation
The surge in energy prices, particularly oil and natural gas, has had a cascading effect on the prices of other commodities. AI-driven analytics have shown a direct correlation between energy costs and the prices of goods, as transportation and production costs rise. These insights are crucial for policymakers to understand the broader implications of energy price fluctuations.
3. Labor Market Dynamics
In many regions, labor markets have tightened, leading to wage inflation. AI tools have analyzed employment data to identify trends in wage growth and its impact on overall inflation. These analyses help in understanding the balance between wage increases and productivity gains, which is essential for assessing the sustainability of inflationary pressures.
The Role of AI in Inflation Analysis
Artificial Intelligence has revolutionized the way economists and policymakers analyze inflation. By processing vast amounts of economic data, AI can identify patterns and correlations that might be overlooked by traditional methods. Some key applications include:
Predictive Modeling: AI algorithms can forecast inflation trends by analyzing historical data and identifying leading indicators.
Sentiment Analysis: AI tools can analyze news articles, social media, and financial reports to gauge public sentiment and its potential impact on inflation expectations.
Supply Chain Optimization: AI can identify inefficiencies in supply chains, suggesting areas where improvements can be made to reduce costs and mitigate inflationary pressures.
The Impact on Consumers and Businesses
1. Erosion of Purchasing Power
Consumers are feeling the pinch as their incomes fail to keep pace with rising prices. AI-driven consumer behavior models indicate a shift towards more budget-conscious spending, with increased demand for discount retailers and private-label products.
2. Business Adaptation Strategies
Businesses are employing AI to optimize pricing strategies, manage inventory, and streamline operations to cope with inflation. Machine learning algorithms help in dynamic pricing, adjusting prices in real-time based on market conditions and competitor actions.
Policy Responses and Challenges
Governments and central banks have implemented various measures to combat inflation, including interest rate hikes and fiscal stimulus packages. However, AI analyses suggest that these measures have had limited success in the current environment due to factors such as global supply chain issues and geopolitical uncertainties.
Conclusion
The inflationary crisis of 2025 presents a multifaceted challenge that requires a nuanced understanding and a coordinated response. AI has proven to be an invaluable tool in analyzing and addressing this issue, offering insights that are critical for informed decision-making. As we move forward, the integration of AI into economic analysis will be essential in navigating the complexities of the global economy and mitigating the impacts of inflation.