Advanced Database TradingTrading data is typically collected from stock exchanges such as the New York Stock Exchange (NYSE) or NASDAQ. This can be a useful source for trades that are made over the listed exchanges and can provide many different data poitns, such as trade prices and times.
X-indicator

Technical TradingIn trading, "technical" refers to the practice of analyzing historical price and volume data to identify patterns and predict future price movements. This approach, called technical analysis, is a way to evaluate securities and forecast their behavior based on charts and statistical data.

Divergence SecretsIn the share market, divergence refers to a situation where the price of an asset moves in a direction opposite to what a technical indicator is suggesting. This can signal a weakening trend and potentially a trend reversal. Divergence can be either positive (price moving higher) or negative (price moving lower).

Basic to Advance in TradingMake profits in intraday.
Stock market concepts and workings explained from very basic level.
Learn powerful day trading strategies.
Learn a step by step approach of how to trade in intraday.
Trend Following (Wealth Generation)
Learn the art of minimizing the risk and maximizing the return.

Meaning of Management and Psychology Management and psychology, when combined, explore how understanding human behavior can improve organizational effectiveness. Management is the process of directing and organizing resources (including people) to achieve goals, while psychology studies the mind and behavior. Therefore, management psychology (or managerial psychology) is about using psychological principles to understand and improve managerial practices, decision-making, and leadership in organizations.

Explain Swing Trading Swing trading is a speculative strategy where traders aim to profit from short-term price swings in a financial asset, typically holding positions for a few days to a few weeks. It focuses on capturing gains from the short-term fluctuations within a broader market trend, unlike day trading (which focuses on intraday movements) or long-term investing (which focuses on larger trends).

Bitcoin Scalping Strategy with 21/24 Trend Dashboard Title:
Bitcoin Scalping Strategy with 21/24 Trend Dashboard — Ultra-Clear Entry & Exit
Looking for clear, fast trade entries on BTC?
This scalping setup using the Trend Matrix Multi-Timeframe Dashboard by TechnoBlooms simplifies decision-making by compressing trend signals into one powerful grid.
⸻
Scalping Logic:
→ Enter a position when 21 or more out of 24 signals point in the same direction.
→ Exit the trade when 5 or more signals flip or diverge.
This rule-based setup is ideal for scalpers who need fast confirmations on fast charts like 1m, 3m, 5m, and 15m.
⸻
Chart Setup:
• Asset: BTC/USD
• Timeframe: 15 Minutes (scalping)
• Tool: Trend Matrix MTF Dashboard
• Dashboard Configuration:
• 6 Indicators × 4 Timeframes = 24 signals
• Timeframes: 1M, 2M, 3M, 5M
⸻
Why It Works:
This dashboard simplifies complex analysis by combining multiple trusted indicators into a single view. It helps avoid hesitation, misreads, or false setups — and gives scalpers green-light moments to strike.
⸻
Indicators Used in Dashboard:
• MACD – Momentum & trend crossovers
• EMA – Fast-moving dynamic trend bias
• RSI – Momentum strength & reversals
• Bollinger Bands – Volatility squeeze & trend pressure
• Supertrend – Strong trailing trend confirmation
• PVT – Volume-backed trend strength
⸻
Scalping Entry Flow:
1. Watch for 21+ signals to align (all ▲ or ▼).
2. Enter a trade in the same direction.
3. Monitor for any divergence.
4. Exit when 5+ signals flip.
This strategy helps avoid premature entries and keeps you on the right side of momentum.
⸻
#BTCUSD #BitcoinScalping #ScalpBTC #TrendMatrix #TechnoBlooms #ScalpingSignals #MultiTimeframe #DashboardTrading #DayTradingTools #CryptoScalping

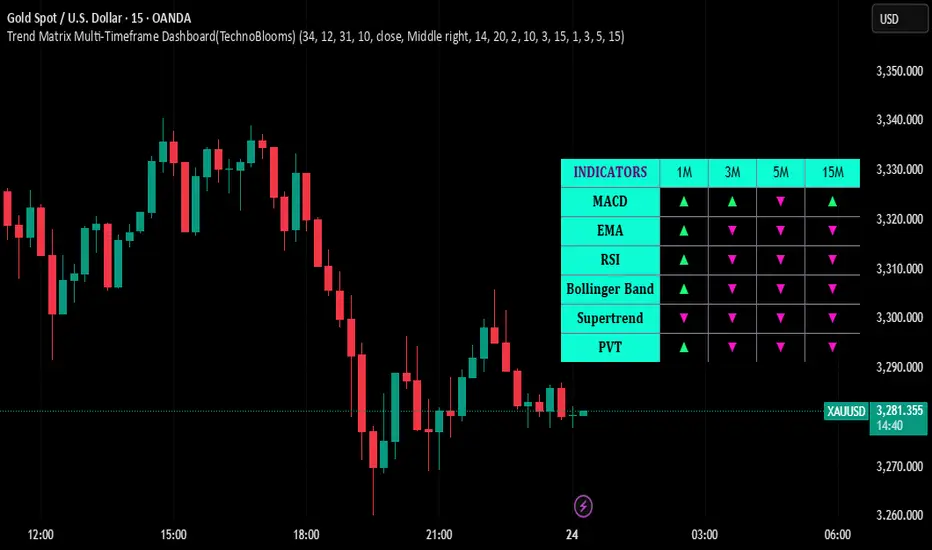
Gold Scalping Strategy Using Trend MatrixTitle:
Gold Scalping Strategy Using Trend Matrix: Enter When 21/24 Signals Align!
Looking to scalp Gold (XAUUSD) with high conviction trades?
This setup based on the Trend Matrix Multi-Timeframe Dashboard by TechnoBlooms is built exactly for that!
⸻
Core Idea:
→ Enter the trade when 21 or more out of 24 signals show the same direction.
→ Exit when 5 or more signals start to diverge.
This makes it simple to trade with confidence — avoiding noise and fake moves.
⸻
Chart Setup:
• Asset: XAUUSD
• Timeframe: 1-Minute (scalping)
• Tool: Trend Matrix MTF Dashboard
• Dashboard Coverage:
• 6 Indicators × 4 Timeframes = 24 total trend signals
• Timeframes: 1M, 3M, 5M, 15M
⸻
Why This Works:
The dashboard combines multiple high-quality trend indicators and compresses their multi-timeframe output into a clean visual grid. It’s perfect for scalpers looking for fast, reliable trend alignment.
⸻
What Each Indicator Shows:
• MACD – Momentum and crossovers
• EMA – Dynamic support/resistance zones
• RSI – Strength and overbought/oversold confirmation
• Bollinger Bands – Volatility and breakout signals
• Supertrend – Clean trend direction
• PVT (Price-Volume Trend) – Volume-supported price moves
⸻
How to Use This Strategy:
1. Wait until 21 or more cells show the same direction (either ▲ or ▼).
2. Enter in the direction of the dominant signal.
3. Continue monitoring the dashboard.
4. Exit when 5 or more signals flip (less than 20 aligned).
5. Rinse & repeat!
⸻
This method filters out noise and gives scalpers a simple green-light/red-light system without switching timeframes constantly.
⸻
#GoldScalping #XAUUSD #TrendMatrix #ScalpingStrategy #TechnoBlooms #MultiTimeframeAnalysis #SmartScalping #PriceActionTools #DayTrading
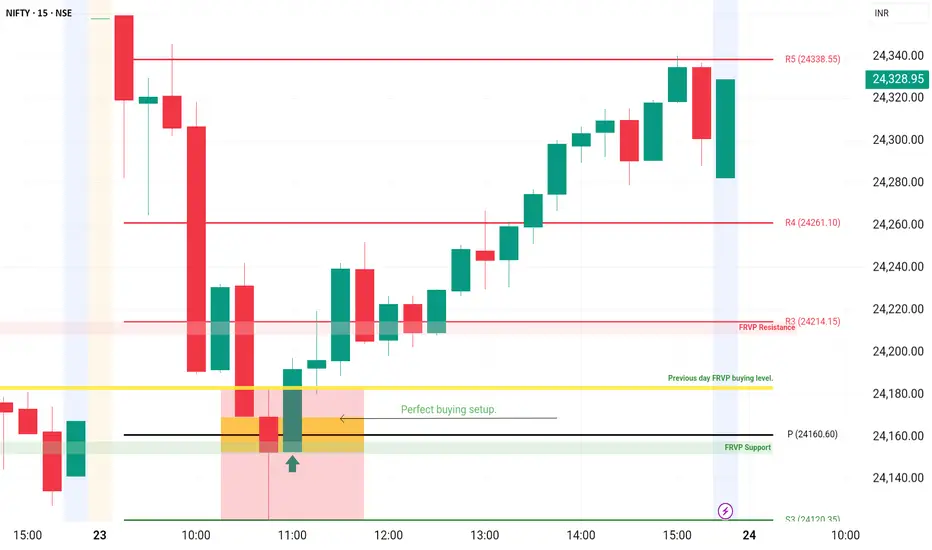
Intraday setup - Pivot points along with FRVP levels.Fixed Range Volume Profile + Pivot Points (Camarilla): Combined Setup & Benefits
Using Fixed Range Volume Profile alongside Camarilla Pivot Points creates a powerful combo for precision intraday or swing trading. Here's how and why:
How to Set It Up
Volume Profile (Fixed Range):
Select a key range (e.g., yesterday, this week, or a consolidation zone).
Identify:
Point of Control (POC) – highest traded volume price (strong support/resistance).
Value Area High (VAH) & Low (VAL) – where 70% of volume occurred.
Combined Benefits (Short & Sweet)
High-Probability Zones:
When Camarilla levels align with Fixed Range Volume Profile levels (POC, VAH, VAL), those zones become high-confluence for entries/exits.
Improved Trade Timing:
Volume profile shows when price stalls or accelerates, helping time trades better around Camarilla levels.
Better Risk Management:
Use volume levels as stop-loss or TP guides, with pivots providing trade direction.
RSI Divergence Part 3RSI divergence happens when the price and the RSI move in opposite directions. This signals that the current trend may be losing momentum and could reverse soon. For example, if the price keeps rising but the RSI starts falling, it could mean the uptrend is weakening.

Technical Analysis class1 1Technical analysis is a means of examining and predicting price movements in the financial markets, by using historical price charts and market statistics. It is based on the idea that if a trader can identify previous market patterns, they can form a fairly accurate prediction of future price trajectories.

Technical TradingIn trading, "technical" refers to the practice of analyzing historical price and volume data to identify patterns and predict future price movements. This approach, called technical analysis, is a way to evaluate securities and forecast their behavior based on charts and statistical data.

Database TradingTrading data is typically collected from stock exchanges such as the New York Stock Exchange (NYSE) or NASDAQ. This can be a useful source for trades that are made over the listed exchanges and can provide many different data poitns, such as trade prices and times.

PCR TradingIn trading, PCR, or Put-Call Ratio, is a technical indicator used to assess market sentiment by analyzing the volume of put options (right to sell) compared to call options (right to buy). It helps traders gauge whether the market is leaning towards bullish or bearish trends.

Candlestick PatternCandlestick patterns are a visual representation of price movements in financial markets, used in technical analysis to identify potential future price movements. Each candlestick represents price action (open, high, low, close) over a specific period, and the combination of these candlesticks forms patterns that can suggest market sentiment and potential trends.

How to Trade ?Open a Demat account. The first step is to open a Demat account, which serves as a digital repository for your stocks. ...
Understand stock terms. ...
Bids and asks. ...
Fundamental and technical knowledge of stocks. ...
Learn to set stop loss orders. ...
Seek expert advice. ...
Start with safer stocks.

Option and Database TradingAn option chain has several key characteristics that provide valuable information to traders:
Underlying asset. The first element to consider is the underlying asset itself. ...
Expiration dates. ...
Strike prices. ...
Option type. ...
Option symbols. ...
Bid and ask prices. ...
Volume and open interest. ...
In-The-Money (ITM)

RSI (Relative Strength Index)The Relative Strength Index (RSI) is a technical indicator used in financial markets to measure the speed and magnitude of price changes, typically used to identify overbought or oversold conditions. It oscillates between 0 and 100, with readings above 70 often suggesting an asset is overbought and below 30 suggesting it's oversold

Divergence AnalysisDivergence in technical analysis refers to the relationship between two different data sets; the divergence can be between an instrument price and an oscillator, an indicator, sentiment, or another correlated instrument price or market.

Support and Resistance part 2Support occurs at the point where a downtrend is expected to pause due to a concentration of demand. Resistance occurs at the point where an uptrend is expected to pause due to a concentration of supply.

Advanced Option TradingAdvanced options trading ventures beyond basic buying and selling of calls and puts. It involves useful combinations of options contracts to achieve specific trading goals.

Meaning of Management and PsychologyManagement and psychology, when combined, form a field known as managerial psychology or management psychology. It is a sub-discipline of industrial and organizational psychology that focuses on understanding and improving human behavior within organizations to enhance efficiency and performance. Essentially, it's about using psychological principles to improve management practices and create a more positive and productive work environment.

Technical Analysis Technical analysis is a means of examining and predicting price movements in the financial markets, by using historical price charts and market statistics. It is based on the idea that if a trader can identify previous market patterns, they can form a fairly accurate prediction of future price trajectories.
