Advanced Option StrategiesWhat are Options?
Before we dive into advanced stuff, here’s a quick refresher.
An Option is a contract that gives you the right (but not the obligation) to buy or sell a stock/index at a certain price, on or before a certain date.
There are 2 types:
Call Option – Right to BUY
Put Option – Right to SELL
Buyers pay a premium. Sellers receive a premium and take on the obligation.
💼 Why Use Advanced Strategies?
If you only buy calls or puts, you might:
Lose 100% of your capital quickly
Get the direction right, but still lose due to time decay
Suffer from high premiums or volatility crush (IV crush)
Advanced strategies help you:
✅ Reduce risk
✅ Lock-in profits
✅ Earn from sideways markets
✅ Trade during high volatility events
✅ Create income strategies
🧠 1. Bull Call Spread – Directional but Risk-Defined
Used when: You’re moderately bullish, but don’t want to spend too much on a call.
How it works:
Buy 1 ATM Call
Sell 1 higher strike OTM Call
Example:
Nifty at 22000
Buy 22000 CE @ ₹100
Sell 22200 CE @ ₹40
Net Cost = ₹60
Max Profit: ₹200 (22200–22000) – ₹60 = ₹140
Max Loss: ₹60 (net premium paid)
👉 This strategy caps your risk and reward but is cost-efficient and smart in range-bound bull moves.
🧠 2. Bear Put Spread – Controlled Downside Betting
Used when: You’re mildly bearish and want to control losses.
How it works:
Buy 1 ATM Put
Sell 1 lower strike Put
Example:
BankNifty at 48500
Buy 48500 PE @ ₹120
Sell 48000 PE @ ₹60
Net Cost = ₹60
Max Profit: ₹500 – ₹60 = ₹440
Max Loss: ₹60
👉 Ideal for limited downside moves — cheaper than naked Put.
🧠 3. Iron Condor – The Sideways Market King
Used when: Market is flat or expected to stay in a range.
How it works:
Sell 1 OTM Call + Buy 1 higher OTM Call
Sell 1 OTM Put + Buy 1 lower OTM Put
You make money if market stays between the 2 sell strikes.
Example:
Nifty is at 22500
Sell 22800 CE, Buy 23000 CE
Sell 22200 PE, Buy 22000 PE
👉 You collect premiums from both sides.
Max Profit = Net Premium
Max Loss = Difference between strikes – Net Premium
👉 Works great in expiry week or low-volatility phases.
🧠 4. Straddle – Big Move Expected, Direction Unknown
Used when: A major move is expected (news, event, earnings), but unsure about direction.
How it works:
Buy ATM Call and ATM Put of the same strike & expiry.
Example:
Stock at ₹500
Buy 500 CE @ ₹20
Buy 500 PE @ ₹25
Total Cost = ₹45
If stock moves big — say ₹60 or more either way — you profit.
👉 High risk due to premium decay if market stays flat.
Need volatility to spike.
🧠 5. Strangle – Cheaper than Straddle, Wider Range
Used when: You expect a big move but want lower cost than a straddle.
How it works:
Buy OTM Call and OTM Put (strikes wider apart than ATM).
Example:
Nifty at 22500
Buy 22800 CE @ ₹12
Buy 22200 PE @ ₹10
Total Cost = ₹22
You profit if the move crosses either strike + premium.
👉 Needs bigger move than straddle but less premium at risk.
🧠 6. Calendar Spread – Play with Time
Used when: You expect price to stay near a level short term, but may move later.
How it works:
Sell near-term option
Buy far-term option (same strike)
Example:
Sell 22500 CE (weekly) @ ₹50
Buy 22500 CE (monthly) @ ₹70
Net Cost = ₹20
👉 You make money if price stays near 22500 by expiry of short leg.
Profits from time decay of the short leg.
🧠 7. Ratio Spreads – Advanced Directional with a Twist
Used when: You expect a move in one direction, but want to reduce cost.
Bull Call Ratio Spread
Buy 1 lower Call
Sell 2 higher Calls
Example:
Buy 22000 CE @ ₹100
Sell 2× 22200 CE @ ₹60 each
Net Credit = ₹20
If market moves moderately up — you profit.
But if it rises too fast — risk increases.
👉 Suitable for experienced traders only — manage risk carefully.
🧠 8. Covered Call – Income Strategy for Investors
Used when: You hold stocks and want to earn extra income.
How it works:
Hold 100 shares of a stock
Sell 1 OTM Call
Example:
You own 100 shares of Reliance @ ₹2500
Sell 2600 CE @ ₹20
If Reliance stays below ₹2600, you keep the premium.
If it rises above ₹2600, your shares get sold, but you still profit.
👉 Perfect for long-term investors.
🧠 9. Protective Put – Insurance for Your Stock
Used when: You own shares but want downside protection.
How it works:
Hold stock
Buy 1 ATM/OTM Put
Example:
Own Infosys @ ₹1500
Buy 1480 PE @ ₹20
If stock falls below ₹1480, your loss is capped.
👉 It’s like buying insurance for your portfolio.
🧠 10. Butterfly Spread – Range-Bound Precision Strategy
Used when: You expect minimal movement and want low-risk, high-RR trade.
How it works (Call Butterfly):
Buy 1 lower strike Call
Sell 2 middle strike Calls
Buy 1 higher strike Call
Example:
Buy 22000 CE
Sell 2× 22200 CE
Buy 22400 CE
You earn if market expires at the middle strike.
Max loss = Net debit
Max profit = At middle strike
👉 Best for expiry day premium decay strategies.
Common Mistakes to Avoid
Not understanding strategy risk
Using high-margin strategies without protection
Overtrading in expiry week
Not adjusting trades as market moves
Ignoring volatility impact (IV crush)
🛠 Tools to Use
Option Chain (for strike selection)
IV (Implied Volatility) data
Open Interest (OI)
Strategy Builder platforms (e.g. Sensibull, Opstra, or TradingView)
🎯 Final Thoughts
Advanced options trading isn’t gambling — it’s about smart risk management.
These strategies:
Give you control
Limit losses
Provide flexibility across different market types
X-indicator
Learn Institutional Trading📌 What is Institutional Trading?
Institutional trading refers to trading done by large financial organizations like:
Hedge Funds
Mutual Funds
Foreign Institutional Investors (FIIs)
Domestic Institutional Investors (DIIs)
Insurance Companies
Proprietary Trading Firms (Prop Desks)
Investment Banks
🧭 Why Should You Learn Institutional Trading?
Most retail traders:
Enter trades based on emotions or random indicators
Chase price or react late
Trade without understanding who controls the market
But institutions:
Trade with logic, precision, patience, and volume
Follow clear rules based on liquidity, risk, and timing
Use data-driven strategies and structure-based entries
Learning institutional trading means:
✅ You no longer follow retail traps
✅ You align your trade with the market’s real direction
✅ You understand where and why price truly moves
🧱 Key Concepts to Learn in Institutional Trading
1. Market Structure (MS)
Institutional traders analyze price based on structure, not indicators.
They study:
Higher Highs / Higher Lows (HH/HL)
Lower Highs / Lower Lows (LH/LL)
Break of Structure (BOS)
Change of Character (CHOCH)
💡 Pro Tip: Price never moves randomly — it follows structure. Learning how price breaks previous structure shows when the trend is shifting.
2. Liquidity & Smart Money Concepts
Institutions need liquidity to place big orders. So, they look for:
Retail stop-loss zones
Breakout traders’ entries
Obvious support/resistance
Then, they:
Create fake breakouts to grab liquidity
Enter in the opposite direction
Leave behind “footprints” like Order Blocks or FVGs
📌 Important Concepts:
Liquidity Pools
Inducement Zones
Order Blocks (last candle before the move)
Fair Value Gaps (FVG)
Mitigation Zones
📊 Institutions don’t chase price — they manipulate it. Learn to trade where they are entering, not where retailers are exiting.
3. Volume Analysis & Order Flow
Institutions trade with massive capital, so their footprints show up in:
Volume spikes
Imbalance between buyers/sellers
Absorption (when large orders block the market)
Rejections at key zones
🔧 Tools used:
Volume Profile
Delta Volume / Footprint Charts
VWAP (Volume Weighted Average Price)
4. Options Data & Open Interest (OI)
Institutions use option chains to trap or hedge retail participants. They track:
Open Interest Build-up (Call or Put side)
Max Pain Level (where most options lose value)
Put/Call Ratio (PCR)
Option Writers’ Zone (where institutions want expiry)
💡 Example: If 80% OI is built on 22,000CE and price is near it, chances are high that institutions will protect that zone and keep price below it.
5. Institutional Tools & Analysis
Institutions use:
Multi-Timeframe Analysis (MTA)
News + Event Flow
Economic data + earnings
Position sizing based on volatility
Algo-driven execution
Retail traders often focus only on technical indicators — institutions use a combination of fundamentals, sentiment, macroeconomics, and flow.
🧠 Skills Needed to Trade Like Institutions
Chart Reading Without Indicators
Master price action
Understand structure, CHOCH, BOS
Supply and Demand Zone Identification
Mark strong OBs (Order Blocks)
Confirm with imbalance or FVG
Liquidity Mapping
Where will retail place SL?
What’s the inducement?
Volume + OI Reading
Use OI charts to avoid traps
Match price with volume for confirmations
Emotional Discipline
Trade with confidence
Trust your setup — not noise or tips
Risk Management
Fixed % per trade (0.5% to 1%)
SL below valid structure
📈 Example of an Institutional Setup (Bank Nifty)
Structure: Market is in a strong uptrend (HH-HL forming)
Liquidity: Price dips below previous swing low — stop-hunt likely
Order Block: 15-minute bullish OB forms with FVG
Volume: Spike seen + high OI on 49,500 PE
Entry: Bullish candle close in OB
SL: Just below OB
Target: Next liquidity zone or supply area
🔁 RR Ratio: 1:3 or better
🛠️ Tools You Can Use to Learn Institutional Trading
TradingView – Charting, structure, OBs
Chartink / Trendlyne – Option OI analysis
Sensibull / Obstra / Quantsapp – Option strategy + data
Volume Profile – Spot accumulation/distribution
ForexFactory / Investing.com – Economic calendar
Smart Money YouTube / Discord / Telegram Groups – Practice setups
🧩 Step-by-Step Plan to Learn Institutional Trading
Foundation: Learn market structure + price action
Deep Dive: Understand liquidity & smart money concepts
Tools Mastery: Volume, VWAP, OI, Option Chain
Live Practice: Backtest institutional setups
Risk System: Use proper SL, position sizing, and journaling
Mindset: Stay patient and emotion-free
Repeat: Improve setup confidence & refine edge
🚀 Final Thoughts: Trade Like an Institution, Not a Retailer
If you trade based on what’s obvious — you’re likely wrong.
If you trade based on what’s behind the move — you trade like the pros.
Institutional trading is not about complexity.
It’s about thinking ahead, managing risk, and waiting for real opportunities — not noise.

Institutional Intraday option Trading🧠 What is Institutional Intraday Options Trading?
Institutional intraday options trading refers to short-term options strategies executed by large institutions with the intent to profit from price movements, volatility, and order flow within a single trading session.
Unlike positional or swing trading, intraday strategies demand high accuracy, precision, and speed, which institutions handle using advanced systems and huge capital.
🏢 Who Are the Institutions?
Institutions that dominate intraday options trading include:
Hedge Funds
Proprietary Trading Desks (Prop Desks)
Foreign Institutional Investors (FIIs)
Domestic Institutional Investors (DIIs)
Investment Banks
Market Makers
These players have access to deep capital, faster execution platforms, and exclusive market data.
🔄 Institutional Objectives in Intraday Options
Capture Short-Term Volatility
Using strategies like Straddles, Strangles, Iron Condors.
Targeting events like news, economic data releases, or earnings.
Liquidity Management
Institutions provide liquidity through market-making and benefit from spreads.
Risk Hedging
Intraday options are also used to hedge large cash or futures positions.
Arbitrage Opportunities
Spot-Future arbitrage
Volatility arbitrage
Calendar spread arbitrage
📈 Common Institutional Intraday Option Strategies
1. Delta Neutral Scalping
Strategy: Sell ATM straddle and keep delta hedged.
Objective: Earn from theta decay and re-hedging.
2. Gamma Scalping
Based on buying options and adjusting delta frequently as prices move.
Profitable during high intraday volatility.
3. Option Writing with IV Crush
Institutions short options during events like RBI policy, Budget, or results.
Profits from rapid drop in Implied Volatility after the event.
4. Directional Betting with Flow Analysis
Tracking aggressive option buying/selling in OTM/ATM strikes.
Directional trades using high-volume & OI shifts.
5. Statistical Arbitrage
Using quant models to exploit temporary mispricings.
🧩 Institutional Footprints on Option Charts
Retail traders can spot institutional footprints by:
Large ATM Straddle positions
IV divergence in option chain
Open Interest buildup without price movement (Smart money quietly entering)
Options being written at key support/resistance zones
Example:
If Bank Nifty is consolidating near a resistance and suddenly 2 lakh OI is built up in 50 point OTM Calls with low IV – this may be Call writing by institutions expecting price rejection.
⚠️ Risks and Control Measures Used by Institutions
Real-time Risk Monitoring Tools
Delta/Gamma/Vega Exposure Management
Limit on maximum intraday drawdown
AI-driven decision engines to avoid emotional trades
✅ How Can Retail Traders Learn from Institutions?
Follow Open Interest + Volume Patterns
Observe institutional behavior on expiry days
Study option flow at key market levels
Backtest Straddles/Strangles on high IV days
Use Option Greeks for proper understanding
Always trade with risk-defined strategies (no naked selling without hedge)
📌 Final Thoughts
Institutional Intraday Options Trading is not about gambling or just clicking buy/sell — it’s an advanced, mathematically balanced, and data-backed approach to generate consistent intraday alpha from the market. Institutions often move ahead of retail due to technology, access, discipline, and experience.
Retail traders can’t copy the scale but can adapt the logic:
Focus on analyzing institutional footprints
Learn to read the option chain like a map
Use data, not emotions

Trading Master Class With Experts🎯 Objective of the Master Class
To turn intermediate or beginner traders into independent, high-probability traders.
To teach institutional strategies, advanced technical analysis, and options trading mechanics in a structured manner.
To prepare you to read price action, understand market psychology, and act with professional-level discipline.
🧑🏫 Who Are the Experts?
The instructors in a true master class are:
Institutional Traders
Full-time Professional Derivatives Traders
Algo Strategists
Portfolio Managers
Ex-Prop Desk Heads or FIIs Participants
These experts bring real P&L experience, not just theoretical certifications. They share their actual setups, mental models, risk frameworks, and do’s and don’ts from years of screen time.
📦 What You Will Learn – Detailed Modules
Module 1: Market Structure Mastery
Institutional order flow
Supply-demand vs. retail S/R
Liquidity traps and smart money movement
Module 2: Price Action + Volume Profiling
Multi-timeframe analysis
Candle psychology + Volume interpretation
How institutions "hide" their entries
Module 3: Advanced Options Trading
Intraday & positional strategies
Greeks mastery: Delta, Vega, Theta, Gamma
Hedging tactics used by professionals
Nifty & Bank Nifty strategy building
Module 4: Institutional Strategy Replication
Intraday straddle/strangle writing
IV crush exploitation during events
Option chain decoding for retail edge
Module 5: Trade Management & Psychology
Risk per trade, max drawdown, win/loss ratio
Building discipline like a hedge fund
Overcoming emotional sabotage in trading
Module 6: Live Market Sessions
Daily planning with expert insights
Live trades with explanation
Review of success/failure transparently
⚙️ Tools & Platforms You’ll Use
Option Chain Analyzers (like Sensibull, Opstra, or Greek tools)
TradingView & charting setup with expert templates
Journaling tools (Edgewonk, Notion)
Algo tools (optional module)
🧩 Who Should Join?
✅ Aspiring Traders (with some basic knowledge)
✅ Traders struggling with consistency
✅ Intraday or options traders wanting a structured framework
✅ Professionals looking to shift to full-time trading
✅ Students of finance or markets seeking practical skills
🏆 Key Benefits
Real strategies shared by real traders
Mentorship: Learn not just from books, but from mistakes and success of mentors
Live sessions to build confidence under pressure
Lifetime recording access in most premium programs
Community access for continuous growth & trade sharing
💼 Career & Income Impact
After attending this masterclass, traders often:
Gain clarity on their trading edge
Improve win-rate and risk-adjusted returns
Start coaching others or creating communities
Join or create proprietary trading setups
📅 Duration & Format
Duration: 1 Week to 6 Weeks (varies by provider)
Format: Live Zoom + Recorded + Assignments
Support: Telegram/Slack group, weekly Q&A, live trading calls
🔚 Final Thoughts
The “Trading Master Class with Experts” is not just another online program. It's a live, applied, market-tested mentorship where real experts guide you step-by-step in mastering trading psychology, strategy, and discipline.
If you're serious about scaling your trading journey, this is the fastest shortcut to reach professional-level execution and understanding.

Institution Option Trading🏢 Who Are These Institutions?
Institutions involved in option trading include:
🏦 Hedge Funds
🏢 Proprietary (Prop) Trading Firms
💼 Investment Banks
🌍 FIIs/DIIs
🧠 Pension Funds & Insurance Companies
They trade options across equities, indices (like Nifty/Bank Nifty), commodities, and currencies, often managing portfolios worth hundreds of crores.
🔍 Institutional Option Trading Strategies
1. Delta Neutral Strategy (Market-Neutral)
Example: Sell ATM straddle and hedge with futures.
Objective: Profit from time decay (theta) while keeping position neutral to price movement.
2. Volatility Arbitrage
Institutions bet on difference between implied and actual volatility.
Buy options when IV is low, sell when IV is high.
3. Calendar Spreads
Sell near expiry option, buy longer expiry of the same strike.
Used when institutions expect IV to rise but minimal short-term price movement.
4. Iron Condors and Butterflies
Multi-leg strategies for range-bound markets.
Used with large capital to generate steady income with limited risk.
5. Protective Puts / Covered Calls
Portfolio hedging: buy puts to protect against downturns, sell calls to earn extra income.
Very common among mutual funds and long-term portfolios.
📈 Option Chain Reading – Institutional Footprint
When institutions enter or adjust option positions, they leave footprints in the option chain. You can spot them by watching:
Sudden spike in OI (Open Interest) at specific strikes
Sharp rise in IV without much price movement
Heavy Put or Call writing near resistance/support zones
Unusual option activity (UOA) before key events
⚠️ How Retail Traders Can Learn From Institutional Option Trading
Track Option Chain + OI Changes Daily
Learn to Read Greeks Before Taking a Trade
Watch How IV Shifts Before & After Events
Backtest Simple Institutional Strategies (e.g. ATM Straddles)
Focus on Consistency and Capital Protection
🛑 Common Retail Mistakes in Options (Avoided by Institutions)
Buying deep OTM options blindly
Overtrading in low-volume strikes
Selling naked options without hedge
Ignoring IV or theta decay
Trading without stop-loss or adjustment plans
🧘 Conclusion: Why Mastering Institutional Option Trading Matters
Understanding how institutions trade options allows you to:
✅ Avoid emotional traps
✅ Trade with the flow of smart money
✅ Use real risk management
✅ Build income and protection strategies
✅ Improve win-rate and longevity in trading

Institutional Intraday option Trading High Volume Trades: Institutions trade in huge lots, often influencing Open Interest.
Data-Driven Strategy: Backed by proprietary models, AI, and sentiment analysis.
Smart Order Flow: Institutions use algorithms to hide their positions using Iceberg Orders, Delta Neutral Strategies, and Volatility Skew.
⚙️ Tools & Indicators Used:
Option Chain Analysis
Open Interest (OI) & OI%
Put Call Ratio (PCR)
Implied Volatility (IV)
Max Pain Theory
Gamma Exposure (GEX)
🧠 Common Institutional Strategies:
Covered Calls – Generate income on large stock holdings.
Protective Puts – Hedge downside risk.
Iron Condor / Butterfly Spread – Capture premium with neutral view.
Long Straddle/Strangle – Expecting big move post-news.
Synthetic Longs/Shorts – Replicating stock exposure using options.

Advance Option Trading vs. Master Institutional Trading🎯 What is Advance Option Trading?
Advance Option Trading means using complex option strategies to manage risk, take advantage of volatility, or make consistent income from the market.
You’re not just buying a Call or a Put here. You’re using combinations of options like:
Spreads (Bull Spread, Bear Spread)
Iron Condors
Butterflies
Ratio Spreads
Calendar Spreads
You're also learning to understand and control variables like:
Delta (directional movement)
Theta (time decay)
Vega (impact of volatility)
Gamma (rate of Delta change)
In short, it’s like playing chess with the market using tools that have defined risk and reward. You can win even if the market moves sideways or only slightly moves in your direction.
🧠 What is Master Institutional Trading?
Master Institutional Trading is about thinking and trading like big institutions – the banks, hedge funds, and FIIs (Foreign Institutional Investors). These players don’t trade like retail traders.
They control large volumes, manage millions or billions in capital, and have the ability to move markets. But here's the secret: they don’t chase price… they create price movement.
In this trading style, your focus is on:
Volume Profile
Order Blocks
Liquidity Zones
Market Structure
Smart Money Concepts (SMC)
Wyckoff Theory
You're not predicting price – you're following the footprints of big money. You’re trying to enter when institutions are entering, and avoid traps they set for retail traders.
🔄 Core Difference at a Glance
Feature Advance Option Trading Master Institutional Trading
Asset Used Options (CE/PE) Stocks, Futures, Options
Main Tool Option Greeks, Option Chain Volume Profile, Order Flow
Style Strategy-based Flow-based
Mindset Structured, mathematical Contextual, dynamic
Learning Curve High (requires math + logic) High (requires market psychology + vol read)
🧰 Tools Used
Tool Option Trading Institutional Trading
Option Chain ✅ ❌
Greeks (Delta, Theta, Vega) ✅ ❌
Volume Profile ❌ ✅
Market Structure (HH/LL) ❌ ✅
Implied Volatility (IV) ✅ ❌
Order Flow/Tape ❌ ✅
Liquidity Zones ❌ ✅
Expiry Analysis ✅ Sometimes
VWAP & POC Optional Core tool
🎯 Goals of Each Trader
🧪 Advance Option Trader:
Earn from time decay (Theta)
Use spreads to protect capital
Trade with defined risk
Take advantage of volatility crush
Scalp on expiry days using option premiums
🎯 Institutional Trader:
Trade in alignment with Smart Money
Ride major directional moves
Avoid retail traps
Use volume as a leading indicator
Trade price action with deeper logic
💥 Example in NIFTY
Let’s say NIFTY is at 22000.
✅ Option Trader's View:
Market is range-bound
Build an Iron Condor:
Sell 21800 PE, Buy 21700 PE
Sell 22200 CE, Buy 22300 CE
Max profit if NIFTY stays in range for next 3 days
✅ Institutional Trader's View:
Market faked a breakout above 22100
Big volume appeared at top, then reversed
Enters short after liquidity sweep
Targets zone near 21850, which is a demand block
🤔 Which One Should You Learn?
Your Profile Go for Option Trading Go for Institutional Trading
You like rules, logic, math ✅ ❌
You enjoy price-action & market behavior ❌ ✅
Want passive income from theta decay ✅ ❌
Want to scalp or swing big moves ❌ ✅
Prefer fixed risk/reward trades ✅ ❌
Want to track where big money trades ❌ ✅
You hate fake breakouts ❌ ✅
🧩 Can You Combine Both?
Absolutely!
In fact, many successful traders today use Institutional Trading concepts (like SMC or Volume Profile) to identify zones and then execute trades using option strategies.
Example:
Use institutional zone to identify support/resistance
Then sell options near those zones
Or place a directional option spread trade
This is called "confluence trading" – where different systems come together to build a stronger edge.
⚠️ Common Mistakes
🚫 In Option Trading:
Ignoring Greeks
Blindly buying options without IV analysis
Trading low volume strikes
Not adjusting positions
🚫 In Institutional Trading:
Overusing Smart Money concepts without confirmation
Misreading fakeouts as real breakouts
Trading against volume
Being impatient and entering early
✅ Final Summary
🔹 Advance Option Trading
You’re a strategy player
Mastering time decay, volatility, and spreads
Goal: Defined profit, controlled loss, consistent income
🔹 Master Institutional Trading
You’re a market observer
Mastering order flow, liquidity, and manipulation
Goal: Ride big moves, avoid traps, think like smart money
Volume Profile🧠 What Volume Profile Tells You:
Where Smart Money is Positioned: Institutions trade size at certain price levels. If a level has massive volume, it likely involves institutional orders.
Where Price May Reverse: Low volume areas are like "no-man's land." Price often doesn’t stay long there and either gets rejected or moves quickly.
Where Breakouts or Reversals May Happen: Combining price action with volume profile gives you powerful insight.
📥 What is Order Flow Trading?
📘 Definition:
Order Flow Trading is the real-time reading of buying and selling activity in the market by analyzing:
Bid-ask spread
Market orders
Limit orders
Volume clusters
Delta (Buy volume vs Sell volume)
This tells you who is in control: Buyers or Sellers, and whether their momentum is strong or weakening.
💡 Why Combine Volume Profile + Order Flow?
Separately, both tools are powerful. Together, they form a deadly accurate system for identifying:
Institutional interest zones
Breakout traps
Liquidity pools
Stop hunts
True vs false momentum
Where the market is likely to go next
🧱 Building Blocks: How to Read and Use Volume Profile
1. Identify the POC (Point of Control)
This is the battlefield where the most contracts were traded.
Price tends to revisit the POC like a magnet.
Trade Idea: If price is above POC and rising with volume — strong uptrend confirmation. If price breaks below POC with volume, it may reverse.
2. Look at Value Area High & Low
VAH = Value Area High = Potential resistance
VAL = Value Area Low = Potential support
Trade Idea: If price bounces from VAL with strong delta → go long. If price rejects VAH with large seller volume → go short.
3. Watch for Low Volume Nodes
These are areas where price moved fast with little trading.
Often leads to explosive breakouts or breakdowns.
Trade Idea: Trade the breakout into LVN zones with confirmation from order flow.
🧠 How to Read Order Flow (Simplified)
Step 1: Use Footprint Charts
Look inside candles at volume per price.
Find imbalances: For example, if buyers heavily dominate the top of a candle — strong breakout.
Step 2: Watch Delta
Positive Delta = More aggressive buyers
Negative Delta = More aggressive sellers
Caution: Sometimes delta diverges from price — this can signal reversals.
Step 3: Observe Cumulative Delta
Shows overall trend of buyers vs sellers.
Helps confirm whether a breakout has real commitment or is just a trap.
🔁 Example: How a Trade Comes Together
Market Context:
Nifty is approaching yesterday’s high.
Volume profile shows an LVN above the current price.
Footprint chart shows increasing buyer imbalances.
Delta is rising sharply.
Trade Idea:
Go long when price breaks into the LVN zone with rising delta.
Target is POC from previous day or upper HVN.
Stop loss just below breakout candle or VAL.
🎯 Real-World Institutional Trading Behavior
Institutions don’t chase price. They:
Accumulate at low volume pullbacks
Defend key POC levels
Trigger fake breakouts to trap retail traders
Use high volume zones to hide big orders
When you use Volume Profile + Order Flow, you’re reading their footprints. You can literally “see” where they’re active.
📌 Practical Tips to Get Started
Start With Volume Profile First
Understand where price is attracted (POC), where it stalls (VAH/VAL), and where it moves quickly (LVN).
Add Footprint Charts for Confirmation
Look at volume imbalances, delta pressure, and trapped buyers/sellers.
Use Volume Profile Across Timeframes
Weekly Volume Profile = Big picture
Daily Volume Profile = Context
Intraday Volume Profile = Execution
Mark Key Levels Before the Session
POC, VAH, VAL from previous day
Watch for reactions
Use Replays to Practice
Many platforms (like NinjaTrader, Sierra Chart, Quantower, TradingView) allow market replays. Watch how price reacts to volume levels.
🚫 Mistakes to Avoid
Don’t blindly trade every POC touch — wait for confirmation from order flow.
Don’t trade inside the value area unless volatility is high.
Don’t ignore market context (news, macro, global indices).
Don’t over-analyze — simplicity wins.
💻 Tools and Platforms
To trade with Volume Profile + Order Flow effectively, you’ll need:
TradingView (Paid plans for Volume Profile)
Sierra Chart / NinjaTrader / Quantower for full order flow features
Volume Profile indicators like Visible Range, Fixed Range, Session Volume
Footprint Chart and DOM for advanced flow reading
🧩 Final Thoughts: Is This Right for You?
Volume Profile + Order Flow Trading is used by professional traders, proprietary firms, and institutions to:
Time entries and exits with precision
Understand market logic and manipulation
Avoid false breakouts and trap zones
Follow the real flow of smart money
While it takes time to learn, this method offers unmatched insight into how markets really work.
Macro + Rate-Sensitive Asset Trading✅ What is Macro + Rate-Sensitive Asset Trading?
In basic terms:
Macro Trading is trading based on big picture economic trends — like inflation, interest rates, GDP growth, central bank policies, and geopolitical risks.
Rate-Sensitive Asset Trading focuses on those assets that react strongly when interest rates change, like:
Government bonds
Bank stocks
Real estate investment trusts (REITs)
Gold
Growth tech stocks
Commodities
Currency pairs (like USD/INR, EUR/USD)
Together, macro and rate-sensitive asset trading means analyzing global and national economic data to predict movements in specific assets and sectors.
🧠 Why is This So Important?
Because big players (FII, DII, Hedge Funds) move billions of dollars based on these macro themes.
Imagine this:
If inflation spikes → Central bank may raise interest rates
If rates go up → Bond yields rise → Bank profits rise
At the same time → Real estate slows down, gold may fall, tech stocks may suffer
And the currency (like USD or INR) may strengthen or weaken
As a trader, understanding these domino effects lets you ride big, high-conviction trades that can last for days, weeks, or even months.
🏛️ Who Controls Interest Rates?
Central banks — like the Federal Reserve (USA) or RBI (India) — adjust interest rates to control inflation and support economic growth.
Rate Hike = Borrowing becomes expensive = Slows the economy
Rate Cut = Borrowing becomes cheaper = Boosts growth
Market participants react even to expectations of these changes.
So, successful traders often read between the lines of central bank speeches, economic releases, and policy statements.
🧮 Examples of Rate-Sensitive Assets
Let’s break them down one by one:
1. Banking Stocks (HDFC Bank, ICICI Bank, SBI, Axis)
Banks make more profit when interest rates are high.
They charge more on loans and earn better margins.
So, when the RBI hikes rates, banking stocks usually go up.
📈 Trade Idea: Buy banking stocks on rate hike expectations, especially when inflation is rising.
2. Bonds and Bond Yields
Bond prices move inversely to interest rates.
When rates go up, bond prices go down, and yields go up.
Traders use this to position in debt instruments or short-duration bonds.
📉 Trade Idea: Short long-duration bonds when interest rates are expected to rise.
3. Gold and Silver
Gold is a non-interest-bearing asset.
When rates rise, bonds become more attractive → People shift from gold to fixed income → Gold falls
But during high inflation or crisis, gold can also rise as a hedge.
⚖️ Trade Idea: If real interest rates (adjusted for inflation) rise → Sell gold. If inflation is rising faster than rates → Buy gold.
4. Tech and Growth Stocks (Rate-Sensitive Equities)
High-growth companies (like tech startups or innovation companies) often rely on borrowing.
Rising interest rates increase their cost of capital.
This can compress future profits, and stock prices fall.
📉 Trade Idea: Avoid high-P/E or growth stocks during rising rate cycles. Favor value or dividend-paying stocks.
5. Real Estate / REITs
Real estate is interest-rate sensitive because home loans, EMIs, and mortgages get costlier.
When rates rise, property demand slows, and REITs (real estate investment trusts) fall.
📉 Trade Idea: Short REITs or reduce allocation during rate hike cycles.
6. Currency Pairs (Forex)
When a country hikes rates, its currency becomes stronger because it offers better returns to foreign investors.
For example, if the US Fed raises rates, the USD strengthens against INR, EUR, JPY, etc.
📈 Trade Idea: Go long on USD/INR or USD/JPY when Fed is expected to hike.
📌 How Traders Use This Information (Practical Steps)
Step 1: Develop a Macro View
Ask: Is the global economy growing or slowing?
Is inflation rising or under control?
What are central banks signaling?
Step 2: Find Asset Classes That React
If inflation rising → Buy banks, sell bonds and gold
If growth slowing → Buy bonds, sell cyclicals, maybe gold
Step 3: Time Your Entry with Technicals
Use charts (e.g., TradingView) to find good levels to enter.
Look for breakout or pullback entries.
Step 4: Manage Risk
Macro trades can move fast and big.
Always use stop losses and size your position smartly.
🧠 Pro Tips From Institutional Traders
Macro moves are slow but deep.
These trades often play out over days or weeks. Be patient.
Market moves on expectations, not news.
Price reacts before the news comes out. Get in early.
Central banks don’t always do what they say.
Learn to interpret tone, not just statements.
Watch global flows.
US rate hikes can affect Indian markets. Always zoom out.
Be aware of cycles.
Every asset class has cycles. Learn when each one outperforms.
⚠️ Risks of Macro and Rate-Sensitive Trading
Data surprises can flip the market instantly
Correlations can break (e.g., gold going up with rates)
Over-trading on news can lead to losses
Requires understanding of multiple asset classes
Long holding periods may tie up capital
📈 Real-Life Example: RBI Hike Cycle in India
Let’s say inflation in India is rising fast — food prices, fuel, etc.
RBI responds by:
Raising repo rates from 6.5% to 7.0%
Goal: Slow down spending and borrowing
What happens?
Banks rally → Nifty Bank goes up
Bonds fall → 10-year yield rises
Real estate cools off
Gold weakens if INR strengthens
Tech stocks underperform
A smart trader could:
Go long on Bank Nifty Futures
Short REITs or real estate stocks
Exit tech or auto sector temporarily
This is a textbook example of macro + rate-sensitive trading in action.
📚 Final Thoughts: Is This For You?
Macro trading with rate-sensitive assets is not for absolute beginners, but it is a powerful approach for intermediate and advanced traders.
✅ Advantages:
Big moves with logic behind them
Insight into how institutions think
Ability to diversify across assets
Trading Master Class With Experts🔰 Introduction
In today’s fast-moving financial markets, trading has evolved from basic buying and selling to data-driven strategies, advanced analysis, and systematic execution. A Trading Master Class With Experts is not just another course—it’s a comprehensive mentorship program that bridges the gap between beginner-level knowledge and professional-level performance.
This class is designed for those who are serious about trading as a skill, business, or career, and who want to learn directly from experienced traders, analysts, and market strategists. The program focuses on real-time learning, practical strategies, market psychology, and risk management, giving participants the tools to trade confidently and consistently.
🎯 Objective of the Master Class
The primary goal of the Trading Master Class With Experts is to transform retail traders into independent, strategy-based professionals. It’s structured to help you:
Understand how markets really work
Learn proven strategies from professional traders
Avoid common beginner mistakes
Build and test your own trading system
Develop the mindset and discipline of institutional-level traders
🧠 What You Will Learn
This master class covers a holistic approach to trading with a strong focus on practical execution, including:
🔍 1. Market Basics & Trader Foundation
How stock markets work
Key players: Retail vs Institutions
Types of markets: Bullish, Bearish, Sideways
Trading styles: Intraday, Swing, Positional, Scalping
Asset types: Equity, Derivatives, Forex, Crypto, Commodities
🕯️ 2. Technical Analysis
Reading and analyzing candlestick patterns
Support and Resistance theory
Trend identification and trendline accuracy
Price Action-based entry and exit techniques
Volume analysis and institutional behavior spotting
📊 3. Indicators and Tools
Moving Averages (SMA, EMA)
RSI, MACD, Bollinger Bands, Supertrend
Fibonacci retracement and projection
Volume Profile and VWAP
How to avoid indicator overloading
🧱 4. Chart Patterns & Setups
Reversal patterns: Double Top/Bottom, Head and Shoulders
Continuation patterns: Flags, Pennants, Triangles
Breakout trading vs Pullback trading
Building entry/exit rules with confirmation signals
🧮 5. Options and Futures Trading (Optional Module)
Understanding Calls and Puts
Option chain analysis and Open Interest
Option Greeks (Delta, Theta, Vega, Gamma)
Directional vs Non-directional option strategies
Institutional Option Trading Techniques
💹 6. Risk Management
Capital allocation methods
Risk-to-reward ratio and win-rate planning
Stop-loss and trailing stop methods
Diversification and exposure control
Avoiding overtrading and emotional decisions
🧘 7. Trading Psychology & Discipline
How to handle losses without fear
Dealing with greed and overconfidence
Mindset of a consistent trader
Journaling, post-trade analysis, and routine building
💻 8. Live Trading & Practical Learning
Real-time market sessions with expert commentary
Watching experts plan, execute, and review trades
Hands-on assignments and trade simulations
Market opening/closing routines
Building your personal trading plan
🔧 Advanced Topics (for Experienced Traders)
Institutional Trading Strategies
Smart Money Concepts
Volume Spread Analysis (VSA)
Multi-leg Option Strategies
Algo-trading basics (optional)
Trading Journals and performance analysis tools
👨🏫 Who Are the Experts?
This master class is conducted by a team of seasoned professionals:
Full-time traders with 10+ years of market experience
Certified technical analysts and SEBI-registered mentors
Option strategists and quantitative traders
Risk managers and trading psychologists
They provide you with:
Live mentorship
Real trade breakdowns
Direct Q&A sessions
Feedback on your trading plans
👥 Who Should Join This Master Class?
This program is ideal for:
Aspiring traders who want to start with clarity
Traders stuck at breakeven or in losses
Professionals looking to become part-time traders
Students or working individuals with serious interest in trading
Anyone who wants to trade like an institution, not a gambler
📜 Certification & Support
Upon completion, you will receive:
A certificate of participation
Access to recorded sessions
A trading toolkit: Checklists, planners, and journals
Lifetime access to community/mentorship group
🧭 Final Words
A Trading Master Class With Experts is not about shortcuts or tips. It’s a structured pathway to build you into a professional-level trader who understands risk, follows a system, and survives long-term.
Markets will always test you—but this master class gives you the skills, mindset, and mentorship to pass every test with confidence.

Technical ClassA Technical Class for Trading is a structured learning program that helps aspiring traders understand how to analyze financial markets using technical analysis. Unlike guessing market movements or relying on news, technical analysis is a science of price behavior, built on charts, patterns, indicators, and market psychology. This class is essential for anyone who wants to become a self-reliant trader in stocks, options, futures, forex, or crypto.
✅ What You Learn in a Technical Trading Class
A good technical trading class teaches how to analyze price action, spot trading opportunities, and apply disciplined risk management. Here’s what’s typically covered:
📈 1. Introduction to Technical Analysis
What is Technical Analysis?
Difference between Technical and Fundamental Analysis
Importance of studying price action and volume
Types of traders: Day Trader, Swing Trader, Positional Trader, Scalper
🕯️ 2. Candlestick Chart Reading
Candlestick charts tell stories of price movement and trader psychology.
You'll learn:
Structure of a candlestick (open, high, low, close)
Key single candlestick patterns (Hammer, Doji, Marubozu)
Dual & triple patterns (Engulfing, Morning Star, Evening Star)
How to use candles to detect reversals or continuations
📊 3. Chart Types and Timeframes
Line chart vs Bar chart vs Candlestick chart
Timeframe selection for different trading styles:
Intraday (5 min, 15 min)
Swing (1 hour, 4 hour)
Positional (Daily, Weekly)
📌 4. Support and Resistance
What are support and resistance levels?
How to identify major levels using price action
Role of psychological round numbers
Breakouts and false breakouts
How to use them for entry, exit, and stop-loss
📉 5. Trend Analysis
Understanding the direction of the market is critical.
You will learn:
How to spot uptrends, downtrends, and sideways markets
How to draw trendlines correctly
Using price structure: Higher Highs / Higher Lows
Tools like Moving Averages to confirm trends
📐 6. Chart Patterns
Chart patterns help forecast future moves.
Key patterns covered:
Reversal Patterns: Head & Shoulders, Double Top/Bottom
Continuation Patterns: Flags, Pennants, Triangles
Breakout strategies and volume confirmation
⚙️ 7. Technical Indicators
Indicators help confirm entries and manage trades.
Most-used indicators:
Moving Averages (SMA/EMA)
Relative Strength Index (RSI)
MACD (Moving Average Convergence Divergence)
Bollinger Bands
Volume analysis
How to combine indicators for smarter entries
⏳ 8. Time, Volume & Volatility
Importance of volume spikes
Volatility analysis for risk management
Understanding market sessions and timing your trades
🎯 9. Risk Management
This is where most traders fail. A technical class teaches:
How much to risk per trade (1–2%)
Risk-to-reward ratios
Where to place a stop-loss
How to avoid revenge trading
Capital preservation first, profit later
🧠 10. Trading Psychology
Handling emotions: Greed, Fear, Impatience
Importance of discipline and patience
Building confidence through planning
Developing a trading journal and sticking to rules
⚡ 11. Practical Strategy Building
The real power of a technical class lies in combining all the knowledge to build strategies:
Trend-following strategy
Reversal setups
Breakout/breakdown trades
Momentum-based trades
Intraday vs swing setups
📚 Benefits of Joining a Technical Class
Learn systematic trading instead of gambling
Avoid common beginner mistakes
Practice through live market examples
Prepare to move toward professional-level trading
Save time by learning from expert mentors
🔎 Who Should Take a Technical Class?
Aspiring full-time or part-time traders
Stock market beginners
Intraday traders, swing traders, or positional investors
Option traders who want to improve timing
Anyone who wants clarity and structure in their trading
📌 Final Thoughts
A Technical Class for Trading is not just about indicators and charts. It’s about learning a structured, rule-based approach to understanding the market. It empowers you to make trading decisions confidently and helps you grow from a beginner to a skilled, strategy-driven trader.
Whether you’re trading stocks, Bank Nifty, Nifty50, or even crypto — technical analysis is your foundation. Learn it well, practice with discipline, and your chances of success in the markets will dramatically improve.

Advance Option TradingKey Concepts in Advanced Options Trading
Multi-Leg Strategies:
Advanced options trading heavily involves multi-leg strategies — using two or more options contracts in a single trade. Popular ones include:
Iron Condor: A neutral strategy involving four different options contracts to profit from low volatility. It generates a limited profit if the stock remains within a specific range.
Straddles and Strangles: Used when expecting a large price move, but unsure of the direction. Traders buy both a call and a put option.
Butterfly Spreads: These limit both risk and reward and are ideal when the trader believes the stock will stay near a specific price.
Adjustments and Rolling:
Unlike basic options traders who may let contracts expire, advanced traders constantly adjust positions. For example, if a trade moves against them, they may "roll" the position — closing it and reopening another at a different strike or expiry.
Understanding Option Greeks:
Advanced traders don’t just bet on direction; they manage exposure to:
Delta (Direction)
Gamma (Rate of change of delta)
Theta (Time decay)
Vega (Volatility sensitivity)
Rho (Interest rate impact)
This helps in building more calculated, data-driven trades.
Volatility Trading:
Volatility is key in advanced options. Some traders look to exploit Implied Volatility (IV) — pricing of future volatility — by trading IV crush around earnings or economic events. For instance, an Iron Condor may be used when IV is high, aiming to profit from the IV drop.
Directional vs. Non-Directional Trading:
Advanced traders often prefer non-directional strategies. These are setups where you can make money even if the market goes sideways, such as with Iron Condors or Calendar Spreads.
Risks in Advanced Options Trading
While the rewards can be higher, so are the risks. Complex strategies can lead to significant losses if misunderstood. Margin requirements can be high, and some trades may have unlimited loss potential (e.g., uncovered calls). Hence, strict risk management, stop-loss rules, and position sizing are essential.
Final Thoughts
Advanced options trading is not for beginners, but for those who want to move beyond simply guessing market direction. It’s about constructing trades that work in various market conditions — bullish, bearish, or sideways — and using volatility and time as weapons. With the right knowledge and discipline, advanced options can become a powerful tool in any trader’s arsenal. However, success requires education, continuous learning, and a clear understanding of risk and reward

Integration of SWAP charges and Leverage for Strategy backtest.Backtesting in Pine Script often gives idealized results, but real trading involves financing costs like SWAP charges and the impact of leverage. Ignoring these can lead to a misleading strategy performance.
✅ Use-case:
Forex swing trading
Overnight Index strategies
Leveraged day-trading
📌 Key Features:
Adjustable leverage (e.g., 5x, 10x)
Customizable SWAP cost (as % or fixed amount)
P&L adjusted after each trade entry/exit
Performance metrics reflect net of financing costs
💬 Question for the community:
How to integrate SWAP charges and Leverage (for Forex trading) into Pine Script to backtest a strategy? Have you found a more precise or automated method (perhaps broker feed integration)?
Let's improve Pine-based backtesting together.
Drop your ideas, techniques, or improvements below. 👇
Institutional Trading StrategiesWhat is Institutional Trading?
Institutional trading means the buying and selling of stocks, futures, options, and other financial instruments by large organizations. These organizations are often:
Mutual Funds
Pension Funds
Hedge Funds
Banks and Insurance Companies
Foreign Institutional Investors (FII)
Domestic Institutional Investors (DII)
Unlike retail traders who trade with small amounts of capital, institutional players move huge sums of money, sometimes trading in crores or billions in a single day.
Why Do Institutions Trade Differently?
Institutions have massive capital, so their approach is completely different:
They can’t enter or exit a stock quickly without moving its price.
They focus more on long-term positions or large short-term trades.
They use advanced tools like algorithms, high-frequency trading, and exclusive market data.
In simple words: they trade like whales in the ocean, while retail traders are like small fish.
Core Institutional Trading Strategies Explained
1. Order Flow and Volume Analysis
Institutions often leave their footprint in the market by how much they buy or sell. This is visible through volume spikes and order flow. Retail traders can track this by:
Watching unusual volume on a stock
Monitoring delivery percentage (for cash segment)
Using indicators like VWAP (Volume Weighted Average Price) to see where large trades are happening
Institutions use volume as a key indicator because when big money flows in, prices generally follow.
2. Order Block and Supply-Demand Zones
Institutions don’t buy stocks in one go. They accumulate positions slowly within certain price ranges. These areas are called:
Order Blocks – zones where large buying or selling has happened in the past.
Supply-Demand Zones – areas where the market reacts due to prior institutional activity.
When price comes back to these zones, you will often see a strong bounce (demand) or rejection (supply).
3. Breakout and False Breakout Manipulation
Institutions are masters of manipulation. They often cause:
False Breakouts to trap retail traders.
Breakdown traps to collect positions cheaply.
You will see prices breaking key levels (like support or resistance), triggering retail stop losses, and then reversing sharply. Institutions use liquidity from these retail stop losses to enter or exit positions.
4. Volume Weighted Average Price (VWAP) Strategy
Most institutions benchmark their trades around VWAP.
When prices are above VWAP, the bias is bullish.
When prices are below VWAP, the bias is bearish.
Institutions often buy when price retraces to VWAP after a breakout and sell when it tests VWAP after a breakdown. VWAP acts like a fair value line for many large traders.
5. Liquidity Hunting and Stop Loss Fishing
Institutions need liquidity to place large orders. So they create fake moves:
Push prices higher to make retail buy, then sell into it.
Push prices lower to trigger retail stop-losses and then reverse the price upwards.
This is why retail traders often feel the market is “hitting my stop-loss and then moving in my direction”.
6. Options Data Analysis
Institutions hedge their cash and futures positions using options:
High Open Interest (OI) at certain strike prices indicates important levels.
Sudden OI build-up can show institutional call writing (bearish) or put writing (bullish).
Institutions use Option Selling strategies because time decay (theta) works in their favor.
Retail traders can track option data to understand institutional bias, especially around expiry.
7. Algorithmic Trading (Algo Trading)
Institutions use computers (algos) to execute trades based on pre-defined rules:
Speed: Algos trade in microseconds.
Precision: No emotions, just system-based entries and exits.
Scalability: Handles thousands of orders simultaneously.
You can’t compete with algos on speed, but you can follow the flow by watching patterns like sudden large candles without news or price bouncing off VWAP repeatedly.
8. Fundamental Catalysts Trading
Institutions also trade based on news, earnings, and economic data:
Positive quarterly results → gradual accumulation before the news
Interest rate changes → repositioning in banking stocks
Government policy changes → entering sectors like infrastructure or defense
They often buy early before the public knows and sell after retail traders start entering.
9. Sector Rotation Strategy
Institutions rotate money between sectors:
Moving from IT to Banks
From FMCG to Auto
From Metal to Pharma
Retail traders get stuck chasing one stock, while institutions follow where big sector money is flowing. You can track sector indices (like Nifty Bank, Nifty Auto) to ride these moves.
10. Index Balancing Strategy
In indices like Nifty 50 or Sensex, institutions adjust portfolios based on:
Index addition/removal
Rebalancing due to quarterly reviews
Passive fund flows
Stock prices often jump or fall sharply around these events, giving smart traders easy trading opportunities.
How to Identify Institutional Activity as a Retail Trader
Look for unusual volume spikes
Watch for rejection or breakout around order blocks
Use VWAP as a guidance tool
Track option chain data before key events
Follow sector rotation via index charts
Watch price-action near important news events
Practical Tips for Retail Traders
Trade less, trade better: Institutions don’t chase every small move, neither should you.
Wait for confirmation: Let institutions show their hand through volume before entering.
Avoid emotional trades: The market is designed to make you emotional — don’t fall for it.
Risk management is king: Institutions have risk teams; you must use stop-loss.
Never blindly follow tips: By the time you hear news, institutions are already in or out.
Why Institutional Strategies Work Better
Institutions follow a data-driven approach backed by:
Risk management policies
Trained analysts
Large capital to manage volatility
No emotional trading
Use of technology (Algos)
Retail traders who respect market structure and trade alongside institutions improve their win rate dramatically.
Final Thoughts
Institutional Trading is all about structure, discipline, and patience. It’s not about guessing but about observing market behavior — where are the big players active? Why is volume rising? Where is liquidity flowing?
You don’t need huge capital to benefit from institutional strategies. You simply need to follow the footprints, avoid traps, and focus on high-probability trades.
Option Trading Advanced Strategies📌 Introduction: Why Go Beyond Basic Options?
Basic option strategies like buying calls or puts, or even covered calls, offer simplicity—but they don’t fully unlock the potential of options as a strategic tool.
When you enter the advanced territory, you gain the power to:
Profit in sideways markets
Neutralize directional risks
Create high-probability income
Minimize drawdowns
Take advantage of volatility shifts
Advanced strategies require you to understand multi-leg positions, greeks, risk/reward shaping, and market timing.
Let’s break it all down into clear, real-life explanations.
🧩 1. Iron Condor – Profit in Range-Bound Markets
🔍 What is it?
An Iron Condor involves selling a call spread and a put spread at the same time, expecting the stock/index to stay in a tight range.
🔧 Construction:
Sell 1 OTM Call
Buy 1 further OTM Call
Sell 1 OTM Put
Buy 1 further OTM Put
All with same expiry.
🎯 Ideal Market View:
Market is range-bound
You expect low volatility
No major event expected
💰 Max Profit:
Occurs when stock expires between the two short strikes
⚠️ Max Loss:
Happens when stock moves beyond outer strikes
✅ Why use it?
Generates monthly income
Defined risk
High probability if used smartly
⚖️ 2. Butterfly Spread – Profit from Precision
🔍 What is it?
The Butterfly Spread is a neutral strategy where the trader expects the stock to close near a specific price.
🔧 Construction (Call Butterfly):
Buy 1 ITM Call
Sell 2 ATM Calls
Buy 1 OTM Call
All with same expiry.
🎯 Ideal Market View:
You expect stock to move very little
Great for expiry day setups or low-volatility trades
💰 Max Profit:
When stock closes exactly at strike price of sold calls
⚠️ Max Loss:
When price moves significantly up or down
✅ Why use it?
Cheap entry cost
Controlled risk
Can return 200–300% with precise movement
🌀 3. Calendar Spread – Play on Time and Volatility
🔍 What is it?
A Calendar Spread profits from time decay and implied volatility expansion.
🔧 Construction:
Sell 1 Near-Term Option
Buy 1 Longer-Term Option
Same strike, same type (Call or Put)
🎯 Ideal Market View:
Expect stock to stay around strike price in short term
Expect volatility to increase
💰 Max Profit:
When the short-term option decays and stock remains near the strike
⚠️ Max Loss:
If stock makes a strong move or IV drops unexpectedly
✅ Why use it?
Good for earnings events
Plays time + volatility
Low capital strategy
💡 4. Ratio Spread – When You Want a Controlled Gamble
🔍 What is it?
A Ratio Spread involves selling more options than you buy (like buying 1 Call and selling 2 Calls). It’s directional but nuanced.
🔧 Construction (Call Ratio Spread):
Buy 1 ATM Call
Sell 2 OTM Calls
You can reverse for puts if bearish.
🎯 Ideal Market View:
Expect a mild bullish move, not a breakout
Moderate volatility
💰 Max Profit:
When stock closes near the short strike
⚠️ Max Risk:
If stock moves too much upward, losses can be unlimited (unless hedge is applied)
✅ Why use it?
High reward-to-risk if market behaves
Can be converted into a risk-free structure using debit/credit adjustments
🏹 5. Straddle and Strangle – Playing Big Moves
🔍 What is it?
Straddle and Strangle are volatility-based strategies.
Straddle = Buy Call + Buy Put at same strike
Strangle = Buy OTM Call + Buy OTM Put
🎯 Ideal Market View:
Expect a big move but unsure of direction
Perfect for events: earnings, budget, Fed announcements
💰 Max Profit:
When market makes a big move, either up or down
⚠️ Max Loss:
When market stays flat
✅ Why use it?
Useful before news or big breakout
Non-directional but aggressive
🧮 6. Delta-Neutral Trading – Profit Without Direction
🔍 What is it?
Delta-neutral trading aims to neutralize directional risk (delta = 0) using a combination of options and/or futures.
💡 Example:
Sell ATM Call + Buy underlying stock in proportion so total delta = 0
Or balance long and short options across strikes
🎯 Ideal Market View:
Expect volatility or time decay
No strong directional bias
✅ Benefits:
Income generation regardless of market direction
Hedged and flexible
🔁 7. Rolling Strategies – Actively Adjust for Profit
🔍 What is it?
Rolling means shifting an existing position to a new strike or expiry to manage risk or lock profit.
Use Cases:
Roll down puts in falling market
Roll up calls in bull trend
Roll to next expiry to extend time decay
✅ Benefits:
Dynamic control
Prevents stop-loss triggers
Protects profits in trending markets
🛑 Risk Management Tips for Advanced Traders
Always define max loss – Use spreads, not naked trades
Check IV before trading – High IV = sell premium; Low IV = buy premium
Position sizing – Never go all-in on a strategy
Use alerts and automation – Advanced strategies need fast reaction
Avoid illiquid options – Stick to Nifty, Bank Nifty, liquid stocks
Paper trade first – Test complex strategies without real money
📈 Real-Life Example – Iron Condor on Nifty
Let’s say Nifty is at 24,300 and expiry is 7 days away. You expect Nifty to stay between 24,000 and 24,600.
Trade Setup:
Sell 24,000 Put
Buy 23,800 Put
Sell 24,600 Call
Buy 24,800 Call
Net credit: ₹50–60
Max Profit: ₹50 if Nifty stays between 24K–24.6K
Max Loss: ₹150 if market breaks either side
This gives a 1:3 risk-reward with 70%–75% probability.
💬 Final Thoughts
Advanced option strategies aren’t about gambling—they’re about precision, hedging, and income generation with structure. They offer you more control than simple buying/selling.
But with more power comes more responsibility:
Know your market view
Know the structure of your strategy
Know when to adjust or exit
Once you understand how to read volatility, manage risk with Greeks, and construct defined-risk trades, options can become your most flexible and profitable tool in the market.
Reliance, HDFC Bank, PSU Banks Special Focus📌 Why These Stocks Are in the Spotlight
The Indian stock market in 2025 has been witnessing a powerful bull run, and three segments are consistently making headlines:
Reliance Industries – Due to digital, energy, and demerger buzz
HDFC Bank – Despite recent underperformance, it's at a crucial turning point
PSU Banks – The comeback kings, leading the financial sector with strong balance sheets and credit growth
These aren't just stocks—they are pillars of the Indian economy and barometers for sentiment, both for domestic and foreign investors. Let’s dive into each of them in depth.
🛢️ 1. Reliance Industries – The Giant with Multiple Growth Engines
📈 Market Cap & Relevance
Reliance is India’s largest company by market cap. It’s not just a conglomerate—it’s a full-blown economic ecosystem spanning:
Oil & Petrochemicals
Telecom (Jio)
Retail
Digital services (Jio Platforms)
Green Energy
⚙️ Key Drivers in 2025:
🔹 1. Jio Financial Demerger (JFS)
Post-demerger, Reliance has unlocked significant shareholder value.
JFS is slowly becoming a digital finance powerhouse with lending, insurance, and asset management plans.
Investors see JFS as a potential fintech disruptor.
🔹 2. Green Energy & Hydrogen
Ambani’s ₹75,000 crore green push is gaining traction.
New announcements around solar panel manufacturing, battery storage, and hydrogen fuel cells are bullish triggers.
India’s energy transition policies support this narrative.
🔹 3. Retail & E-commerce Expansion
Reliance Retail is aggressively expanding into Tier 2/3 towns.
Synergies with WhatsApp and JioMart are boosting the omni-channel model.
IPO expectations for Retail arm in 2025–2026.
🔹 4. Petrochemicals Recovery
With global crude stabilizing and demand picking up, O2C margins are improving.
This helps Reliance's traditional cash cow business.
💡 Technical View:
Stock recently gave a breakout above ₹3,000.
Strong institutional buying seen.
Analysts setting targets between ₹3,200–3,500 in short-medium term.
🧠 Trader Takeaway:
Ideal for long-term portfolio and sector rotation strategy.
Short-term trades possible on earnings announcements, subsidiary IPO news, or divestments.
🏦 2. HDFC Bank – Sleeping Giant at Turning Point
📉 What Happened?
HDFC Bank, post-merger with HDFC Ltd, became India’s largest private bank by balance sheet size. But ironically, the stock underperformed for much of 2023–2024.
🧾 Reasons for Underperformance:
Confusion and uncertainty post-merger
Weak deposit growth vs. credit growth
Net Interest Margins (NIMs) under pressure
Weak earnings in multiple quarters
But 2025 tells a different story.
📈 Fresh Catalysts for Re-rating:
🔹 1. Integration Settling
The merger is now largely complete from an operational standpoint.
Synergies in housing finance and cross-sell are beginning to show.
🔹 2. Deposit Base Stabilizing
Aggressive branch expansion and new digital products have improved CASA ratio.
Focus is on rural/semi-urban penetration.
🔹 3. Tech & AI Focus
New investment in digital infrastructure, robo-advisory, and AI-based lending systems.
Competing directly with fintechs rather than fearing them.
🔹 4. Valuation Comfort
Price-to-book (P/B) of ~2.1x vs historic avg of 3.2x
Institutions are seeing value accumulation zone
💡 Technical View:
After bottoming around ₹1,350–1,400, strong bounce seen.
Next key resistances: ₹1,700 and ₹1,800.
Many traders are positioning for mean reversion plays.
🧠 Trader Takeaway:
Best suited for positional trades or long-term SIP-style entries
Watch for upcoming quarterly earnings as turning point confirmation
🏛️ 3. PSU Banks – From Forgotten to Frontline
🧭 What’s Driving the PSU Bank Rally?
After years of being ignored due to NPAs, corporate defaults, and government inefficiency stigma, PSU banks are now the stars of the financial sector.
Key reasons behind this dramatic shift:
🔹 1. Asset Quality Improvement
GNPA ratios have fallen to multi-year lows
Most PSU banks are now net NPA below 1%
🔹 2. Credit Growth Resurgence
Double-digit loan growth across retail, MSME, and infrastructure
Focus on digital banking and mobile-first services have helped increase customer base
🔹 3. Government Push
Massive infra push (railways, roads, housing) is fueling credit demand
Capex-linked lending growth is largely happening via PSU banks
🔹 4. Strong Financials
BoB, Canara Bank, Union Bank, and SBI have posted record profits
Net Interest Income (NII) and Operating Profit are at all-time highs
Dividend yields of 4–6% make them attractive to income investors
🔹 5. Re-Rating by FIIs and DIIs
PSU Banks were under-owned; that’s now reversing.
With global macro uncertain, foreign funds are betting on domestic demand-driven banks.
📈 Stocks in Focus:
State Bank of India (SBI): India’s largest lender, breaking out of long-term ranges
Bank of Baroda: Strongest PSU performer in 2024, tech-heavy
Canara Bank & Union Bank: Solid earnings, undervalued
💡 Technical View:
PSU Bank index hitting new all-time highs
BoB, Canara, Union, PNB giving weekly/monthly breakouts
🧠 Trader Takeaway:
Best for momentum trading, swing trades, and F&O strategies
Investors focusing on value + dividend + PSU story
🧠 Final Thoughts
In the 2025 trading and investment landscape, Reliance, HDFC Bank, and PSU Banks offer three distinct opportunities:
Reliance is a structural long-term compounder with growth in multiple verticals.
HDFC Bank is a value + recovery bet, especially appealing to contrarian investors.
PSU Banks are momentum machines backed by real earnings and strong policy tailwinds.
They are each being watched closely by FIIs, DIIs, retail traders, and even global strategists due to India’s growing weight in global indices like MSCI and FTSE.
Global Factors Impacting Indian MarketsIntroduction
The Indian stock market, like any other major market, is deeply interconnected with global events. While domestic news like RBI policy, election results, or monsoons do influence our stocks, global factors often act as the real drivers behind sharp up-moves or crashes.
Whether you're an investor, trader, or analyst, understanding how global cues influence Nifty, Bank Nifty, Midcaps, and even commodities is essential for smart decision-making.
In this explanation, we’ll break down the major global factors, how they affect Indian markets, and what traders should watch daily and weekly.
1. U.S. Federal Reserve & Interest Rates (Fed Policy)
Why it matters:
The U.S. Federal Reserve’s interest rate decisions directly impact global liquidity. When the Fed raises rates, money becomes costlier. Foreign investors often pull out from emerging markets like India to invest in safer U.S. bonds.
Impact on India:
Rising U.S. interest rates = FII selling in India
Weakens rupee, inflates import costs (e.g., crude oil)
Tech & high-growth sectors take a hit (especially those sensitive to valuations)
2. Crude Oil Prices
India is a major oil importer—more than 80% of our crude is imported. Crude price volatility has massive ripple effects across inflation, currency, fiscal deficit, and stock market sectors.
Impact on India:
High crude = inflation + weak rupee + fiscal stress
Negatively affects oil-dependent sectors like aviation, paints, logistics, autos
Boosts oil marketing companies' revenue (but hits margins if subsidies increase)
Example:
If Brent Crude moves from $70 to $95 in a month, expect:
Nifty to correct
INR to weaken vs USD
Stocks like Indigo, Asian Paints, Maruti to face pressure
💰 3. Foreign Institutional Investors (FII) Flow
FIIs bring in billions of dollars into Indian equity and debt markets. Their buying or selling behavior is often influenced by:
Global risk appetite
Currency trends
Interest rate differentials
Geopolitical tensions
When do FIIs sell?
When the dollar strengthens
When there’s fear in global markets (e.g., war, U.S. recession)
When India underperforms vs peers
When do FIIs buy?
When global liquidity is high
India shows growth resilience vs China or other EMs
Post-election clarity, reform hopes, etc.
Daily Tip:
Watch FII cash market activity—daily inflows/outflows often decide Nifty’s intraday trend.
🏦 4. U.S. Economic Data (CPI, Jobs, GDP, PCE)
Every month, the U.S. releases:
CPI (inflation data)
Jobs Report (NFP)
GDP numbers
PCE (Personal Consumption Expenditures)
These influence Fed decisions, hence impacting global markets.
Example:
A hot U.S. inflation print → Fear of more rate hikes → Nasdaq crashes → Nifty follows
A weak U.S. jobs report → Rate cut hopes → Global rally → Bank Nifty surges
Keep an eye on U.S. calendar events, especially the first Friday of every month (NFP Jobs) and mid-month (CPI release).
🌏 5. Geopolitical Tensions & Wars
Markets hate uncertainty. Global conflicts often lead to panic selling, flight to safety, and surge in gold/crude prices.
Key global risk zones:
Russia-Ukraine
Middle East (Israel-Iran, Saudi-Yemen)
China-Taiwan-U.S. tensions
Impact on India:
Spike in gold and crude
Selloff in equity markets
Rise in defensive sectors (FMCG, Pharma, IT)
Surge in defence stocks (BEL, HAL, BDL)
💱 6. Dollar Index (DXY) & USD-INR Movement
The Dollar Index (DXY) measures the dollar's strength vs other currencies.
Rising DXY = Stronger dollar = FII outflows from India = Nifty weakens
Falling DXY = More risk-on = Money flows into emerging markets = Nifty rallies
Rupee’s role:
A weak INR/USD makes imports costly → impacts inflation
A strong INR/USD helps improve trade balance → attracts investors
💹 7. Global Equity Markets (Dow Jones, Nasdaq, Asian Peers)
The Indian market is heavily influenced by:
Dow Jones, Nasdaq (overnight sentiment)
SGX/GIFT Nifty (pre-market cues)
Asian Markets (Nikkei, Hang Seng, Shanghai)
How it affects us:
Strong global cues = Nifty opens gap-up
Weak Nasdaq = IT stocks sell off at open
Mixed Asian markets = Rangebound Nifty till clarity
Pro Tip: Always check Nasdaq futures and GIFT Nifty levels before the market opens.
🧭 8. China’s Economic Health
As a large global player in manufacturing, China’s growth (or lack of it) sends signals across the world.
If China slows down:
Commodities fall (good for India)
Asian currencies weaken
Global markets get jittery
If China shows strong stimulus:
Metal stocks rally globally (Tata Steel, Hindalco benefit)
Global optimism lifts all EMs
🏦 9. Global Banking or Financial Crises
Remember the Silicon Valley Bank collapse (2023)? Or the 2008 Lehman crisis?
Global financial stress always triggers:
A sell-off in Indian banks
Panic across all indices
Shift toward safe havens (gold, USD)
Traders should monitor:
Global bond yields
Credit Default Swaps (CDS spreads rising = trouble)
Bank stress signals in Europe/U.S.
🌾 10. Global Commodity Cycles (Metals, Energy, Agri)
India, being resource-dependent, reacts to global commodity moves.
Rally in metals = Tata Steel, Hindalco, JSW Steel surge
Rally in coal, oil = Uptrend in ONGC, Coal India, Oil India
Rally in agri = FMCG and consumer food stocks affected
Keep a watch on:
LME (London Metal Exchange) prices
Global wheat/rice/cocoa/sugar trends
🛑 Final Thoughts
Global factors are not just background noise. They are active triggers that move Indian markets every single day.
A smart trader or investor should:
Track global cues as seriously as domestic ones
Prepare for overnight risks using hedges or stop losses
Read market behavior through global context, not just stock-level news
By staying connected to the world, you can stay one step ahead of the market.

Institution Option Trading📈 Institutional Option Trading – Complete Detailed Guide
Institutional Option Trading refers to how big financial institutions, such as banks, hedge funds, and proprietary trading firms, use options strategically in the market to manage risk, maximize profits, and control large positions with precision. This approach is highly systematic, data-driven, and based on volume, volatility, and liquidity analysis — very different from how retail traders trade options.
💡 What is Institutional Option Trading?
Institutions don’t gamble with options — they use options for:
✅ Hedging — Protecting big portfolios from market drops.
✅ Income Generation — Earning regular profits through premium selling.
✅ Directional Bets — Placing large directional trades with minimal risk.
✅ Volatility Trading — Making profits from changes in volatility without caring about market direction.
📚 Key Features of Institutional Option Trading
1. Focus on Liquidity
Institutions trade highly liquid options, usually:
Index Options (NIFTY, BANKNIFTY, SPX)
Blue-Chip Stocks (Apple, Reliance, TCS, Infosys)
Commodity Options (Gold, Crude Oil)
They avoid low-volume contracts and always trade in markets where they can enter and exit positions without slippage.
2. Use of Option Greeks
Institutions are masters of Option Greeks:
Delta for direction,
Theta for time decay profits,
Vega for volatility play,
Gamma for adjusting positions dynamically.
They don’t trade blindly but monitor how their positions react to price, time, and volatility changes.
3. Premium Selling Bias
Most institutional setups involve selling options (not just buying).
✅ Credit Spreads, Iron Condors, and Covered Calls are preferred.
Why? Because time decay works in their favor, giving consistent income.
4. Hedging Big Positions
Institutions always hedge their trades.
✅ Example: They may hold large stock positions and sell Covered Calls or buy Protective Puts to reduce risk.
✅ This creates balanced portfolios, minimizing market shocks.
✅ Institutional Trading Tools
Open Interest Analysis
Option Chain Data
IV (Implied Volatility) charts
Volume Profile & Market Profile
Real-time Greeks exposure tools
Delta-neutral hedging platforms
📝 Example of Institutional Option Trade
Scenario: NIFTY at 22,000, sideways expectation for next week.
✅ Strategy: Sell 22,500 Call, Sell 21,500 Put (Iron Condor).
✅ Buy hedges: 23,000 Call, 21,000 Put.
✅ Profit Range: If NIFTY stays between 21,500-22,500 → Max Profit.
✅ Risk Managed: Losses capped, steady time decay profit.
🚀 Benefits of Learning Institutional Option Trading
✅ Consistent income instead of gambling
✅ Risk protection using proper hedging
✅ Trade size management for scalability
✅ Ability to handle big accounts with steady growth
✅ Professional market understanding

Option Trading📈 Option Trading – Complete Beginner to Advanced Guide
Option Trading is a powerful method used in stock, forex, commodity, and index markets where you trade contracts (options) instead of buying the actual stock or asset. With options, you get the right, but not the obligation, to buy or sell an asset at a specific price within a specific time. This allows traders to profit in bullish, bearish, and sideways markets — with controlled risk and higher flexibility.
💡 What is Option Trading?
In simple words:
You buy or sell a contract, not the stock itself.
You can control big positions with less money (leverage).
You can make money even if the market goes up, down, or stays sideways.
🎁 Advantages of Option Trading
✅ Small capital, high profits with leverage
✅ Limited risk, especially in buying options
✅ Opportunity to earn in any market direction
✅ Flexible strategies for income, hedging, or speculation
✅ Ideal for short-term trades (1 day to a few weeks)
Simple Example:
You think NIFTY will rise from 20,000 to 20,500 in a week.
You buy a NIFTY Call Option (Strike Price: 20,000).
Pay premium ₹50.
If NIFTY moves to 20,500, your option value increases (maybe ₹200).
Profit = ₹150 per unit (₹200 - ₹50).
With small investment, you earn bigger returns.
✅ Basic Rules for Successful Option Trading
Trade with trend direction (use technical analysis).
Always check Open Interest & Volume.
Avoid holding close to expiry to avoid time decay (theta loss).
Start with single-leg options, move to spreads later.
Risk only 1-2% of your capital per trade.
🎯 Benefits of Mastering Option Trading
✅ Higher returns with lower capital
✅ Master multiple market conditions
✅ Ideal for intraday, swing, and positional trades
✅ Opportunity to hedge existing investments
✅ Fast skill growth in financial markets

Learn Institutional Trading💡 What Does “Learn Institutional Trading” Mean?
When you learn institutional trading, you focus on:
Smart Money Behavior — How institutions think and trade.
Market Manipulation — How the big players create fake moves to trick small traders.
Liquidity Zones — Areas where institutions enter or exit trades.
Order Blocks, Breaker Blocks, Fair Value Gaps — Special price zones where banks place their orders.
Higher Time Frame Analysis — Institutions trade on bigger time frames like 4H, Daily, and Weekly.
🎁 Why Learn Institutional Trading?
✅ Understand why price moves before big news.
✅ Learn where to enter trades with high accuracy.
✅ Trade with peace of mind by following market logic, not emotions.
✅ Get consistent profits by following smart money footprints.
🔥 Key Topics to Learn in Institutional Trading
1. Market Structure
Learn how the price moves in trends: Higher Highs, Higher Lows (Uptrend) and Lower Highs, Lower Lows (Downtrend).
Identify key swing points used by big traders.
2. Liquidity Concepts
Price always goes where liquidity is (stop-loss clusters, pending orders).
Learn about liquidity grabs, stop hunts, and false breakouts.
3. Order Blocks
The secret zones where institutions enter trades.
Once you spot order blocks, you can trade before the market moves big.
4. Fair Value Gap (FVG)
Price always returns to imbalance zones where few trades happened.
Learn to trade the gap fills with high accuracy.
5. Entry Techniques
Learn how to enter using Break of Structure (BOS) or Change of Character (CHOCH).
Use confirmation entries on lower time frames (5min, 15min) after spotting order blocks on higher time frames (4H, Daily)
🧩 Tools You Need to Learn Institutional Trading
✅ TradingView — For chart analysis.
✅ Forex Factory — For news events and market sessions.
✅ SMC Indicators — Some free, some paid tools available for order block marking.
✅ YouTube or Paid Courses — Channels like Mentfx, ICT (Inner Circle Trader), etc.
✅ Trading Journal — To track every trade and improve.
📊 Example Setup (Simple Explanation):
Timeframe: Daily chart for order block → 15min chart for entry.
Step 1: Spot Order Block on Daily.
Step 2: Wait for Liquidity Grab.
Step 3: Wait for CHOCH on 15min.
Step 4: Enter trade with SL below OB → Target previous high/low.
📝 Conclusion:
Learning Institutional Trading = Trading Smart Money Way
This method teaches you to follow the banks and big traders — not get trapped by them. Mastering these skills takes time and practice, but it transforms you from a random gambler into a professional trader.

Master Institutional Trading What is Institutional Trading?
Institutional trading involves market participation by major financial organizations that trade massive volumes of stocks, forex, commodities, or derivatives. Their trades are usually well-planned, research-driven, and executed with precision to avoid large price movements during entries and exits.
Institutions have:
Access to insider research.
Priority order execution.
Advanced algorithmic trading tools.
Huge capital, which can shift market directions.
Retail traders, in contrast, often lack these tools and operate with limited funds. However, by mastering institutional trading concepts, a retail trader can "follow the smart money" and make better, more informed trades.
🎯 Key Concepts in Master Institutional Trading
1. Market Structure
Institutional traders rely heavily on market structure — identifying how price moves in trends, ranges, and key swing points.
Higher Highs & Higher Lows in uptrends.
Lower Highs & Lower Lows in downtrends.
Liquidity zones where institutions place orders.
2. Order Blocks
Order blocks are areas on the chart where institutions have placed large buy or sell orders. These blocks often act as strong support or resistance zones where price reacts heavily.
Bullish Order Block: A zone of institutional buying.
Bearish Order Block: A zone of institutional selling.
3. Liquidity Grabs & Stop Hunts
Institutions often "hunt liquidity" by pushing the price to take out retail stop-losses before moving in the desired direction.
Stop Loss Liquidity: Targeting areas where many traders have their stops placed.
Fakeouts & Traps: Creating false breakouts to capture liquidity.
4. Imbalances / Fair Value Gaps
After strong institutional moves, price often leaves imbalances (gaps) in the market where few or no trades occur. Institutions usually revisit these gaps to "fill" them before continuing the trend.
5. Smart Money Concepts
This strategy focuses on aligning your trades with institutional activity using:
Internal/External Liquidity
Premium/Discount Pricing
High Timeframe Bias
Refined Entry Models
✅ Benefits of Mastering Institutional Trading
Trade with the Market Movers instead of against them.
Higher Accuracy, fewer fakeouts.
Better Risk Management, learning how and where institutions place their stops.
Improved Patience & Discipline, by following smart money footprints.
🚀 Popular Institutional Trading Tools
TradingView for clean charts and liquidity mapping.
MT4/MT5 with SMC indicators.
Volume Profile to see where high-volume trades occur.
Order Flow Tools (more advanced) to analyze order book data.
📝 Final Thoughts
Mastering Institutional Trading is not about copying a magic strategy but learning how the market truly operates from a smart money perspective. It requires patience, backtesting, and constant observation of market behavior. Once you align yourself with institutional flows, your win rate and consistency can dramatically improve.

The Keltner Channels Indicator ExplainedDive into the world of Keltner Channels—a powerful volatility-based indicator used by traders to spot trends, reversals, and breakout opportunities! Let’s see how you can use it to enhance your trading decisions. 🚀
What Are Keltner Channels? 🤔
Keltner Channels consist of three lines plotted around a moving average:
- The middle line: An exponential moving average (EMA), typically 20 periods.
- The upper and lower bands: Set above and below the EMA, usually by a multiple of the Average True Range (ATR).
This setup helps identify potential overbought and oversold conditions as well as trend direction.
Setting Up Keltner Channels
1. Add the Keltner Channels indicator to your chart through TradingView’s indicators tab.
2. Default settings use a 20-period EMA with channels set at 2 ATR above and below.
Reading the Keltner Channels 👀
- Price Touches Upper Band: Indicates potential overbought conditions. Some traders look for a reversal or continuation of an uptrend.
- Price Touches Lower Band: Signals possible oversold conditions. Watch for reversals or strong downtrends.
- Price Stays Near Upper Band: Shows strong bullish momentum.
- Price Stays Near Lower Band: Suggests bearish momentum.
Common Trading Strategies
- Breakout Strategy: When price closes above the upper channel, it may signal a bullish breakout; below the lower channel could indicate a bearish breakout.
- Trend Reversal: If price consistently breaks the opposite band, it might hint at an upcoming reversal.
Tips for uses📝
- Combine Keltner Channels with other indicators like RSI or MACD for extra confirmation.
- Always use risk management—set stop losses and manage position size.
- Backtest any strategy before trading live.
Final Thoughts 🧠
Keltner Channels help traders better understand market volatility and trend potential. Experiment with their settings on different assets and timeframes to find what works best for you. Happy trading! 🚦✨
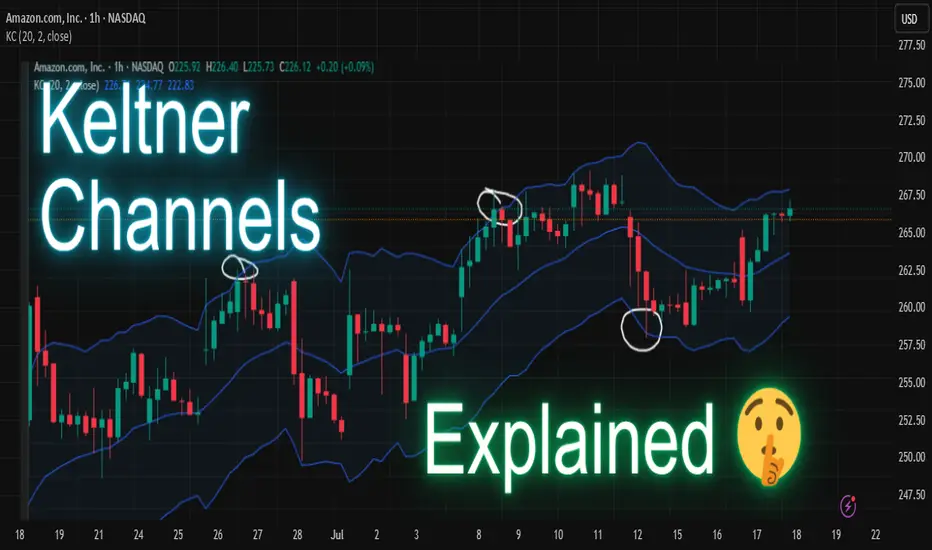
New Hedging Opportunity: Gold Futures at IIBX1. What Is IIBX—and Why Are Gold Futures a Game Changer?
India International Bullion Exchange (IIBX), based in GIFT City, Gujarat, launched gold futures trading in July 2025.
This marks the first-ever opportunity for Indian entities to hedge gold price risk onshore but in US dollars with global pricing—bridging domestic participants and international benchmarks.
Unlike traditional futures on MCX, which are rupee-denominated and influenced heavily by Indian domestic factors, IIBX futures track international market dynamics, aligning with real-time global valuations.
Why is this significant?
India is the world’s second-largest consumer of gold—by introducing a dollar-denominated, globally priced futures contract, IIBX allows traders and jewellers to hedge currency and commodity risk simultaneously.
This initiative reduces dependence on foreign exchanges like COMEX or Singapore and supports RBI/IFSCA's goal to develop a robust, transparent bullion trading ecosystem domestically.
2. Who Can Use These Futures—and How Do They Hedge?
Eligible Participants:
Qualified jewellers
Bullion dealers
Refineries
TRQ (Tariff Rate Quota) holders (currently 441+, with more in the pipeline)
Any business entity with gold-related risk exposure
Hedging Scenarios:
Jewellers: Protect import cost from rising gold prices. If they expect gold to cost $2,000/oz in three months, they can lock in prices via futures.
Refiners and Dealers: Manage margin volatility and ensure stable profit spreads regardless of gold price shifts.
TRQ operators: Offset exposure to tariff-based import risks.
Hedging Mechanics:
Buy futures if expecting price increases, offsetting rising import cost.
Sell futures (short positions) to hedge inventory or production, locking in current prices.
Since trades occur in US dollars and settle physically or in cash, participants hedge both commodity and currency risk.
3. Contract Features: What IIBX Has Built-In
📃 Specifications:
Contract unit: 1 kg gold (approx 32.15 oz)
Denomination: U.S. dollars per Troy ounce
Tick size: $0.01 per oz
Minimum trading size: 1 kg; maximum 10 kg per order
Contracts listed: Three consecutive months plus all even-months in a 13-month window (total 8 concurrent maturities)
Trading hours: 09:00–23:30 IST—keeping sync with global gold trading sessions
Risk & Margin Management:
Initial margin: At least 6% of contract value or calculated via Value‑at‑Risk (VaR)
Extreme Loss Margin (ELM): 1% buffer
Daily Mark-to-Market (MTM) settlement
Collateral controls: Members cannot fully exhaust collateral—risk-reduction thresholds are triggered at 85–90%
Concentration & spread margins: Encourage diversification by offering margin benefits for calendar spreads
Settlement:
Daily MTM in USD
Final settlement: Cash or physical delivery, based on pre-declared intent
These features ensure transparency, member protection, and global alignment—while maintaining strong oversight by IIBX and IFSCA.
4. What Makes This Hedging Opportunity Unique Now
💱 Hedge Gold and Currency Simultaneously
Standard MCX contracts hedge gold price risk but not USD/INR fluctuations.
With IIBX’s Dollar-based futures, businesses effectively lock both gold and currency exposures in one contract—critical for imports and exports.
🌍 Real-Time Global Price Alignment
IIBX uses Bloomberg’s XAU–USD spot pricing, so domestic hedges match international market moves.
This synchronisation is ideal for global trading, arbitrage, and better risk pricing.
🏛 Onshore Containerization of Hedging
Previously, Indian entities hedged overseas or bypassed through subsidiaries abroad.
Now, they can do it in GIFT City via Indian AD banks—streamlining compliance, saving on setup costs, and avoiding legal complexities.
🚀 Liquidity Boost via LES
IIBX launched a Liquidity Enhancement Scheme to incentivize market makers through rebates and reduced fees.
This seeds the market with tight spreads, better execution, and deeper order books over time.
5. Practical Use Cases for Gold Futures Hedging
✅ A. Jeweller Importer's Playbook
Estimate gold import date/volume
Sell equivalent IIBX futures at current prices
On expiry or near import — either physically take delivery or unwind position
Lock in gold cost, simplifying pricing and margin management
✅ B. Bullion Dealer/Retailer
Holds inventory — buys futures to guard against price drop
Over time, MTM fluctuations offset spot inventory gains/losses
Enables accurate working capital forecasting
✅ C. Refinery Example
Producing gold bars from scraps or raw gold
Sells refined gold in INR, but raw gold bought internationally in INR/USD
Hedging reduces mismatch, stabilizes profit margins
✅ D. Speculative/Arbitrage Traders
Play price differentials between MCX and IIBX
Exploit basis arbitrage or global/regional price plays
(Though speculative traders must be cautious of margin and regulatory requirements
7. Broader Impacts & Market Implications
🌐 Strengthening GIFT City Ecosystem
Diversifies offerings beyond forex and securities to bullion
Supports India’s vision of GIFT City as a global commodity hub
💰 Incentivizing Domestic Financial Institutions
AD banks can provide clients with hedging capabilities
Banks earn commissions and fees while helping reduce gold dependence on cash markets
🔄 Reducing Reliance on Overseas Exchanges
By offering global pricing and technology in India, overseas trading reductions save costs and complexity
🧰 Integration with Spot & Physical Markets
IIBX also operates spot segments for gold and silver
Interlinked spot-futures structure enables improved cash management and delivery coordination
8. Outlook: What Traders and Businesses Should Do Now
Assessment: Evaluate gold/currency exposures in your business (imports, inventory, exports)
Registration: Engage with AD banks for required approval and collateral setup
Education: Use IIBX’s website tutorials and circulars to understand margining and settlement norms
Start Small: Begin with a 1–2 contract hedge; monitor margin and execution
Expand Strategy: From spot hedges to calendar spreads and global arbitrage
For traders, domestic traders and arbitragers, a new tool has entered their toolbox—one that can level the playing field vs global participants.
9. Final Thoughts
The launch of Gold Futures on IIBX is a major evolution in India’s financial markets. It brings a sophisticated hedge mechanism—previously only available via overseas platforms—into the regulatory fold of GIFT City, in US dollars, tied to international prices. For jewellers, dealers, refiners, importers, and treasury teams, this is a powerful new instrument.
If adopted well, over time, it may reduce India’s dependence on international exchanges, bring more trading depth, and reduce gold price volatility for domestic stakeholders—all while supporting GIFT City’s vision as a world-class financial hub.