Patience is Profit: The Unseen Poetry of Forex Risk Management⚠️ Shocking Truth in Forex Trading ⚠️
Most traders lose not because their strategy is wrong… but because they ignore risk management.
🛡️ Mastering Risk Management in Forex Trading
Risk management is the foundation of long-term success in Forex. Many traders spend their time perfecting entries and strategies, but the real edge comes from how well you manage risk, emotions, and capital. Without these, even the best strategy will fail.
📌 Position Sizing
📉 Never risk more than 1–2% of your account on a single trade.
📏 Adjust lot size according to your stop-loss distance.
⏳ Small, controlled risks keep you in the game long enough to let your strategy work.
🎯 Risk-to-Reward Ratio
⚖️ Always aim for 1:2 or higher risk-to-reward.
📊 Even with just a 40% win rate, a positive RRR keeps you profitable.
🔑 Focus on consistency rather than chasing quick wins.
🧠 Psychology of Risk
😨 Fear makes traders exit winning trades too soon.
💰 Greed convinces them to hold onto losing trades too long.
📝 Build a personal rule: “I follow my plan, not my emotions.”
✔️ Accept losses as part of the business—risk is simply the cost of trading.
📉 Drawdown Control
🚫 Avoid over-leveraging—it magnifies both profits and losses.
🛑 Cap your risk per trade to protect account equity.
🔄 Remember: a 50% loss requires 100% gain to recover. Capital protection comes first.
🔄 Consistency Over Perfection
🎲 No strategy wins every time.
🏦 Risk management allows you to survive losing streaks.
🎰 Think like a casino: edge + probability + discipline = profit.
🧘 Trading Psychology Habits
📖 Keep a trading journal to track results and emotions.
🧩 Detach from outcomes and focus on executing your plan.
☕ Trade only when your mindset is calm and focused.
⚖️ Golden Rule
💎 Protect your capital first—profits will naturally follow.
Discipline, patience, and controlled risk are the keys to turning short-term survival into long-term success.
✅ Final Thought: In Forex, your greatest weapon is not predicting every move but mastering risk management and emotional control. The market always rewards patience, discipline, and consistency—not reckless gambling.
📢 Follow me for more Forex insights, strategies, and trading psychology content.
X-indicator

Divergance Secrets1. Introduction to Option Trading
In the world of financial markets, traders and investors are constantly looking for ways to maximize returns while managing risks. Beyond the conventional buying and selling of stocks, bonds, or commodities lies the fascinating arena of derivatives. Among derivatives, options stand out as one of the most versatile and widely used financial instruments.
An option is essentially a contract that gives the holder the right, but not the obligation, to buy or sell an underlying asset at a predetermined price before or at a specified expiration date. This flexibility allows traders to hedge risks, speculate on market movements, or design complex strategies to suit different risk appetites.
Option trading is a double-edged sword: it can generate extraordinary profits in a short span but also result in significant losses if misunderstood. Hence, before stepping into this market, it is essential to understand the fundamentals, mechanics, and strategies behind option trading.
2. Basics of Options
To understand option trading, let us first dissect the essential components.
2.1 Call Options
A call option gives the buyer the right, but not the obligation, to buy the underlying asset at a predetermined price (strike price) within a specific period.
If the asset’s price rises above the strike price, the call option holder can buy at a lower price and profit.
If the price falls below the strike, the buyer may let the option expire worthless, losing only the premium paid.
Example: If you buy a call option on Stock A at ₹100 strike and the stock rises to ₹120, you profit by exercising the option or selling it in the market.
2.2 Put Options
A put option gives the buyer the right, but not the obligation, to sell the underlying asset at the strike price before or at expiration.
If the asset price falls below the strike, the put holder benefits.
If it rises above the strike, the option may expire worthless.
Example: If you buy a put option on Stock A at ₹100 and the stock falls to ₹80, you can sell it at ₹100, making a profit.
2.3 Strike Price
The pre-agreed price at which the underlying asset can be bought or sold.
2.4 Premium
The price paid by the option buyer to the seller (writer) for acquiring the option contract. It represents the upfront cost and is influenced by time, volatility, and underlying asset price.
2.5 Expiration Date
Options have a finite life and must be exercised or left to expire on a specific date.
3. Types of Options
Options vary based on style, market, and underlying assets.
American Options – Can be exercised anytime before expiration.
European Options – Can only be exercised on the expiration date.
Equity Options – Based on shares of companies.
Index Options – Based on stock indices like Nifty, S&P 500, etc.
Commodity Options – Based on gold, silver, crude oil, etc.
Currency Options – Based on forex pairs like USD/INR.
4. Participants in Option Trading
Every option trade involves two primary parties:
Option Buyer – Pays the premium, enjoys the right but no obligation.
Option Seller (Writer) – Receives the premium but carries the obligation if the buyer exercises the contract.
The buyer has limited risk (premium paid), but the seller has theoretically unlimited risk and limited profit (premium received).
5. Why Trade Options?
Traders and investors use options for multiple reasons:
Hedging – Protecting existing investments from adverse price moves.
Speculation – Betting on market directions with limited risk.
Income Generation – Writing options to collect premiums.
Leverage – Controlling a large position with a relatively small investment.

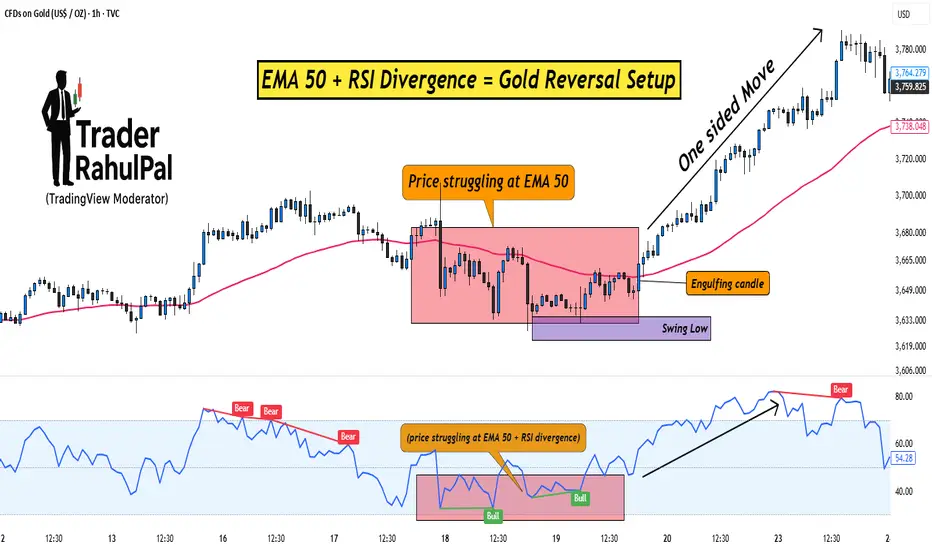
EMA 50 + RSI Divergence = Gold Reversal Setup!Hello Traders!
Gold often makes sharp one-sided moves, trapping traders who enter too late. But if you know how to combine a simple moving average with a momentum indicator, you can spot high-probability reversal setups.
One such method is using the EMA 50 together with RSI Divergence . Let’s break down how it works.
1. Why EMA 50?
The 50-period EMA acts as a dynamic trend filter.
When gold trades above it, the short-term trend is bullish; below it, bearish.
Price often retests the EMA 50 during pullbacks, making it a key level to watch for reversals.
2. What is RSI Divergence?
Divergence happens when price makes a new high/low, but RSI doesn’t confirm it.
Example: Price makes a higher high, but RSI makes a lower high → bearish divergence.
This signals that momentum is weakening, even if price is still moving strongly.
3. Combining EMA 50 with RSI Divergence
First, check where price is relative to EMA 50.
Next, look for divergence on RSI near that zone.
If both align (price struggling at EMA 50 + RSI divergence), chances of a reversal increase sharply.
4. Entry & Risk Management
Wait for a confirmation candle near EMA 50 (like engulfing or pin bar).
Place stop loss just above recent swing high/low.
Target the next support/resistance zone for exits.
Rahul’s Tip:
Don’t use divergence alone, combine it with EMA 50 for structure and you’ll filter out most false signals. This setup works best on higher timeframes like 1H or 4H for gold.
Conclusion:
EMA 50 gives you the trend filter, and RSI divergence reveals momentum weakness.
Together, they form a reliable reversal setup that helps you enter gold trades at the right time instead of chasing moves.
This Educational Idea By @TraderRahulPal (TradingView Moderator) | More analysis & educational content on my profile
If this post gave you a new setup idea, like it, share your thoughts in comments, and follow for more practical trading strategies!
Trading Goals & Objectives1. Introduction to Trading Goals
1.1 Definition
Trading goals are specific targets a trader sets to achieve in their trading journey. These goals are measurable, time-bound, and aligned with personal financial objectives. They serve as a roadmap for consistent growth in the financial markets.
1.2 Importance of Setting Goals
Direction: Goals provide a clear path in the complex world of trading.
Motivation: Traders are motivated to maintain discipline and stick to strategies.
Performance Tracking: Enables assessment of progress and adjustments in strategies.
Risk Management: Helps in defining risk thresholds and avoiding impulsive decisions.
2. Types of Trading Goals
Trading goals can vary based on time horizon, financial objectives, and risk tolerance. Understanding these types allows traders to prioritize effectively.
2.1 Short-term Goals
Definition: Targets achievable within days, weeks, or a few months.
Examples:
Achieving a 5% monthly return on investment.
Improving trade execution speed and accuracy.
Benefits: Provides quick feedback, enhances learning, and builds confidence.
2.2 Medium-term Goals
Definition: Targets achievable within 6 months to 2 years.
Examples:
Building a consistent monthly profit record.
Developing and mastering specific trading strategies.
Benefits: Encourages refinement of trading skills and adaptation to market dynamics.
2.3 Long-term Goals
Definition: Targets achievable over 3 years or more.
Examples:
Accumulating a significant trading portfolio.
Reaching financial independence through trading.
Benefits: Focuses on sustainable growth and wealth accumulation.
3. Financial Objectives in Trading
Setting clear financial objectives is a core aspect of trading goals. These objectives are usually quantifiable and define what success looks like.
3.1 Capital Growth
Objective: Increase the trading account over a specific period.
Strategy: Focus on high-probability trades and compounding returns.
3.2 Income Generation
Objective: Generate a consistent monthly or quarterly income.
Strategy: Utilize strategies like swing trading, dividend capture, or conservative day trading.
3.3 Preservation of Capital
Objective: Minimize losses and protect the principal amount.
Strategy: Employ strict risk management, stop-loss orders, and low-risk strategies.
3.4 Diversification
Objective: Spread investments across asset classes, sectors, or trading instruments.
Strategy: Combine stocks, futures, forex, options, and commodities to reduce risk.
4. Non-Financial Objectives in Trading
Trading goals are not only about money—they also involve skill development, psychological mastery, and strategic growth.
4.1 Skill Development
Learn technical analysis, fundamental analysis, and algorithmic trading.
Improve decision-making under market pressure.
4.2 Emotional Control
Develop patience, discipline, and emotional resilience.
Avoid impulsive trading and manage stress during market volatility.
4.3 Strategy Optimization
Refine trading systems and adapt to changing market conditions.
Maintain a journal to track patterns, mistakes, and profitable strategies.
4.4 Networking & Knowledge Growth
Join trading communities, seminars, and mentorship programs.
Share insights and learn from the experiences of professional traders.
5. SMART Framework for Trading Goals
To be effective, trading goals should follow the SMART criteria:
5.1 Specific
Goals should be clear and unambiguous.
Example: “I want to earn 10% monthly from my equity trades.”
5.2 Measurable
Success must be quantifiable.
Example: Track ROI, win-loss ratio, or average profit per trade.
5.3 Achievable
Goals should be realistic based on experience, capital, and market conditions.
Avoid overly ambitious targets that increase emotional stress.
5.4 Relevant
Goals should align with long-term financial and personal objectives.
Example: For a student, risk exposure should be moderate; for a professional trader, aggressive strategies might be relevant.
5.5 Time-bound
Goals should have deadlines for completion.
Example: Achieve 25% account growth within 12 months.
6. Risk and Money Management Objectives
6.1 Risk Tolerance Assessment
Understand personal risk appetite: conservative, moderate, or aggressive.
Adjust trade size, leverage, and stop-loss levels accordingly.
6.2 Position Sizing
Define how much capital to allocate per trade.
Prevents overexposure to a single market or asset.
6.3 Loss Limits
Set maximum daily, weekly, or monthly loss limits.
Example: Stop trading for the day if losses exceed 2% of total capital.
7. Performance Metrics and Objectives
Tracking progress requires clear metrics:
7.1 Win Rate
Percentage of profitable trades compared to total trades.
Helps measure consistency.
7.2 Risk-Reward Ratio
Evaluates if the potential reward justifies the risk.
Ideal ratio: at least 1:2 or higher.
7.3 Drawdown Management
Measures peak-to-trough losses.
Critical for understanding capital preservation.
7.4 Trade Frequency and Volume
Monitors the number of trades executed.
Avoid overtrading, which can increase costs and stress.
8. Setting Realistic Expectations
8.1 Market Volatility
Understand that markets are unpredictable.
Adjust goals based on volatility, economic events, and news.
8.2 Learning Curve
Accept that mistakes are part of the process.
Early losses do not reflect future potential if disciplined trading is maintained.
8.3 Capital Limitations
Goals must consider account size and available resources.
Compounding works gradually; patience is key.
9. Psychological and Behavioral Goals
9.1 Discipline
Stick to strategies and avoid impulsive decisions.
Discipline reduces the influence of fear and greed.
9.2 Patience
Wait for high-probability trade setups.
Avoid chasing markets or entering trades prematurely.
9.3 Self-Awareness
Recognize emotional triggers.
Maintain journaling and reflective practices to enhance self-awareness.
9.4 Stress Management
Incorporate routines like meditation, exercise, and breaks.
A calm mind improves decision-making and reduces costly mistakes.
10. Continuous Evaluation and Adaptation
10.1 Review Trading Journal
Track performance, strategies, and emotional responses.
Identify patterns and adjust objectives as necessary.
10.2 Adjust Goals Periodically
Market conditions, experience, and capital levels change over time.
Update goals quarterly or annually to reflect realistic targets.
10.3 Learning from Mistakes
Analyze losing trades without emotional bias.
Turn errors into opportunities for improvement.
Conclusion
Trading goals and objectives are the cornerstone of successful trading. They provide:
Clarity: Clear targets help traders navigate complex markets.
Discipline: Enforces consistent strategies and avoids emotional pitfalls.
Growth: Encourages continuous learning, skill improvement, and wealth accumulation.
A trader without goals is like a ship adrift; a trader with clear objectives charts a purposeful course, adjusts to market turbulence, and steadily moves toward financial success.
Ultimately, trading is a journey of self-discipline, strategic thinking, and continuous growth. Goals transform this journey from a chaotic venture into a structured, measurable, and rewarding pursuit.
Introduction to Cryptocurrency & Digital Assets1. Understanding the Concept of Cryptocurrency
Cryptocurrency is a type of digital or virtual currency that relies on cryptography for security. Unlike traditional currencies issued by governments and central banks, cryptocurrencies operate on decentralized networks based on blockchain technology. The key characteristics of cryptocurrencies include:
Decentralization: There is no single authority controlling the currency. Transactions and the creation of new units are managed collectively by the network.
Digital Nature: Cryptocurrencies exist only in digital form; there are no physical coins or notes.
Cryptographic Security: Transactions are secured through advanced cryptography, ensuring privacy, integrity, and immutability.
Global Accessibility: Anyone with internet access can use cryptocurrencies, making them borderless and inclusive.
The first cryptocurrency, Bitcoin (BTC), was introduced in 2009 by an anonymous entity named Satoshi Nakamoto. Since then, thousands of cryptocurrencies have emerged, each with unique features and purposes.
2. Blockchain: The Backbone of Cryptocurrency
To understand cryptocurrencies, one must understand blockchain technology. A blockchain is a distributed ledger that records all transactions across a network of computers. Its key features include:
Immutability: Once data is added to the blockchain, it cannot be altered or deleted.
Transparency: All transactions are visible to participants in the network.
Decentralization: Data is not stored in a single location; it is shared across multiple nodes, preventing single points of failure.
Consensus Mechanisms: Cryptocurrencies rely on consensus algorithms like Proof of Work (PoW) and Proof of Stake (PoS) to validate transactions.
Blockchain is not limited to cryptocurrencies—it has applications in finance, supply chain, healthcare, and more.
3. Types of Cryptocurrencies
Cryptocurrencies can be categorized into several types:
3.1 Bitcoin and Its Variants
Bitcoin (BTC): The first and most well-known cryptocurrency, primarily used as a store of value.
Bitcoin Forks: Variants like Bitcoin Cash (BCH) and Bitcoin SV (BSV) emerged due to differing opinions on scalability and transaction speed.
3.2 Altcoins
Cryptocurrencies other than Bitcoin are called altcoins.
Examples include Ethereum (ETH), Litecoin (LTC), Ripple (XRP), and Cardano (ADA).
Altcoins often introduce unique features like smart contracts, privacy enhancements, or faster transaction times.
3.3 Stablecoins
Stablecoins are pegged to traditional currencies or assets to reduce volatility.
Examples: Tether (USDT), USD Coin (USDC), Binance USD (BUSD).
They are widely used for trading, payments, and as a hedge against market volatility.
3.4 Tokens
Tokens are digital assets issued on existing blockchain platforms like Ethereum.
Utility tokens provide access to a platform or service.
Security tokens represent ownership in an asset or company, often regulated by securities laws.
Non-Fungible Tokens (NFTs) are unique digital collectibles, representing art, gaming items, or real-world assets.
4. How Cryptocurrencies Work
Cryptocurrency operations involve several components:
4.1 Wallets
Digital wallets store public and private keys, allowing users to send and receive cryptocurrencies securely.
Hot wallets are connected to the internet (e.g., mobile apps), while cold wallets are offline, offering higher security.
4.2 Mining and Staking
Mining: Process of validating transactions in PoW blockchains like Bitcoin. Miners solve complex mathematical problems to secure the network and earn rewards.
Staking: In PoS systems, users lock their cryptocurrency to validate transactions and earn rewards.
4.3 Transactions
Every transaction is recorded on the blockchain as a block.
Transactions require network validation to prevent double-spending.
Once validated, the transaction becomes permanent and traceable.
5. Benefits of Cryptocurrencies
Cryptocurrencies offer several advantages:
Decentralization: Reduces reliance on banks and governments.
Transparency: Public ledgers prevent fraud and corruption.
Security: Cryptography ensures secure transactions.
Global Accessibility: Cross-border payments are fast and inexpensive.
Financial Inclusion: Unbanked populations can access financial services.
Programmable Money: Smart contracts enable automatic execution of agreements.
6. Challenges and Risks
Despite their potential, cryptocurrencies face challenges:
Volatility: Prices can fluctuate wildly, making them risky investments.
Regulatory Uncertainty: Governments have varying approaches, from embracing to banning cryptocurrencies.
Security Threats: Exchanges and wallets are vulnerable to hacks.
Lack of Consumer Protection: Transactions are irreversible, exposing users to potential losses.
Scalability Issues: Some blockchains struggle to handle high transaction volumes efficiently.
7. Digital Assets Beyond Cryptocurrency
Digital assets encompass a wider range of digital value, not limited to currencies:
7.1 Security Tokens
Represent ownership of real-world assets like stocks, bonds, or real estate.
Can be traded on digital exchanges with blockchain efficiency.
7.2 NFTs (Non-Fungible Tokens)
Unique tokens representing digital art, music, gaming items, or intellectual property.
Ownership is recorded on the blockchain, enabling provenance and authenticity verification.
7.3 Central Bank Digital Currencies (CBDCs)
Government-issued digital currencies.
Designed to combine the benefits of digital payments with regulatory oversight.
Examples: China’s Digital Yuan, the Bahamas’ Sand Dollar.
8. Cryptocurrency Exchanges and Trading
Cryptocurrency exchanges facilitate the buying, selling, and trading of digital assets. Types of exchanges:
Centralized Exchanges (CEX): Managed by companies; examples include Binance, Coinbase, and Kraken.
Decentralized Exchanges (DEX): Peer-to-peer trading without intermediaries; examples include Uniswap and SushiSwap.
Over-the-Counter (OTC) Desks: For large-volume trades, reducing market impact.
Trading involves strategies such as day trading, swing trading, and long-term holding (HODLing). Cryptocurrency markets operate 24/7 globally, making them highly liquid but also susceptible to sudden volatility.
9. Regulatory Landscape
Governments and regulators worldwide are defining frameworks for cryptocurrency:
Regulatory Approaches:
Some countries fully embrace cryptocurrency, providing clear guidelines (e.g., Switzerland, Singapore).
Others impose strict regulations or outright bans (e.g., China, Algeria).
Taxation: Profits from cryptocurrency trading are increasingly subject to capital gains tax.
Compliance: Exchanges may require KYC (Know Your Customer) and AML (Anti-Money Laundering) verification.
10. Use Cases and Applications
Cryptocurrencies and digital assets are more than investments—they have practical applications:
10.1 Payments
Instant, cross-border transfers with lower fees than traditional banking.
10.2 Decentralized Finance (DeFi)
Financial services like lending, borrowing, and trading without intermediaries.
10.3 Tokenization of Assets
Real estate, art, and other physical assets can be represented digitally, enabling fractional ownership.
10.4 Supply Chain and Provenance
Blockchain ensures traceability of goods from production to consumer.
10.5 Gaming and Metaverse
In-game assets and virtual real estate are increasingly tokenized as NFTs.
11. Investing in Cryptocurrencies
Investing in digital assets requires careful analysis:
Fundamental Analysis: Assessing technology, team, market potential, and adoption.
Technical Analysis: Using price charts, trends, and indicators to predict market movements.
Risk Management: Diversification, stop-loss orders, and investing only what you can afford to lose.
Cryptocurrency investment can be highly profitable but equally risky due to extreme market volatility.
12. The Future of Cryptocurrencies and Digital Assets
The future of cryptocurrencies and digital assets is promising yet uncertain:
Mainstream Adoption: Increased acceptance by businesses, governments, and consumers.
Integration with Traditional Finance: Banks and financial institutions exploring blockchain solutions.
Technological Innovation: Layer 2 solutions, interoperability, and scalability improvements.
Regulatory Clarity: Balanced regulations could stabilize markets and foster innovation.
Digital Economy: Cryptocurrencies may play a critical role in digital trade, decentralized finance, and the metaverse.
13. Conclusion
Cryptocurrencies and digital assets represent a revolutionary shift in how value is created, stored, and transferred. They combine the benefits of decentralization, security, and global accessibility while presenting challenges like volatility, regulatory uncertainty, and security risks.
Understanding blockchain technology, types of cryptocurrencies, and their applications is essential for investors, businesses, and policymakers. As adoption grows, digital assets are likely to become an integral part of the global financial ecosystem, reshaping money, finance, and commerce.
Cryptocurrencies are no longer just a technological experiment—they are a new paradigm in the world of money and finance. By navigating their risks and leveraging their potential, individuals and institutions can participate in the next frontier of the digital economy.
Part 4 Learn Institutional Trading 1. Introduction to Options and Their Importance
Financial markets have evolved to provide investors with a wide variety of tools to grow wealth, manage risk, and enhance returns. Among these tools, options stand out as one of the most versatile and powerful instruments.
Options belong to the family of derivatives, meaning their value is derived from an underlying asset such as a stock, index, commodity, or currency. Unlike direct ownership (buying a stock outright), options give the investor rights but not obligations, providing flexibility in trading.
Their importance lies in:
Allowing traders to profit in both rising and falling markets.
Offering leverage (control larger positions with smaller capital).
Serving as a hedging instrument to reduce portfolio risks.
Providing a platform for sophisticated strategies that balance risk and reward.
In today’s markets — whether on Wall Street, the NSE, or other global exchanges — option trading has grown from being a niche practice for institutional investors to a mainstream financial strategy accessible to retail traders as well.
2. Basic Concepts: Calls, Puts, and Premiums
At the core of option trading are call options and put options.
Call Option: A financial contract that gives the buyer the right (not obligation) to buy the underlying asset at a predetermined price (strike price) within a specific time frame.
Example: Buying a Reliance call at ₹2,400 strike allows you to buy Reliance shares at ₹2,400 even if the market price rises to ₹2,600.
Put Option: A contract that gives the buyer the right to sell the underlying asset at a fixed strike price within a specific time frame.
Example: Buying a Nifty put at 20,000 strike allows you to sell at 20,000 even if Nifty drops to 19,500.
Premium: The price paid by the option buyer to the seller (writer) for obtaining this right. Premiums are determined by factors like volatility, time to expiry, and demand-supply.
Strike Price: The fixed level at which the buyer can exercise the right.
Expiration Date: Options are time-bound contracts. At expiry, they either get exercised (if in the money) or expire worthless.
These basic concepts form the foundation of all option strategies and trading approaches.

Key Trading Terminology Every Pro Should Know1. Market Basics
1.1 Asset Classes
Understanding asset classes is fundamental. These include:
Equities/Stocks: Ownership shares in a company.
Bonds: Debt instruments representing a loan made by an investor to a borrower.
Commodities: Physical goods like gold, oil, and wheat traded on exchanges.
Forex: Currency pairs traded in the global foreign exchange market.
Derivatives: Financial instruments whose value derives from an underlying asset, including options and futures.
1.2 Market Participants
Key players in markets include:
Retail Traders: Individual investors trading with personal capital.
Institutional Traders: Organizations such as mutual funds, hedge funds, and banks.
Market Makers: Entities that provide liquidity by quoting buy and sell prices.
Brokers: Intermediaries facilitating trading for clients.
HFT Firms: High-frequency traders using algorithms for rapid trades.
1.3 Market Orders
Orders are instructions to buy or sell an asset:
Market Order: Executed immediately at the current market price.
Limit Order: Executed only at a specified price or better.
Stop Order: Becomes a market order once a specific price is reached.
Stop-Limit Order: Combines stop and limit orders for precise execution.
2. Trading Styles and Strategies
2.1 Day Trading
Buying and selling within the same trading day to capitalize on intraday price movements.
2.2 Swing Trading
Holding positions for several days to weeks to profit from medium-term price swings.
2.3 Position Trading
Longer-term trades based on trends over weeks or months.
2.4 Scalping
Ultra-short-term trading, often seconds to minutes, targeting small profits.
2.5 Algorithmic Trading
Using automated programs to execute trades based on predefined strategies.
3. Technical Analysis Terminology
3.1 Candlestick Patterns
Visual representations of price movements:
Doji: Indicates market indecision.
Hammer: Potential bullish reversal signal.
Shooting Star: Possible bearish reversal.
3.2 Support and Resistance
Support: Price level where buying pressure prevents further decline.
Resistance: Price level where selling pressure prevents further rise.
3.3 Trend and Trendlines
Uptrend: Series of higher highs and higher lows.
Downtrend: Series of lower highs and lower lows.
Trendline: Straight line connecting significant price points to identify direction.
3.4 Indicators and Oscillators
Moving Averages: Smooth price data to identify trends (SMA, EMA).
RSI (Relative Strength Index): Measures overbought or oversold conditions.
MACD (Moving Average Convergence Divergence): Trend-following momentum indicator.
Bollinger Bands: Volatility-based price envelopes.
4. Fundamental Analysis Terminology
4.1 Key Financial Ratios
P/E Ratio: Price-to-earnings ratio indicating valuation.
P/B Ratio: Price-to-book ratio reflecting company worth relative to book value.
ROE (Return on Equity): Profitability relative to shareholder equity.
Debt-to-Equity Ratio: Financial leverage indicator.
4.2 Earnings and Revenue
EPS (Earnings Per Share): Profit allocated per outstanding share.
Revenue Growth: Increase in sales over time.
Profit Margin: Percentage of revenue converted to profit.
4.3 Macroeconomic Indicators
GDP Growth: Economic expansion rate.
Inflation (CPI/WPI): Changes in price levels.
Interest Rates: Cost of borrowing money.
5. Risk Management Terminology
5.1 Position Sizing
Determining the size of each trade relative to portfolio capital.
5.2 Stop Loss and Take Profit
Stop Loss: Limits losses if the market moves against you.
Take Profit: Automatically closes a trade when a target profit is reached.
5.3 Risk-to-Reward Ratio
Ratio of potential loss to potential gain; crucial for evaluating trade viability.
5.4 Diversification
Spreading investments across multiple assets to reduce risk exposure.
6. Derivatives and Options Terminology
6.1 Futures
Contracts to buy/sell an asset at a predetermined price and date.
6.2 Options
Contracts giving the right but not obligation to buy (call) or sell (put) an asset.
6.3 Greeks
Measure sensitivity to various factors:
Delta: Price change relative to underlying asset.
Gamma: Rate of change of delta.
Theta: Time decay of option value.
Vega: Sensitivity to volatility changes.
6.4 Leverage
Using borrowed funds to amplify trading exposure; increases potential gains and losses.
7. Market Conditions and Events
7.1 Bull and Bear Markets
Bull Market: Rising prices and investor optimism.
Bear Market: Falling prices and investor pessimism.
7.2 Volatility
Degree of price fluctuations; often measured by VIX for equities.
7.3 Liquidity
Ability to buy/sell assets quickly without affecting price significantly.
7.4 Gap
Difference between closing and opening prices across trading sessions.
7.5 Market Sentiment
Overall attitude of investors toward a market or asset.
8. Order Types and Execution Terms
Fill: Execution of an order.
Partial Fill: Only part of the order is executed.
Slippage: Difference between expected price and execution price.
Spread: Difference between bid and ask prices.
Bid/Ask: Highest price buyers are willing to pay vs lowest sellers accept.
9. Advanced Trading Terminology
9.1 Arbitrage
Exploiting price differences between markets to earn risk-free profits.
9.2 Hedging
Using instruments to offset potential losses in another investment.
9.3 Short Selling
Selling borrowed shares anticipating a price decline to buy back at lower prices.
9.4 Margin
Borrowed funds to increase position size.
9.5 Carry Trade
Borrowing at a low interest rate to invest in higher-yielding assets.
9.6 Position vs Exposure
Position: Current holdings in an asset.
Exposure: Potential risk from current positions.
10. Psychological and Behavioral Terms
FOMO (Fear of Missing Out): Emotional bias leading to impulsive trades.
Fear and Greed Index: Measures market sentiment extremes.
Overtrading: Excessive trades driven by emotions rather than strategy.
Confirmation Bias: Seeking information that supports pre-existing views.
Loss Aversion: Tendency to fear losses more than value gains.
11. Key Metrics and Reporting Terms
Volume: Number of shares/contracts traded.
Open Interest: Total outstanding derivative contracts.
Volatility Index (VIX): Market’s expectation of future volatility.
Market Capitalization: Total value of a company’s shares.
Index: Measurement of market performance (e.g., Nifty 50, S&P 500).
12. Global Market Terms
ADR/GDR: Instruments for trading foreign shares in domestic markets.
Forex Pairs: Currency combinations like EUR/USD or USD/JPY.
Emerging Markets: Developing economies with growth potential but higher risk.
Commodities Exchange: Platforms like MCX, NYMEX for commodity trading.
13. Regulatory and Compliance Terms
SEBI/NSE/BSE Regulations: Regulatory frameworks governing trading in India.
FATCA/AML: Compliance rules for taxation and anti-money laundering.
Circuit Breaker: Market mechanism to halt trading during extreme volatility.
14. Conclusion: Why Terminology Matters
Mastering trading terminology is crucial for professional success. Knowledge of terms enhances decision-making, improves risk management, and fosters confidence when interpreting market conditions. Professional traders are not just skilled in execution—they understand the language of the market. From basic orders to complex derivatives, every term is a tool to decode price movements, optimize strategy, and ultimately, achieve consistent profitability.
How AI is Transforming Financial Markets1. Introduction
Financial markets have traditionally relied on human expertise, intuition, and historical data analysis to make decisions. While these methods have served well, they are often limited by human cognitive biases, data processing constraints, and the speed at which information is absorbed and acted upon.
Artificial Intelligence, encompassing machine learning (ML), deep learning (DL), natural language processing (NLP), and predictive analytics, is enabling financial institutions to overcome these limitations. AI can process vast amounts of structured and unstructured data, identify patterns, make predictions, and execute actions in real-time. This has paved the way for smarter trading strategies, enhanced risk mitigation, and improved customer experiences.
The integration of AI in finance is not just a technological upgrade; it represents a paradigm shift in the structure and functioning of financial markets globally.
2. AI in Trading and Investment
2.1 Algorithmic Trading
Algorithmic trading refers to the use of computer algorithms to automate trading strategies. AI enhances algorithmic trading by making it adaptive, predictive, and capable of handling complex patterns that traditional models may overlook.
Machine Learning Algorithms: AI-powered algorithms can analyze historical data and detect subtle market patterns to make predictions about asset price movements. Unlike traditional models that rely on fixed rules, machine learning algorithms continuously learn and adapt based on new data.
High-Frequency Trading (HFT): AI facilitates HFT by enabling trades to be executed in milliseconds based on micro-market changes. AI models analyze price fluctuations, order book dynamics, and market sentiment to execute trades at optimal moments.
Predictive Analytics: AI predicts market trends, volatility, and asset price movements with high accuracy. Techniques like reinforcement learning allow models to simulate and optimize trading strategies in virtual market environments before applying them in real markets.
2.2 Robo-Advisors
Robo-advisors are AI-driven platforms that provide automated investment advice and portfolio management services. They use algorithms to assess an investor’s risk profile, financial goals, and market conditions, creating personalized investment strategies.
Accessibility: Robo-advisors democratize investing by making professional-grade financial advice accessible to retail investors at low costs.
Portfolio Optimization: AI dynamically adjusts portfolios based on market conditions, maximizing returns while minimizing risk.
Behavioral Analysis: By analyzing investor behavior, AI can provide personalized guidance to reduce emotional trading, which is a common source of losses.
2.3 Sentiment Analysis
AI leverages natural language processing to analyze news articles, social media, earnings calls, and financial reports to gauge market sentiment.
Market Prediction: Positive or negative sentiment extracted from textual data can provide early signals for stock price movements.
Event Detection: AI detects geopolitical events, regulatory changes, or corporate announcements that could impact markets.
Investor Insight: By analyzing sentiment patterns, AI helps investors anticipate market reactions, enhancing decision-making efficiency.
3. Risk Management and Compliance
3.1 Credit Risk Assessment
AI has transformed how banks and financial institutions assess creditworthiness. Traditional credit scoring models relied on limited historical data and rigid criteria, but AI can evaluate a broader set of variables.
Alternative Data: AI analyzes non-traditional data such as social behavior, transaction patterns, and digital footprints to assess credit risk.
Predictive Modeling: Machine learning models predict the probability of default more accurately than conventional statistical models.
Dynamic Risk Assessment: AI continuously monitors borrowers’ behavior and financial health, updating risk profiles in real-time.
3.2 Market Risk and Portfolio Management
AI enhances market risk management by modeling complex market dynamics and stress scenarios.
Scenario Analysis: AI simulates various market conditions, helping fund managers understand potential portfolio risks.
Volatility Prediction: Machine learning models forecast market volatility using historical data, enabling proactive risk mitigation strategies.
Optimization: AI optimizes portfolio allocations by balancing expected returns against potential risks in real-time.
3.3 Regulatory Compliance and Fraud Detection
Financial markets are heavily regulated, and compliance is critical. AI automates compliance processes and fraud detection.
Anti-Money Laundering (AML): AI detects suspicious transaction patterns indicative of money laundering or financial crimes.
RegTech Solutions: AI ensures adherence to regulatory requirements by automating reporting, monitoring, and auditing processes.
Fraud Detection: AI identifies anomalies in transaction data, preventing fraudulent activities with greater speed and accuracy than human oversight.
4. Enhancing Market Efficiency
AI improves market efficiency by reducing information asymmetry and enhancing decision-making for market participants.
4.1 Price Discovery
AI algorithms facilitate faster and more accurate price discovery by analyzing multiple data sources simultaneously, including market orders, economic indicators, and news.
4.2 Liquidity Management
AI optimizes liquidity by forecasting cash flow needs, monitoring order book dynamics, and predicting market depth.
4.3 Reducing Transaction Costs
Automated trading and AI-driven market analysis reduce operational and transaction costs, enabling more efficient markets.
5. AI in Customer Experience and Personalization
5.1 Personalized Financial Services
AI personalizes customer experiences by analyzing behavior patterns, transaction histories, and preferences.
Tailored Products: Banks and fintech firms offer customized investment products, loans, and insurance policies.
Chatbots and Virtual Assistants: AI-driven chatbots handle routine queries, transactions, and financial advice, improving customer satisfaction.
Financial Wellness Tools: AI analyzes spending and saving patterns to provide actionable advice, helping users achieve financial goals.
5.2 Behavioral Insights
By understanding investor behavior, AI helps reduce irrational decisions, encourages disciplined investing, and supports financial literacy.
6. AI-Driven Innovation in Financial Products
AI is not only enhancing existing financial services but also driving the creation of new products.
Algorithmic Derivatives: AI designs derivatives and structured products tailored to specific investor needs.
Dynamic Insurance Pricing: AI models assess risk dynamically, enabling real-time premium adjustments.
Smart Contracts and Blockchain: AI combined with blockchain technology automates contract execution, reducing counterparty risks and improving transparency.
7. Challenges and Risks of AI in Financial Markets
While AI offers numerous advantages, its adoption also comes with challenges:
7.1 Model Risk
AI models are only as good as the data and assumptions underlying them. Poorly designed models can lead to significant financial losses.
7.2 Ethical and Regulatory Concerns
AI’s decision-making process is often opaque (“black-box problem”), raising concerns about accountability, fairness, and compliance.
7.3 Cybersecurity Threats
AI systems are vulnerable to cyber-attacks, data breaches, and adversarial attacks that can manipulate outcomes.
7.4 Market Stability
The widespread use of AI in high-frequency trading and algorithmic strategies may amplify market volatility and systemic risks.
8. Case Studies of AI Transforming Financial Markets
8.1 JPMorgan Chase: COiN Platform
JPMorgan’s Contract Intelligence (COiN) platform uses AI to analyze legal documents and extract key data points, reducing manual review time from thousands of hours to seconds.
8.2 BlackRock: Aladdin Platform
BlackRock’s Aladdin platform integrates AI for risk management, portfolio optimization, and predictive analytics, providing a comprehensive view of market exposures and investment opportunities.
8.3 Goldman Sachs: Marcus and Trading Algorithms
Goldman Sachs uses AI-driven trading algorithms for securities and commodities, while Marcus leverages AI to enhance customer lending and risk assessment processes.
8.4 Retail Trading Platforms
Platforms like Robinhood and Wealthfront utilize AI to offer personalized recommendations, portfolio rebalancing, and real-time insights to millions of retail investors.
9. Future Trends
9.1 Explainable AI (XAI)
Future financial markets will increasingly demand AI systems that are transparent and explainable, ensuring accountability and regulatory compliance.
9.2 Integration with Quantum Computing
Quantum computing combined with AI could revolutionize financial modeling, enabling previously impossible optimizations and simulations.
9.3 Cross-Asset AI Trading
AI will integrate insights across equities, commodities, currencies, and derivatives, enhancing cross-asset trading strategies.
9.4 Democratization of AI Tools
As AI tools become more accessible, retail investors and smaller institutions will be able to leverage advanced analytics, leveling the playing field.
9.5 Sustainable and Ethical Finance
AI will help investors incorporate ESG (Environmental, Social, Governance) factors into investment decisions, promoting sustainable financial markets.
10. Conclusion
AI is fundamentally reshaping financial markets, making them faster, smarter, and more efficient. From algorithmic trading and risk management to customer personalization and product innovation, AI’s applications are extensive and transformative. However, this transformation comes with challenges, including ethical concerns, regulatory compliance, cybersecurity risks, and market stability issues.
As AI continues to evolve, financial markets will likely witness further innovation, democratization, and efficiency. Institutions that effectively harness AI while managing its risks will be best positioned to thrive in the increasingly complex and dynamic global financial ecosystem.
In essence, AI is not just changing how financial markets operate—it is redefining the very nature of finance, turning data into intelligence, and intelligence into strategic advantage. The future of financial markets will be defined by those who can master the synergy between human insight and artificial intelligence.
Importance of Option Greeks in Trading and Risk Management1. Understanding Options and Their Intrinsic Complexity
Options are contracts that provide the holder with the right, but not the obligation, to buy or sell an underlying asset at a predetermined price (strike price) on or before a specific date (expiration). There are two primary types of options:
Call Options: Give the right to buy an asset.
Put Options: Give the right to sell an asset.
The value of an option is influenced by several factors, including:
Underlying asset price
Strike price
Time to expiration
Volatility of the underlying asset
Risk-free interest rate
Dividends (if any)
While these factors determine an option's price, the dynamic nature of the market requires traders to quantify how sensitive an option is to changes in these variables. This is where Option Greeks come into play. Greeks are named after Greek letters, each representing a specific sensitivity measure.
2. What Are Option Greeks?
Option Greeks are mathematical measures that indicate how the price of an option responds to various market factors. They provide traders with a way to quantify risk and manage exposure systematically.
The primary Option Greeks include:
Delta (Δ) – Sensitivity to underlying price changes
Gamma (Γ) – Sensitivity of Delta to underlying price changes
Theta (Θ) – Sensitivity to time decay
Vega (ν) – Sensitivity to volatility
Rho (ρ) – Sensitivity to interest rates
Each Greek serves a distinct purpose in options trading and risk management.
3. Delta (Δ): The Directional Sensitivity
Definition: Delta measures the rate of change of an option’s price relative to the change in the underlying asset's price. In simpler terms, it tells traders how much the option price is expected to move for a 1-unit move in the underlying asset.
Call options: Delta ranges from 0 to +1
Put options: Delta ranges from 0 to -1
Example:
If a call option has a Delta of 0.60 and the underlying stock moves up by $1, the option price is expected to rise by $0.60.
Importance in Trading:
Delta provides insight into the directional exposure of an options position. Traders can use Delta to:
Hedge stock positions
Estimate probability of an option expiring in the money
Construct Delta-neutral strategies
Delta Hedging:
Traders often aim to maintain a Delta-neutral portfolio to minimize the directional risk of underlying price movements. By adjusting the ratio of options and underlying assets, Delta hedging reduces the portfolio’s sensitivity to small price fluctuations.
4. Gamma (Γ): Measuring the Rate of Change of Delta
Definition: Gamma measures the rate of change of Delta with respect to changes in the underlying asset price. Essentially, Gamma tells traders how much Delta will change if the underlying price moves by one unit.
High Gamma: Delta is highly sensitive to price changes.
Low Gamma: Delta changes slowly.
Example:
If a call option has a Gamma of 0.05, a $1 increase in the stock price increases the Delta by 0.05.
Importance in Trading:
Gamma is crucial for understanding non-linear risk in options positions:
Helps traders gauge the stability of Delta.
High Gamma options are sensitive to price swings, requiring more active risk management.
Traders managing Delta-neutral portfolios monitor Gamma to adjust hedges frequently.
Practical Application:
Gamma is particularly significant for near-the-money options nearing expiration, as small price movements can cause rapid Delta changes.
5. Theta (Θ): Understanding Time Decay
Definition: Theta measures the sensitivity of an option’s price to the passage of time, also known as time decay. Theta is typically negative for long options positions because options lose value as expiration approaches, assuming all else remains constant.
Example:
If a call option has a Theta of -0.03, the option’s price will decrease by $0.03 per day due to time decay.
Importance in Trading:
Theta is critical for understanding the impact of time on option value:
Option sellers benefit from positive Theta as options lose value over time.
Option buyers experience negative Theta, requiring profitable moves in the underlying asset to offset time decay.
Practical Application:
Theta helps traders design income strategies such as:
Covered calls
Iron condors
Short straddles/strangles
Time decay can be a predictable source of profit if managed correctly.
6. Vega (ν): Sensitivity to Volatility
Definition: Vega measures the sensitivity of an option’s price to changes in implied volatility. Implied volatility reflects the market’s expectation of future price fluctuations in the underlying asset.
Example:
If a call option has a Vega of 0.10 and implied volatility rises by 1%, the option’s price increases by $0.10.
Importance in Trading:
Vega is critical for understanding the volatility risk:
High Vega options are more sensitive to changes in market volatility.
Traders use Vega to benefit from volatility trading, regardless of directional moves.
Practical Application:
Vega is central to strategies like:
Long straddles or strangles (profit from increased volatility)
Short volatility trades (profit from declining volatility)
Volatility management is especially important during earnings announcements, economic releases, or geopolitical events.
7. Rho (ρ): Interest Rate Sensitivity
Definition: Rho measures the sensitivity of an option’s price to changes in risk-free interest rates. Rho is more relevant for long-dated options, as interest rate fluctuations impact the present value of the strike price.
Example:
If a call option has a Rho of 0.05 and interest rates increase by 1%, the option price increases by $0.05.
Importance in Trading:
Rho is often less critical than Delta, Gamma, Theta, or Vega for short-term traders but is essential for long-term options strategies or interest-sensitive markets.
Practical Application:
Traders managing options in low-interest-rate vs. high-interest-rate environments monitor Rho to adjust risk exposures.
8. Interdependence of Greeks: The Dynamic Nature of Options
Option Greeks are not isolated; they interact dynamically:
Delta changes with Gamma.
Theta and Vega are interlinked as volatility affects time decay.
Multi-Greek analysis is necessary for sophisticated risk management.
For example, a near-the-money option with high Gamma and low Theta requires frequent adjustments to maintain Delta neutrality, whereas a far-out-of-the-money option with low Gamma and high Vega may be used for volatility plays.
9. Practical Applications in Trading
Option Greeks are critical tools for traders, hedgers, and portfolio managers. Some practical applications include:
9.1 Hedging Strategies
Delta Hedging: Neutralizes directional risk by balancing option and underlying asset positions.
Gamma Hedging: Ensures Delta remains stable as the underlying price moves.
Vega Hedging: Protects against volatility swings in options portfolios.
9.2 Risk Management
Identifying portfolio exposures across multiple Greeks.
Stress-testing scenarios: How would the portfolio behave under extreme price or volatility moves?
Adjusting positions dynamically to reduce undesirable risk.
9.3 Profit Optimization
Exploiting Theta decay through income-generating strategies.
Benefiting from volatility spikes using Vega-sensitive trades.
Structuring multi-leg trades with balanced Greeks for optimal risk-return.
10. Common Trading Strategies and Greeks Usage
Covered Call:
Positive Theta (time decay works in favor)
Delta is partially hedged
Protective Put:
Delta neutralizes stock exposure
Vega protects against volatility rise
Iron Condor:
Positive Theta (benefit from time decay)
Delta-neutral to minimize directional risk
Straddle/Strangle:
High Vega sensitivity (profit from volatility changes)
Requires Gamma and Theta monitoring
11. Advanced Risk Management Techniques Using Greeks
Multi-Greek Hedging:
Professional traders hedge multiple Greeks simultaneously to reduce exposure. Example: Balancing Delta, Gamma, and Vega to create a portfolio resilient to price, volatility, and time changes.
Dynamic Rebalancing:
Greeks change as market conditions evolve. Continuous monitoring and rebalancing of positions help maintain desired risk profiles.
Stress Testing and Scenario Analysis:
Using Greeks to simulate market scenarios and predict option portfolio performance. This is essential for protecting against tail risks and market shocks.
Portfolio Greeks Aggregation:
Large institutions aggregate Greeks across multiple options positions to quantify overall portfolio risk and identify vulnerabilities.
12. Importance for Retail and Institutional Traders
Option Greeks are indispensable tools for both retail traders and institutional investors:
Retail Traders:
Use Greeks to understand basic option sensitivities.
Implement strategies like covered calls, spreads, or protective puts with greater confidence.
Institutional Traders:
Conduct multi-dimensional risk management.
Hedge large portfolios using Delta, Gamma, Vega, Theta, and Rho.
Optimize portfolio performance using scenario analysis and stress testing.
13. Challenges in Using Option Greeks
While Greeks are highly useful, they come with challenges:
Complexity:
Requires understanding of multiple interacting factors.
New traders may find it overwhelming.
Dynamic Nature:
Greeks change with market movements, requiring constant monitoring.
Model Dependence:
Option Greeks are derived from pricing models (like Black-Scholes).
Model assumptions may not hold in extreme market conditions.
Liquidity and Slippage:
Large trades may not perfectly reflect calculated Greek hedges.
Despite these challenges, the benefits of using Option Greeks far outweigh the drawbacks for serious traders.
14. Conclusion
Option Greeks are fundamental tools for anyone serious about options trading and risk management. They quantify sensitivity to market variables such as price movements, volatility, time decay, and interest rates. By understanding and effectively managing Delta, Gamma, Theta, Vega, and Rho, traders can:
Reduce exposure to unwanted risks
Optimize returns
Implement complex hedging and trading strategies
Navigate volatile markets with confidence
In modern financial markets, where volatility and uncertainty are constants, Greeks offer a structured approach to understanding risk and opportunity in options trading. Mastering them is not merely a technical exercise—it is a crucial step toward becoming a disciplined, informed, and successful trader.
Option Greeks transform options from complex derivatives into measurable, manageable, and strategically valuable financial instruments, empowering traders to navigate the markets with precision and foresight.
Part 2 Ride The Big Moves 1. Option Pricing and Valuation
Option prices are determined by two main components:
1.1 Intrinsic Value
The difference between the current price of the underlying asset and the option’s strike price.
1.2 Time Value
The remaining portion of the premium, reflecting time until expiration and volatility. Options with longer time to expiration usually have higher time value.
1.3 Factors Affecting Option Prices
Underlying Asset Price: Movement in the underlying asset directly affects the option’s value.
Strike Price: Determines whether the option is ITM, ATM, or OTM.
Time to Expiration: Longer expiration provides higher flexibility and premium.
Volatility: Higher volatility increases option premiums.
Interest Rates: Rising interest rates can increase call option values and decrease put option values.
Dividends: Expected dividends reduce the value of call options.
1.4 Option Pricing Models
Black-Scholes Model: Widely used for European options, factoring in asset price, strike price, time, volatility, and risk-free rate.
Binomial Model: Flexible and suitable for American options, where early exercise is possible.
2. Risk and Reward in Options Trading
2.1 Risk for Option Buyers
The maximum risk for buyers is limited to the premium paid. If the market moves unfavorably, the option can expire worthless, but the loss cannot exceed the initial investment.
2.2 Risk for Option Sellers (Writers)
Sellers face potentially unlimited risk:
For a call writer without owning the underlying asset (naked call), losses can be infinite if the asset price rises sharply.
For put writers, losses occur if the asset price falls significantly below the strike price.
2.3 Reward Potential
Buyers have unlimited profit potential for calls and substantial profit for puts if the market moves favorably.
Sellers earn the premium as maximum profit, regardless of market movement, assuming they manage positions correctly.
3. Hedging and Speculation Using Options
3.1 Hedging
Options are a powerful tool for risk management. For instance:
Investors holding a stock can buy put options to protect against downside risk.
Traders can use options to lock in profit targets or minimize losses.
3.2 Speculation
Speculators use options to capitalize on market movements with limited capital. Examples:
Buying calls to profit from an anticipated rise.
Buying puts to profit from an anticipated fall.
Using complex strategies to exploit volatility or time decay.
4. Options in Different Markets
4.1 Stock Options
Options on individual stocks are most popular and widely traded. They provide leverage and hedging opportunities.
4.2 Index Options
Options on market indices like Nifty or S&P 500 allow traders to speculate on broader market trends.
4.3 Commodity Options
Used in commodities markets like gold, crude oil, and agricultural products for hedging or speculation.
4.4 Currency Options
Provide protection or speculation opportunities in the forex market against currency fluctuations.

Part 1 Ride The Big Moves 1. Introduction to Options Trading
Options trading is one of the most versatile and widely used financial instruments in modern financial markets. Unlike stocks, which represent ownership in a company, options are derivative contracts that give the holder the right, but not the obligation, to buy or sell an underlying asset at a predetermined price within a specified period.
Options trading can be used for speculation, hedging, and income generation. Due to their unique characteristics, options are considered advanced financial instruments that require a solid understanding of market dynamics, risk management, and strategy planning.
2. Understanding the Basics of Options
2.1 What Are Options?
An option is a contract between two parties – the buyer and the seller (or writer). The contract is based on an underlying asset, which could be:
Stocks
Indices
Commodities
Currencies
ETFs (Exchange Traded Funds)
Options come in two main types:
Call Options – Give the holder the right to buy the underlying asset at a predetermined price (strike price) within a specified period.
Put Options – Give the holder the right to sell the underlying asset at the strike price within a specified period.
2.2 Key Terms in Options Trading
Understanding options terminology is crucial:
Strike Price (Exercise Price): The price at which the underlying asset can be bought or sold.
Expiration Date: The date on which the option contract expires.
Premium: The price paid by the buyer to purchase the option.
In-the-Money (ITM): An option has intrinsic value (e.g., a call option is ITM if the underlying asset price is above the strike price).
Out-of-the-Money (OTM): An option has no intrinsic value (e.g., a put option is OTM if the underlying asset price is above the strike price).
At-the-Money (ATM): The option’s strike price is equal or very close to the current price of the underlying asset.
Intrinsic Value: The difference between the current price of the underlying asset and the strike price.
Time Value: The portion of the option’s premium that reflects the potential for future profit before expiration.
2.3 How Options Work
Options provide leverage, meaning a small amount of capital can control a larger position in the underlying asset. For example, buying 100 shares of a stock may cost ₹1,00,000, whereas purchasing a call option for the same stock may cost only ₹10,000, offering a similar profit potential if the stock moves favorably.
The profit or loss depends on:
The difference between the strike price and the market price.
The premium paid for the option.
The time remaining until expiration.
3. Types of Options Strategies
Options trading is highly versatile. Traders can adopt various strategies based on market expectations:
3.1 Basic Strategies
Buying Calls: Used when expecting the price of the underlying asset to rise.
Buying Puts: Used when expecting the price to fall.
Writing Calls (Covered Calls): Generating income by selling call options against a stock you own.
Writing Puts: Generating income or acquiring stocks at a lower price.
3.2 Advanced Strategies
Spreads: Combining two or more options to reduce risk.
Bull Call Spread: Buying a call and selling a higher strike call.
Bear Put Spread: Buying a put and selling a lower strike put.
Straddles and Strangles: Strategies to profit from volatility.
Straddle: Buying a call and a put with the same strike price.
Strangle: Buying a call and a put with different strike prices.
Iron Condor: Selling a bear call spread and a bull put spread to profit from low volatility.
Butterfly Spread: Combining multiple call or put options to profit from minimal movement around a strike price.

Understanding the Psychology of Trading1. The Role of Psychology in Trading
Trading is a mental battlefield. Financial markets are complex systems influenced by countless variables, from economic data and geopolitical events to investor sentiment. However, the human mind is inherently emotional, often reacting irrationally to market fluctuations.
Even the most robust trading strategies can fail if a trader cannot manage emotions such as fear, greed, overconfidence, or frustration. Psychological discipline ensures traders follow their plans consistently, avoid impulsive decisions, and maintain a long-term perspective. Studies suggest that over 80% of trading mistakes are rooted in poor psychological management rather than technical errors.
Key aspects of trading psychology include:
Emotional regulation: Maintaining composure in the face of gains and losses.
Cognitive control: Avoiding biases that cloud judgment.
Discipline: Following trading rules and strategies without deviation.
Resilience: Recovering quickly from losses and mistakes.
2. Common Emotional Traps in Trading
2.1 Fear
Fear is perhaps the most pervasive emotion in trading. Fear manifests in several ways:
Fear of losing: Traders may hesitate to enter positions, missing opportunities.
Fear of missing out (FOMO): Conversely, traders may impulsively enter trades to avoid missing profits, often at unfavorable prices.
Fear after losses: A losing streak can lead to panic and overly cautious behavior, reducing trading effectiveness.
Example: A trader sees a strong upward trend but hesitates due to fear of a sudden reversal. By the time they act, the price has already surged, causing frustration and regret. This cycle often leads to indecision and missed profits.
2.2 Greed
Greed is the desire for excessive gain, often leading to poor risk management. Traders may hold on to winning positions too long, hoping for unrealistic profits, or take excessive risks to recover previous losses.
Example: A trader makes a small profit but refuses to exit, hoping for a bigger gain. Suddenly, the market reverses, and the profit evaporates, turning into a loss.
2.3 Overconfidence
After a series of successful trades, traders may develop overconfidence, believing they are infallible. This often leads to reckless trades, ignoring risk management rules, and underestimating market volatility.
2.4 Impatience
Markets do not always move predictably. Impatience causes traders to enter or exit positions prematurely, deviating from their strategy. The result is frequent small losses that accumulate over time.
3. Cognitive Biases in Trading
Cognitive biases are systematic thinking errors that affect decision-making. Recognizing these biases is crucial for traders.
3.1 Confirmation Bias
Traders often seek information that confirms their existing beliefs while ignoring contrary evidence. This bias can lead to holding losing positions or entering trades without proper analysis.
3.2 Anchoring Bias
Anchoring occurs when traders fixate on specific price levels or past outcomes, influencing future decisions irrationally. For instance, a trader may refuse to sell a stock below their purchase price, even when fundamentals have deteriorated.
3.3 Loss Aversion
Humans are naturally more sensitive to losses than gains. In trading, loss aversion may prevent traders from cutting losses early, hoping the market will turn, which often worsens financial outcomes.
3.4 Recency Bias
Traders give undue weight to recent events, assuming trends will continue indefinitely. This bias can cause chasing performance or overreacting to short-term market moves.
4. The Importance of Discipline in Trading
Discipline is the bridge between strategy and execution. A disciplined trader follows a clear set of rules and adheres to risk management, regardless of emotional fluctuations.
4.1 Developing a Trading Plan
A trading plan is a blueprint that defines:
Entry and exit criteria
Risk-reward ratio
Position sizing
Trade management rules
Example: A trader may decide to risk only 2% of their account on a single trade and exit if losses reach that limit. Following this plan consistently prevents emotional decisions and catastrophic losses.
4.2 Sticking to Risk Management
Risk management is the cornerstone of psychological stability. Setting stop-losses, diversifying trades, and controlling leverage ensures that no single loss can devastate your account or trigger panic.
5. Emotional Control Techniques
Successful traders develop mental strategies to control emotions and maintain focus.
5.1 Mindfulness and Meditation
Mindfulness techniques improve awareness of thoughts and feelings, helping traders remain calm during volatility. Meditation has been shown to reduce stress and improve decision-making under pressure.
5.2 Journaling
Maintaining a trading journal helps identify recurring emotional patterns and mistakes. By recording each trade, the rationale behind decisions, and emotional states, traders can objectively review performance and refine their strategies.
5.3 Routine and Preparation
A structured daily routine reduces emotional fatigue. Preparation includes reviewing charts, setting alerts, and defining trading goals before market hours.
5.4 Breathing and Relaxation Techniques
Simple breathing exercises can reduce stress during high-pressure trading moments, preventing impulsive decisions.
6. Building a Resilient Trading Mindset
6.1 Accepting Losses as Part of Trading
Losses are inevitable in trading. Accepting them as a natural part of the process prevents emotional spirals and promotes learning from mistakes.
6.2 Focusing on Probabilities, Not Certainties
Markets are probabilistic. Traders must view each trade as a calculated bet, not a guaranteed outcome. Focusing on risk-reward ratios and statistical probabilities reduces emotional overreactions to individual trades.
6.3 Continuous Learning and Adaptation
Markets evolve, and so should traders. A resilient mindset embraces learning from both successes and failures, adapting strategies to changing market conditions.
7. Psychological Traits of Successful Traders
Through observation and research, several psychological traits consistently appear in successful traders:
Patience: Waiting for the right setup rather than forcing trades.
Discipline: Adhering to plans and strategies without deviation.
Emotional stability: Remaining calm under pressure.
Self-awareness: Recognizing personal biases and tendencies.
Confidence without arrogance: Trusting analysis without reckless behavior.
Adaptability: Adjusting strategies as markets evolve.
8. Avoiding Psychological Pitfalls
8.1 Overtrading
Overtrading is driven by boredom, greed, or the desire to recover losses. It usually results in higher transaction costs and emotional exhaustion. Limiting the number of trades and focusing on quality setups can mitigate this.
8.2 Revenge Trading
After a loss, some traders attempt to “win back” money through aggressive trades. This emotional reaction often leads to larger losses. Accepting losses calmly and returning to a plan is key.
8.3 Chasing the Market
Jumping into trades based on hype or short-term trends often results in poor entries and exits. Patience and adherence to trading plans prevent this behavior.
9. Developing Mental Strength Through Simulation and Practice
Simulation trading or “paper trading” allows traders to practice strategies without financial risk. This helps build psychological resilience, test reactions to losses, and develop disciplined trading habits. Reviewing simulated trades offers insights into emotional patterns and decision-making flaws.
10. Integrating Psychology Into Strategy
Successful trading requires the integration of psychological awareness into technical and fundamental strategies. Some approaches include:
Pre-trade checklist: A psychological and analytical checklist ensures readiness for trades.
Post-trade reflection: Assessing decisions objectively to identify emotional interference.
Routine review sessions: Weekly or monthly analysis of trades to refine strategy and mindset.
11. Real-World Examples of Psychological Trading
George Soros: Known for his high-risk trades, Soros emphasizes the importance of understanding one’s own psychology and the market’s reflexive behavior. His success stemmed from disciplined risk management and emotional control, even in volatile markets.
Jesse Livermore: Despite enormous successes, Livermore’s career was marked by the dangers of emotional trading, including overconfidence and revenge trading. His life highlights the balance between psychological mastery and the destructive power of unchecked emotions.
Retail Traders: Many retail traders fail due to emotional decision-making, overtrading, and lack of risk discipline. Psychological resilience differentiates consistent winners from occasional profitable traders.
12. Conclusion
Trading is as much a psychological pursuit as it is a technical or analytical one. Emotional regulation, cognitive control, discipline, and resilience are crucial for consistent success. Understanding one’s own mind, recognizing biases, and developing a disciplined, patient approach transforms trading from a high-stress gamble into a strategic, probabilistic endeavor.
Mastering the psychology of trading is an ongoing journey. It requires self-awareness, continuous learning, and practice. By integrating psychological insights into trading strategies, traders can navigate market volatility with confidence, make rational decisions, and achieve long-term profitability.
In short, the mind is the ultimate trading tool. Sharpen it, discipline it, and respect it, and the markets become not just a place of opportunity, but a mirror reflecting your mastery over fear, greed, and uncertainty.
Introduction to the Digital Revolution1. Understanding the Digital Revolution
The term Digital Revolution refers to the sweeping transformation brought about by digital computing and communication technologies that have reshaped virtually every aspect of human life. This revolution, which began in the latter half of the 20th century, has fundamentally altered how we communicate, work, entertain ourselves, and even think. Unlike previous industrial revolutions that were rooted in mechanical innovations—such as the steam engine in the First Industrial Revolution or electricity and mass production in the Second—this revolution is defined by the digitization of information and the rise of computational technologies.
At its core, the Digital Revolution marks the transition from analog and mechanical systems to digital systems. It involves the widespread use of computers, software, internet technologies, and mobile devices that facilitate the storage, processing, and transmission of information in digital formats. This shift has made information more accessible, reliable, and portable, enabling unprecedented levels of connectivity and efficiency.
2. Historical Background of the Digital Revolution
The Digital Revolution did not happen overnight; it evolved through a series of key technological milestones:
The Birth of Computers (1940s–1950s): The invention of early digital computers like ENIAC and UNIVAC marked the beginning of automated data processing. These machines, though bulky and limited in functionality, laid the foundation for computational advancements.
The Microprocessor Era (1970s): The development of microprocessors revolutionized computing by making computers smaller, faster, and more affordable. Companies like Intel and IBM played a pivotal role, creating machines that could be used not just by governments and corporations, but eventually by individuals.
The Personal Computer Revolution (1980s): The introduction of personal computers (PCs) by companies like Apple and IBM brought computing into homes and offices worldwide. This democratization of technology allowed people to interact with digital systems directly.
The Internet and World Wide Web (1990s): The commercialization of the internet and the creation of the World Wide Web transformed global communication, commerce, and information sharing. This era introduced email, online banking, e-commerce, and search engines, all of which became integral to modern life.
The Mobile and Wireless Era (2000s–2010s): Smartphones and mobile networks made digital connectivity ubiquitous. Devices like the iPhone, launched in 2007, shifted the paradigm by providing portable computing power and internet access anywhere.
The Era of Artificial Intelligence and Big Data (2010s–Present): The rise of AI, machine learning, and big data analytics has pushed the Digital Revolution into a phase where automation, predictive technologies, and intelligent systems shape industries and society at large.
3. Key Components of the Digital Revolution
Several technological pillars define the Digital Revolution:
Computing Technologies: Central processing units (CPUs), graphics processing units (GPUs), and quantum computing developments form the backbone of the revolution. Faster and more efficient computing powers the data-driven world.
The Internet and Connectivity: The internet is the nervous system of the digital age, enabling real-time global communication and collaboration. Wireless technologies, including 4G and 5G networks, further amplify accessibility.
Software and Applications: From productivity tools like Microsoft Office to sophisticated AI-driven software, software systems facilitate automation, problem-solving, and enhanced productivity.
Digital Storage and Cloud Computing: Innovations in data storage, ranging from solid-state drives (SSDs) to cloud-based storage solutions, ensure vast amounts of information can be securely stored and accessed anywhere.
Mobile and Wearable Devices: Smartphones, tablets, and wearables have made digital interaction a constant part of daily life, transforming communication, health monitoring, and entertainment.
Artificial Intelligence and Machine Learning: AI algorithms analyze massive datasets to generate insights, automate decision-making, and improve efficiencies in areas such as healthcare, finance, and transportation.
Emerging Technologies: Blockchain, augmented reality (AR), virtual reality (VR), and the Internet of Things (IoT) continue to push the boundaries of digital integration, creating new opportunities for innovation.
4. Societal Impact of the Digital Revolution
The Digital Revolution has profoundly influenced human society, altering how we live, work, and interact.
Communication and Connectivity
Digital technologies have made communication instantaneous, breaking geographical barriers. Social media platforms, messaging apps, and video conferencing tools have transformed personal relationships, professional collaboration, and information dissemination. The rise of platforms like Facebook, Twitter, and TikTok demonstrates how digital media reshapes culture, politics, and public discourse.
Education and Learning
Digital tools have revolutionized education by providing access to vast online resources, virtual classrooms, and personalized learning experiences. Platforms like Coursera, Khan Academy, and Duolingo exemplify how technology democratizes education, enabling lifelong learning.
Employment and Workforce Transformation
Automation, AI, and digital tools have shifted the nature of work. Routine manual jobs are increasingly automated, while demand grows for digital literacy, coding skills, and creative problem-solving. Remote work, facilitated by platforms like Zoom and Microsoft Teams, has redefined workplace structures and work-life balance.
Entertainment and Media
Streaming services like Netflix, YouTube, and Spotify exemplify how digital technologies have transformed entertainment, providing personalized, on-demand content. Gaming, augmented reality, and virtual reality experiences have created immersive digital worlds that redefine leisure and social interaction.
Governance and Civic Engagement
Digital platforms facilitate citizen engagement, e-governance, and transparency in government operations. From online voting systems to real-time public service tracking, digital technologies are enhancing civic participation and accountability.
5. Economic Implications of the Digital Revolution
The economic impact of the Digital Revolution is profound, influencing global markets, industries, and business models.
Emergence of the Digital Economy
The rise of digital platforms has created entirely new industries and revenue streams. E-commerce giants like Amazon and Alibaba, digital payment systems like PayPal and UPI, and sharing economy platforms like Uber and Airbnb exemplify the transformative economic impact.
Productivity and Efficiency
Automation, data analytics, and digital supply chain management have significantly increased productivity across sectors. Businesses can leverage real-time insights, optimize operations, and reduce costs through digital tools.
Globalization and Trade
Digital technologies have facilitated global trade by enabling real-time communication, online marketplaces, and digital logistics systems. Small and medium enterprises (SMEs) can now access international markets without extensive physical infrastructure.
Disruption of Traditional Industries
Traditional industries, such as retail, banking, and media, face disruption as digital alternatives gain prominence. Companies that fail to adapt risk obsolescence, while agile digital-first organizations capture market share.
6. Challenges and Risks of the Digital Revolution
Despite its benefits, the Digital Revolution presents several challenges:
Privacy and Data Security
The collection and storage of massive amounts of personal data raise privacy concerns. Cybersecurity threats, data breaches, and identity theft are persistent risks in a digitally connected world.
Digital Divide
Access to digital technologies remains uneven across regions and socioeconomic groups. The digital divide exacerbates inequalities, limiting opportunities for marginalized communities.
Ethical Concerns
AI-driven decision-making, surveillance technologies, and automated systems raise ethical questions about accountability, bias, and fairness. Societies must navigate the balance between innovation and ethical responsibility.
Environmental Impact
The digital infrastructure, including data centers and electronic devices, contributes to energy consumption and e-waste. Sustainable practices are essential to mitigate environmental consequences.
7. The Future of the Digital Revolution
The Digital Revolution continues to evolve, with emerging trends shaping the future:
Artificial Intelligence and Automation: AI systems will increasingly augment human capabilities, transforming industries from healthcare to finance. Ethical frameworks will be critical to guide responsible AI adoption.
Quantum Computing: This technology promises to revolutionize computational power, solving problems beyond the capacity of classical computers, from cryptography to climate modeling.
Metaverse and Immersive Technologies: Virtual and augmented reality are creating immersive digital environments for work, play, and social interaction, redefining the concept of presence.
Blockchain and Decentralization: Blockchain technology may transform finance, supply chains, and digital identity systems, promoting transparency and trust.
Sustainability and Green Technologies: Digital innovations will increasingly focus on sustainability, including energy-efficient computing, smart grids, and circular economies.
8. Conclusion
The Digital Revolution represents a fundamental transformation in human civilization, redefining how societies communicate, work, and thrive. Its impact spans every domain—economic, social, technological, and cultural. While it presents challenges such as privacy concerns, ethical dilemmas, and environmental implications, it also offers unprecedented opportunities for innovation, connectivity, and human advancement.
Embracing this revolution requires a balance between technological adoption and responsible governance. Societies must invest in education, digital literacy, and infrastructure to ensure inclusive participation. Businesses must innovate while safeguarding ethical standards, and individuals must adapt to lifelong learning in a rapidly changing digital landscape.
In essence, the Digital Revolution is more than a technological shift; it is a societal metamorphosis, redefining the very fabric of human interaction, economic activity, and global collaboration. Understanding and harnessing this revolution is not merely an option—it is an imperative for navigating the 21st century successfully.
Divergenc Secrets1. Option Styles
American Options – Can be exercised at any time before expiration.
European Options – Can only be exercised on the expiration date.
Exotic Options – Customized contracts with complex features (used by institutions).
Most stock options in the U.S. are American-style, while index options are often European-style. In India, stock and index options are European-style.
2. Why Trade Options?
Options trading is popular because it offers:
Leverage – Control large stock positions with small capital.
Hedging – Protect portfolios against market declines.
Income Generation – By selling (writing) options and collecting premiums.
Speculation – Betting on price movements without owning the stock.
Flexibility – Strategies can be bullish, bearish, neutral, or even profit from volatility.
3. Risks in Option Trading
While options provide benefits, they also come with risks:
Limited life span – Options expire; if your prediction is wrong, you lose the premium.
Leverage risk – Small movements can cause large percentage losses.
Complexity – Strategies can be difficult for beginners.
Unlimited losses – Selling (writing) naked options can lead to unlimited loss potential.
4. Basic Option Strategies
a) Buying Calls
Suitable when expecting strong upward movement.
Limited risk (premium), unlimited reward.
b) Buying Puts
Suitable when expecting strong downward movement.
Limited risk, high reward potential.
c) Covered Call
Own the stock and sell a call option against it.
Generates income but caps upside potential.
d) Protective Put
Own the stock and buy a put as insurance.
Protects against downside risk.
e) Straddle
Buy both a call and put at the same strike and expiration.
Profits from large movements in either direction.
f) Strangle
Similar to straddle but with different strike prices.
Cheaper but requires bigger move.
g) Iron Condor
Sell one call and one put (out of the money) and buy further out-of-the-money options for protection.
Profits from low volatility.

Part 2 Support and Resistance1. Who Participates in Option Markets?
There are two main participants in options trading:
Option Buyers:
Pay premium upfront.
Limited risk, unlimited profit potential (in calls).
They speculate on price movement.
Option Sellers (Writers):
Receive premium from buyers.
Limited profit (only premium collected), but potentially large risk.
Often institutions or experienced traders who use hedging.
2. Why Trade Options?
Options are not just for gambling on price. They are multipurpose:
Leverage: You control more value with less money. A small premium can give exposure to big stock moves.
Hedging: Protect your stock portfolio from market crashes.
Flexibility: You can profit whether the market goes up, down, or even stays flat.
Income: Selling options regularly earns premiums, like rental income.
3. Option Pricing (The Premium)
The premium of an option has two parts:
Intrinsic Value: The real value if exercised today.
Example: Stock price ₹1,500, Call strike ₹1,450 → Intrinsic value = ₹50.
Time Value: Extra amount based on time left until expiration and market volatility.
The longer the time, the higher the premium.
Higher volatility also increases premium because big moves are more likely.
So, Option Price = Intrinsic Value + Time Value.
4. Types of Option Trading Strategies
Options are flexible because you can combine calls, puts, buying, and selling to create different strategies. Here are some important ones:
A. Basic Strategies
Buying Calls – Bullish view. Cheap way to bet on rising prices.
Buying Puts – Bearish view. Cheap way to bet on falling prices.
Covered Call – Hold stock + sell call to earn extra income.
Protective Put – Hold stock + buy put to protect against fall.
B. Intermediate Strategies
Straddle – Buy one call and one put at the same strike. Profits from big moves in either direction.
Strangle – Similar to straddle, but with different strikes. Cheaper but needs bigger move.
Spread Strategies – Combining buying and selling options of different strikes to limit risk.
Bull Call Spread
Bear Put Spread
Iron Condor
C. Advanced Strategies
Butterfly Spread – Limited risk and reward, used when expecting no big movement.
Calendar Spread – Exploits time decay by selling short-term and buying long-term options.

Intraday Trading vs Swing Trading1. Introduction
The stock market is a dynamic ecosystem, attracting participants ranging from long-term investors to high-frequency traders. Among traders, Intraday and Swing Trading are common approaches, each with its unique characteristics:
Intraday Trading involves buying and selling financial instruments within the same trading day. Positions are not held overnight.
Swing Trading focuses on capturing short- to medium-term price movements, usually over several days to weeks.
Understanding the differences between these two methods is crucial because the strategies, risks, and potential rewards vary significantly. While one can offer quick profits, the other may provide more strategic opportunities with less stress.
2. Core Definitions
2.1 Intraday Trading
Intraday trading, also known as day trading, is the practice of executing multiple trades in a single day. The main objective is to profit from short-term price movements. Key features include:
Timeframe: Trades are opened and closed within the same day.
Frequency: High, often multiple trades per day.
Capital Utilization: Requires margin trading for higher leverage.
Risk Level: High, due to volatility and leverage.
Example: Buying 100 shares of a stock in the morning and selling them at a profit before the market closes.
2.2 Swing Trading
Swing trading is a style where traders aim to capture price swings over a short- to medium-term period. These swings can last from a few days to several weeks. Key features include:
Timeframe: Positions held from days to weeks.
Frequency: Lower than intraday trading, usually a few trades per week or month.
Capital Utilization: Less leverage is required; often uses actual capital.
Risk Level: Moderate, as overnight risks are present but smaller leverage reduces extreme losses.
Example: Buying a stock anticipating a 10% upward move over a week and selling it once the target is achieved.
3. Time Horizon and Trading Frequency
3.1 Time Horizon
Intraday Trading: Trades last minutes to hours. Traders focus on intra-day price movements and volatility.
Swing Trading: Trades last days to weeks. Traders focus on medium-term trends and market sentiment.
3.2 Trading Frequency
Intraday: Requires constant monitoring. Traders often execute 5–20 trades per day, depending on the strategy.
Swing: Requires less frequent monitoring. A trader might execute 2–5 trades per week or month, depending on market conditions.
Implication:
Time horizon affects risk exposure. Intraday traders avoid overnight risk but face rapid intraday volatility. Swing traders face overnight or weekend risk but can capitalize on larger moves.
4. Risk and Reward Profile
4.1 Intraday Trading Risk
High leverage amplifies both profits and losses.
Rapid price swings can lead to margin calls.
Emotional stress is significant due to fast decision-making.
Stop-losses are critical for risk management.
4.2 Swing Trading Risk
Exposure to overnight market gaps can cause unexpected losses.
Moderate leverage reduces extreme risk.
Slower pace allows for analytical decision-making.
4.3 Reward Potential
Intraday: Quick profits, but often smaller per trade. Requires high win rate.
Swing: Potentially larger profits per trade due to capturing entire price swings.
5. Capital and Leverage Requirements
5.1 Intraday Trading
Often uses leverage (margin trading) to maximize returns on small price movements.
Requires a significant understanding of risk management.
Minimum capital depends on exchange regulations; in India, traders can use 4–5x leverage in equities.
5.2 Swing Trading
Typically uses actual capital rather than heavy leverage.
Focuses on trend analysis and larger price movements.
Lower risk of forced liquidation compared to intraday trading.
6. Analytical Approach
6.1 Intraday Trading Analysis
Technical Analysis: Dominates decision-making, including:
Candlestick patterns
Moving averages
Momentum indicators (RSI, MACD)
Volume analysis
Market Sentiment: News and events can trigger short-term volatility.
Price Action: Key for identifying entry and exit points within the day.
6.2 Swing Trading Analysis
Technical Analysis: Similar tools but applied over daily or weekly charts.
Fundamental Analysis: May include earnings reports, economic data, or sectoral trends.
Trend Analysis: Swing traders identify upward or downward trends and ride the market momentum.
7. Strategies Used
7.1 Intraday Strategies
Scalping: Captures small price movements multiple times a day.
Momentum Trading: Follows strong trends driven by news or technical patterns.
Breakout Trading: Trades executed when price breaks key support/resistance levels.
Reversal Trading: Bets on short-term reversals at key levels.
7.2 Swing Trading Strategies
Trend Following: Enter trades in the direction of established trends.
Pullback/ Retracement Trading: Buy dips in an uptrend or sell rallies in a downtrend.
Breakout Trading: Focus on longer-term breakouts over days or weeks.
Fundamental Swing Trading: Use earnings, economic data, or corporate news to predict swings.
8. Tools and Technology
8.1 Intraday Tools
Real-time charts and data feeds.
Advanced order types like bracket orders, stop-loss, and take-profit.
Trading platforms with low latency execution.
News scanners and alerts for rapid decision-making.
8.2 Swing Trading Tools
Daily or weekly charts.
Technical indicators suitable for medium-term trends.
Fundamental analysis tools like financial reports, earnings calendars.
Trading journals for recording trades over days or weeks.
9. Psychological Considerations
9.1 Intraday Trading Psychology
High stress due to rapid decision-making.
Emotional discipline is critical; fear and greed can destroy profits.
Traders must avoid overtrading.
Instant gratification can be both a motivator and a trap.
9.2 Swing Trading Psychology
Patience is critical; trades take days or weeks.
Less stress than intraday trading but requires confidence in analysis.
Traders can better analyze positions and avoid impulsive trades.
Sleep-friendly approach as monitoring is less frequent.
10. Pros and Cons
10.1 Intraday Trading Pros
Quick profit potential.
No overnight risk.
High learning curve sharpens trading skills.
Can operate with smaller capital using leverage.
10.2 Intraday Trading Cons
High stress and emotional burden.
Requires constant market monitoring.
Small profits per trade need high consistency.
High transaction costs (brokerage, taxes) due to frequent trades.
10.3 Swing Trading Pros
Captures larger market moves.
Less stress compared to intraday trading.
Lower transaction costs.
Allows integration of both technical and fundamental analysis.
10.4 Swing Trading Cons
Exposure to overnight and weekend risks.
Slower profit realization.
Requires patience and discipline.
Market reversals can result in losses if trends fail.
Conclusion
Both intraday trading and swing trading are legitimate trading methods with unique advantages and challenges. Intraday trading offers rapid profits but demands constant attention, emotional control, and technical expertise. Swing trading offers more strategic opportunities with lower stress but exposes traders to overnight market risks.
The decision to pursue either depends on your risk tolerance, capital, personality, and time availability. Mastery of technical and fundamental analysis, risk management, and trading psychology is critical for success in either approach. By understanding these differences and aligning them with your personal trading style, you can develop a disciplined, profitable trading strategy.
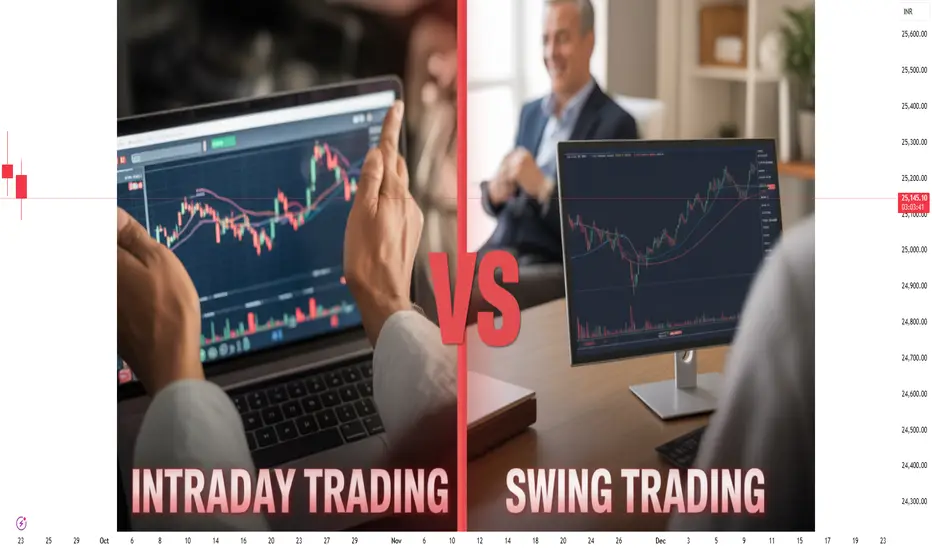
Best Candlestick Patterns for Traders1. Doji Candle
Definition
A Doji candle is formed when the open and close prices are virtually equal, creating a candle with a small or non-existent body and long shadows. The Doji signifies indecision in the market. Neither buyers nor sellers have control, indicating a potential reversal or a continuation depending on context.
Types of Doji Candles
Standard Doji: Equal open and close prices with long upper and lower wicks.
Dragonfly Doji: Small body at the top, long lower shadow. Indicates bullish reversal if found at the bottom of a downtrend.
Gravestone Doji: Small body at the bottom, long upper shadow. Indicates bearish reversal if found at the top of an uptrend.
Long-Legged Doji: Long upper and lower wicks with a tiny body. Shows extreme indecision.
Trading Implications
Appears after strong trends to indicate potential reversals.
Confirmation is critical; traders often wait for the next candle to determine the market’s direction.
Risk management is essential because Doji candles alone do not guarantee a reversal.
Example
Imagine a strong bullish trend; suddenly, a Gravestone Doji appears. This could indicate that buyers are losing control, and a bearish reversal might follow. Traders might consider exiting long positions or preparing for a short opportunity.
2. Engulfing Pattern
Definition
The Engulfing Pattern consists of two candles:
Bullish Engulfing: A small bearish candle followed by a larger bullish candle that completely engulfs the previous candle’s body.
Bearish Engulfing: A small bullish candle followed by a larger bearish candle that engulfs the previous candle.
This pattern signifies a strong shift in market sentiment.
Characteristics
Bullish Engulfing:
Occurs at the bottom of a downtrend.
Indicates buyers taking control.
Bearish Engulfing:
Occurs at the top of an uptrend.
Indicates sellers taking control.
Trading Strategy
Look for significant volume during the engulfing candle for confirmation.
Place stop-loss below the swing low for bullish or above swing high for bearish setups.
Often paired with support and resistance levels for higher accuracy.
Example
During a downtrend, a small red candle is followed by a large green candle engulfing it. This signals that bulls are overpowering bears and a potential trend reversal is imminent.
3. Hammer and Hanging Man
Definition
These patterns have small bodies and long lower shadows. They often signal potential reversals but depend on their placement in the trend:
Hammer: Bullish reversal at the bottom of a downtrend.
Hanging Man: Bearish reversal at the top of an uptrend.
Characteristics
Body is small.
Lower shadow is at least twice the size of the body.
Upper shadow is minimal or absent.
Trading Insights
Hammer:
Appears after a downtrend.
Buyers start to gain momentum.
Confirmation comes from the next bullish candle.
Hanging Man:
Appears after an uptrend.
Sellers might be gaining control.
Confirmation comes from a bearish candle following it.
Example
In an uptrend, a Hanging Man appears. The next candle is red, confirming that sellers are exerting pressure. Traders may look to short or exit long positions.
4. Morning Star and Evening Star
Definition
These are three-candle patterns that indicate trend reversals:
Morning Star: Bullish reversal at the bottom of a downtrend.
Evening Star: Bearish reversal at the top of an uptrend.
Components
Morning Star:
First candle: Large bearish candle.
Second candle: Small-bodied candle (Doji or spinning top) indicating indecision.
Third candle: Large bullish candle closing at least halfway into the first candle’s body.
Evening Star:
First candle: Large bullish candle.
Second candle: Small-bodied candle showing indecision.
Third candle: Large bearish candle closing at least halfway into the first candle’s body.
Trading Approach
Confirm the pattern with volume.
Look for support/resistance levels aligning with the pattern.
Set stop-loss just below the lowest point (Morning Star) or above the highest point (Evening Star).
Example
In a downtrend, a Morning Star appears. The first candle is red, the second a small Doji, and the third a large green candle. This indicates a potential bullish reversal, signaling a long trade setup.
5. Shooting Star and Inverted Hammer
Definition
These patterns are opposite of Hammer and Hanging Man and indicate potential reversals based on trend location:
Shooting Star: Bearish reversal at the top of an uptrend.
Inverted Hammer: Bullish reversal at the bottom of a downtrend.
Characteristics
Small body.
Long upper shadow, at least twice the length of the body.
Minimal or no lower shadow.
Trading Implications
Shooting Star:
Appears after an uptrend.
Suggests bulls are losing control.
Confirmation comes from the next bearish candle.
Inverted Hammer:
Appears after a downtrend.
Suggests buyers are gaining momentum.
Confirmation comes from the next bullish candle.
Example
An uptrend sees a Shooting Star appear. The next candle is red, confirming sellers’ dominance, signaling potential short opportunities.
Conclusion
Candlestick patterns are invaluable tools in technical analysis, helping traders anticipate potential reversals, continuations, and market sentiment shifts. Among the myriad of patterns, the Doji, Engulfing, Hammer/Hanging Man, Morning/Evening Star, and Shooting Star/Inverted Hammer are considered the top 5 due to their reliability and simplicity.
Key Takeaways:
Always use candlestick patterns in context with trend and volume.
Confirmation is crucial; no single pattern guarantees a reversal.
Combine candlestick analysis with other technical tools like support/resistance, moving averages, and RSI for higher probability trades.
Risk management, stop-losses, and position sizing are essential for trading success.
By mastering these top 5 candlestick patterns, traders can gain a powerful edge in analyzing market behavior and making informed decisions.
Risk Management in Momentum Trading1. Understanding Risk in Momentum Trading
Momentum trading relies on riding price trends, which can be unpredictable and volatile. Unlike value investing, where positions are often held long-term, momentum traders operate in shorter timeframes, making them more susceptible to sudden reversals.
1.1 Types of Risks
Market Risk: The possibility of losses due to market movements against your position. Example: A stock you bought on a bullish breakout suddenly falls due to unexpected news.
Volatility Risk: Momentum trading thrives on volatility, but extreme volatility can produce rapid reversals.
Liquidity Risk: Thinly traded stocks or assets can make it difficult to enter or exit positions without significant slippage.
News Risk: Earnings, macroeconomic data, or geopolitical events can abruptly reverse momentum.
Behavioral Risk: Emotional reactions like FOMO (fear of missing out) or panic selling can lead to poor decision-making.
2. Risk-Reward Assessment
Every momentum trade should have a clearly defined risk-reward ratio, usually at least 1:2 or higher.
Example: If you risk $100 per trade, aim for a target profit of $200 or more.
Using a favorable risk-reward ratio ensures that even if only half your trades succeed, the strategy remains profitable over time.
Momentum traders often rely on technical levels, like support/resistance, Fibonacci retracements, or trendlines, to determine profit targets.
3. Volatility Management
Momentum trading thrives on volatility, but too much volatility increases risk. Managing it requires:
3.1 Volatility Indicators
Average True Range (ATR): Measures daily price movement to adjust stop-loss and position size.
Bollinger Bands: Identify periods of high volatility where momentum can reverse.
VIX Index (for stocks): Indicates overall market fear and potential risk spikes.
3.2 Volatility-Based Position Sizing
In highly volatile markets, reduce position size to avoid large losses.
Conversely, in low-volatility environments, slightly larger positions may be acceptable because price swings are smaller.
4. Trade Planning and Discipline
Risk management in momentum trading is not just about numbers; it’s also about planning and discipline.
4.1 Pre-Trade Analysis
Identify entry points, stop-loss, and profit targets before entering a trade.
Evaluate market context, sector performance, and relative strength of the asset.
Determine acceptable loss for the trade relative to account size.
4.2 Journaling
Maintain a trading journal with entry, exit, stop-loss, profit, loss, and notes on market conditions.
Helps identify patterns, mistakes, and improve risk management decisions over time.
4.3 Avoiding Overtrading
Momentum can create excitement, but overtrading increases exposure to market risk.
Focus only on high-probability setups that meet predefined criteria.
5. Psychological Risk Management
Momentum trading requires a strong mental framework. Emotional mismanagement can lead to catastrophic losses.
5.1 Controlling Greed
Traders often hold positions too long, hoping for extra profit, risking reversal.
Discipline with profit targets and trailing stops prevents giving back gains.
5.2 Managing Fear
Fear can lead to exiting positions prematurely or hesitation to enter valid trades.
Confidence in pre-planned setups and risk rules is critical.
5.3 Avoiding FOMO
Momentum traders may feel compelled to enter trades late in a trend.
FOMO often leads to poor entry prices and inadequate stop-loss levels.
6. Hedging and Portfolio Risk
Advanced momentum traders often use hedging to manage portfolio-level risk:
Options Hedging: Using puts to protect long momentum positions in stocks.
Diversification Across Assets: Trading momentum in different markets (stocks, forex, commodities) reduces correlation risk.
Inverse ETFs or Short Positions: Can hedge downside risk during market reversals.
7. Market-Specific Risk Management
7.1 Stocks
Use stop-loss orders based on technical support/resistance levels.
Avoid thinly traded small-cap stocks to reduce liquidity risk.
Monitor market-wide news to avoid broad reversals.
7.2 Forex
Account for macroeconomic news and central bank announcements.
Use smaller position sizes during low-liquidity periods.
Consider volatility spreads and slippage in currency pairs.
7.3 Cryptocurrencies
Use tight stop-losses and smaller positions due to extreme volatility.
Avoid low-liquidity altcoins to reduce exposure to pump-and-dump schemes.
Monitor social media and news sentiment for sudden momentum shifts.
7.4 Commodities
Use futures contracts with proper margin management to avoid over-leverage.
Be aware of seasonal and geopolitical factors affecting supply-demand dynamics.
Combine trend-following indicators with volume analysis for better risk control.
8. Combining Technical Analysis with Risk Management
Technical analysis is the backbone of momentum trading. Effective risk management involves integrating technical signals with disciplined capital control:
Entry Confirmation: Only enter trades when multiple momentum indicators align.
Stop-Loss Placement: Set stops just beyond support/resistance or volatility bands.
Profit Targeting: Use Fibonacci extensions, previous highs/lows, or trendlines to lock in gains.
Exit Signals: Monitor trend weakening indicators like divergence in MACD or RSI for early exits.
9. Case Study Example
Scenario: Trading momentum in a trending stock.
Entry: Stock breaks resistance at ₹200 with high volume.
Stop-Loss: Placed at ₹195, based on ATR and recent consolidation.
Position Size: Account risk 2%, capital ₹50,000 → risk ₹1,000 → 200 shares.
Target: Risk-reward ratio 1:3 → target profit = ₹3000 → exit at ₹215.
Outcome: If stock surges to ₹215, gain ₹3,000. If reverses to ₹195, loss limited to ₹1,000.
This demonstrates capital protection, risk-reward adherence, and discipline in momentum trading.
10. Advanced Risk Management Techniques
Volatility Scaling: Adjust position sizes dynamically based on current market volatility.
Algorithmic Risk Controls: Use automated stop-losses, trailing stops, and risk alerts in high-frequency momentum trading.
Correlation Analysis: Avoid taking multiple momentum trades in highly correlated assets to reduce portfolio risk.
Stress Testing: Simulate market shocks to test the resilience of momentum strategies.
Summary
Momentum trading can generate substantial profits, but it comes with high risks. Effective risk management in momentum trading requires:
Capital allocation and position sizing to limit losses.
Stop-loss placement tailored to market volatility.
Risk-reward assessment for every trade.
Volatility management to adapt to changing market conditions.
Discipline and psychological control to prevent emotional decisions.
Market-specific adjustments for stocks, forex, cryptocurrencies, and commodities.
Advanced techniques like hedging, correlation analysis, and stress testing.
By combining these principles, momentum traders can maximize profits while minimizing potential losses, creating a sustainable trading strategy in volatile and unpredictable markets.
Part 2 Master Candlestick Pattern1. Liquidity Risk – When You Can’t Exit
Some options, especially far out-of-the-money strikes or illiquid stocks, don’t have enough buyers and sellers. This creates wide bid-ask spreads.
You may be forced to buy at a higher price and sell at a lower price.
In extreme cases, you might not find a counterparty to exit at all.
👉 Example:
Suppose you buy an illiquid stock option at ₹10. The bid is ₹8, and the ask is ₹12. If you want to sell, you may only get ₹8 — losing 20% instantly.
Lesson: Stick to liquid contracts with high open interest and trading volume.
2. Assignment Risk – The Surprise Factor
If you sell (write) options, you carry assignment risk. That means the buyer can exercise the option at any time (in American-style options).
A short call may be assigned if the stock rises sharply.
A short put may be assigned if the stock falls heavily.
👉 Example:
If you sell a put option of Infosys at ₹1,500 strike, and the stock crashes to ₹1,400, you may be forced to buy shares at ₹1,500 — incurring a huge loss.
Lesson: Always be prepared for early exercise if you are a seller.
3. Gap Risk – Overnight Shocks
Markets don’t always move smoothly. They can gap up or down overnight due to global events, earnings, or news. This is gap risk.
If you are holding positions overnight, you cannot control what happens after market close.
Protective stop-losses don’t work in gap openings because the market opens directly at a higher or lower level.
👉 Example:
You sell a call option on a stock at ₹500 strike. Overnight, the company announces stellar results, and the stock opens at ₹550. Your stop-loss at ₹510 is useless — you are already deep in loss.
Lesson: Overnight positions carry additional dangers.
4. Interest Rate and Dividend Risk
Option pricing models also factor in interest rates and dividends.
Rising interest rates generally increase call premiums and reduce put premiums.
Dividends reduce call prices and increase put prices because the stock is expected to fall on ex-dividend date.
For index options or long-dated stock options, ignoring this can lead to mispricing.
5. Psychological Risk – The Human Weakness
Not all risks come from markets. Many come from the trader’s own mind.
Greed: Holding on for bigger profits and losing it all.
Fear: Exiting too early or avoiding trades.
Overtrading: Trying to chase every move.
Revenge trading: Doubling down after a loss.
👉 Example:
A trader makes a profit of ₹20,000 in a day but refuses to book gains, hoping for ₹50,000. By market close, the profit vanishes and turns into a ₹10,000 loss.
Lesson: Emotional discipline is as important as technical knowledge.
6. Systemic & Black Swan Risks
Finally, there are risks no model can predict — sudden wars, pandemics, financial crises, regulatory bans, or exchange outages. These are systemic or Black Swan risks.
👉 Example:
In March 2020 (Covid crash), markets fell 30% in weeks. Option premiums shot up wildly, and many traders were wiped out.
Lesson: Always respect uncertainty. No system is foolproof.

PCR Trading Strategies1. Strategic Approaches to Options Trading
Options strategies can be simple or complex, depending on the trader’s risk tolerance, market outlook, and capital. These strategies are categorized into basic, intermediate, and advanced levels.
1.1. Basic Strategies
Buying Calls and Puts: Simple directional trades.
Protective Puts: Hedging against portfolio declines.
Covered Calls: Generating income from existing holdings.
1.2. Intermediate Strategies
Spreads: Simultaneous buying and selling of options to limit risk and reward.
Vertical Spread: Buying and selling options of the same type with different strike prices.
Horizontal/Calendar Spread: Exploiting differences in time decay by using options of the same strike but different expiration dates.
Diagonal Spread: Combining vertical and horizontal spreads for strategic positioning.
Collars: Combining protective puts and covered calls to limit both upside and downside.
1.3. Advanced Strategies
Iron Condor: Selling an out-of-the-money call and put while buying further OTM options to limit risk, profiting from low volatility.
Butterfly Spread: Exploiting low volatility by using three strike prices to maximize gains near the middle strike.
Ratio Spreads and Backspreads: Advanced plays to profit from skewed market expectations or strong directional moves.
2. Identifying Option Trading Opportunities
Successful options trading requires analyzing market conditions, volatility, and liquidity. Key factors include:
2.1. Market Direction and Momentum
Use technical indicators (moving averages, RSI, MACD) to gauge trends.
Trade options in alignment with market momentum for directional strategies.
2.2. Volatility Analysis
Historical Volatility (HV): Measures past price fluctuations.
Implied Volatility (IV): Market’s expectation of future volatility.
Opportunities arise when IV is underpriced (buy options) or overpriced (sell options).
2.3. Earnings and Event Plays
Companies’ earnings announcements, product launches, or macroeconomic events create volatility spikes.
Strategies like straddles or strangles are ideal to capitalize on such events.
2.4. Liquidity and Open Interest
Highly liquid options ensure tight spreads and efficient entry/exit.
Monitoring open interest helps identify support/resistance levels and market sentiment.
3. Risk Management in Options Trading
While options offer significant opportunities, risk management is crucial:
Position Sizing: Limit exposure to a small percentage of capital.
Defined-Risk Strategies: Use spreads and collars to control maximum loss.
Stop-Loss Orders: Protect against rapid adverse movements.
Diversification: Trade multiple assets or strategies to reduce concentration risk.
Implied Volatility Awareness: Avoid buying expensive options during volatility spikes unless justified by market events.

Part 1 Support and Resistance1. Introduction to Option Trading
Option trading is a sophisticated financial instrument used widely in modern markets for hedging, speculation, and portfolio management. Options are derivatives, meaning their value is derived from an underlying asset, such as stocks, indices, commodities, or currencies. Unlike buying or selling the underlying asset directly, options give traders the right—but not the obligation—to buy or sell the asset at a predetermined price within a specific timeframe.
The global options market has grown exponentially, as institutional investors, retail traders, and hedge funds recognize the flexibility, leverage, and risk-management capabilities of options. They are integral to strategies ranging from simple protective hedging to complex arbitrage trades.
1.1 What Is an Option?
An option is a contract that grants its holder certain rights:
Call Option: The right to buy the underlying asset at a specific price (strike price) before or on a specified expiry date.
Put Option: The right to sell the underlying asset at a specific price before or on a specified expiry date.
Unlike futures or forwards, which carry obligations, options give the holder flexibility, making them versatile tools for both risk mitigation and speculative opportunities.
2. Key Terminology in Option Trading
Understanding option trading requires familiarity with certain fundamental terms:
Strike Price: The predetermined price at which the underlying asset can be bought (call) or sold (put).
Premium: The price paid to buy the option. This is influenced by time value, intrinsic value, volatility, and market conditions.
Expiry Date: The date on which the option contract expires and becomes void.
In-the-Money (ITM): An option with intrinsic value (e.g., a call option with a strike price below the current market price).
Out-of-the-Money (OTM): An option with no intrinsic value (e.g., a call option with a strike price above the current market price).
At-the-Money (ATM): An option where the strike price equals the current market price.
Underlying Asset: The financial instrument (stock, index, commodity, or currency) on which the option is based.
Volatility: A measure of the asset's price fluctuations, which directly impacts option pricing.

AI in Trading & Predictive Analytics1. Introduction
The world of trading has undergone a seismic transformation over the past decade, largely due to the integration of Artificial Intelligence (AI) and predictive analytics. Traditionally, trading was dominated by human intuition, fundamental analysis, and technical indicators. While these methods remain relevant, they are increasingly augmented or even replaced by sophisticated AI models capable of processing massive datasets in real-time, identifying patterns invisible to the human eye, and executing trades at lightning speed.
AI in trading is not just a futuristic concept—it is now a practical reality that is reshaping how financial institutions, hedge funds, proprietary trading firms, and even retail traders operate. Predictive analytics, a subset of AI, leverages historical and real-time data to forecast market movements, price trends, and risk exposures, providing a competitive edge in an environment where milliseconds can equate to millions of dollars.
2. The Evolution of AI in Trading
2.1 From Manual Trading to Algorithmic Trading
Trading initially relied on human decision-making, intuition, and discretionary judgment. As markets grew more complex and volumes surged, algorithmic trading emerged, using predefined rules to execute trades based on specific criteria. However, traditional algorithms were static and unable to adapt to unexpected market conditions.
2.2 Enter Machine Learning
Machine learning (ML), a core branch of AI, allows algorithms to learn from data rather than rely solely on fixed rules. By analyzing historical price movements, volume patterns, and macroeconomic indicators, ML models can make adaptive predictions, detect anomalies, and optimize trading strategies.
2.3 Deep Learning and Neural Networks
Deep learning, particularly neural networks, has revolutionized trading analytics. These systems can model complex non-linear relationships between market variables, making them ideal for predicting market behavior in volatile conditions. For example, recurrent neural networks (RNNs) and long short-term memory networks (LSTMs) excel at time-series forecasting, which is essential for predicting stock prices, commodity trends, and currency movements.
3. Core Applications of AI in Trading
AI and predictive analytics touch virtually every aspect of modern trading. Key applications include:
3.1 Predictive Market Analytics
Predictive analytics uses historical and real-time data to anticipate price movements and trading volumes. By identifying correlations between market events and price reactions, AI models can provide probabilistic forecasts of asset performance.
Example: An AI model may analyze hundreds of economic indicators, corporate earnings reports, and social media sentiment to predict whether a stock will rise or fall in the next week.
3.2 Algorithmic and High-Frequency Trading (HFT)
AI-driven algorithms are capable of executing trades within microseconds, capitalizing on small price discrepancies across exchanges. High-frequency trading relies heavily on AI to detect market inefficiencies and execute thousands of trades automatically, often with minimal human intervention.
Example: A HFT system might use predictive models to anticipate price spikes caused by large institutional orders and profit from arbitrage opportunities before the market reacts.
3.3 Sentiment Analysis
Natural Language Processing (NLP), a branch of AI, allows traders to analyze unstructured data from news articles, social media posts, and financial reports to gauge market sentiment. Predictive models can assess whether sentiment is bullish, bearish, or neutral and adjust trading strategies accordingly.
Example: An AI system monitoring Twitter and news headlines might detect growing negative sentiment about a company before its stock price drops, allowing preemptive trades.
3.4 Risk Management
AI enhances risk management by continuously analyzing portfolio exposure and market conditions. Predictive analytics can simulate potential scenarios, measure Value at Risk (VaR), and suggest hedging strategies to mitigate losses.
Example: A predictive model might simulate the impact of an interest rate hike on a diversified portfolio, enabling traders to adjust positions proactively.
3.5 Fraud Detection and Compliance
AI systems detect unusual trading patterns that may indicate fraud, market manipulation, or regulatory non-compliance. Predictive models can flag suspicious behavior in real-time, reducing operational and legal risks.
Example: Sudden, atypical trades in a thinly traded stock could trigger an AI alert, prompting further investigation.
4. Types of AI Models Used in Trading
4.1 Supervised Learning
Supervised learning models predict outcomes based on labeled historical data. These include regression models, decision trees, and support vector machines (SVMs).
Application: Predicting daily closing prices of a stock based on past performance and macroeconomic indicators.
4.2 Unsupervised Learning
Unsupervised learning uncovers hidden patterns in unlabeled datasets, using clustering or anomaly detection techniques.
Application: Detecting unusual trading patterns that may indicate market manipulation.
4.3 Reinforcement Learning
Reinforcement learning (RL) is used to develop trading strategies that optimize cumulative rewards over time. RL agents interact with simulated markets, learning optimal actions through trial and error.
Application: An AI agent learns to buy and sell cryptocurrencies in a volatile market to maximize returns.
4.4 Deep Learning Models
Deep learning models, including convolutional neural networks (CNNs) and LSTMs, capture complex patterns in sequential data, making them ideal for predicting trends and volatility.
Application: Forecasting currency exchange rates or commodity prices using historical sequences.
5. Data Sources for AI Trading Models
Data is the fuel of AI trading systems. Key sources include:
5.1 Market Data
Historical price and volume data
Order book depth
Exchange-traded fund (ETF) flows
5.2 Fundamental Data
Earnings reports
Financial statements
Economic indicators
5.3 Alternative Data
News sentiment and social media analytics
Satellite imagery (e.g., monitoring supply chain activity)
Web traffic and consumer behavior
The integration of alternative data with traditional market and fundamental data provides AI models with a competitive edge by uncovering insights unavailable to conventional analytics.
6. Benefits of AI and Predictive Analytics in Trading
Speed and Efficiency: AI executes trades faster than humans, enabling traders to exploit micro-opportunities.
Accuracy: Predictive models reduce reliance on human intuition, often outperforming traditional forecasting methods.
Adaptability: AI models can adjust strategies in response to changing market conditions.
Risk Reduction: Continuous monitoring and scenario simulations improve risk management.
Insight Generation: AI uncovers hidden patterns and correlations across massive datasets.
7. Challenges and Limitations
Despite its transformative potential, AI trading faces several challenges:
7.1 Data Quality and Availability
Poor or incomplete data can result in inaccurate predictions. AI models require high-quality, structured, and comprehensive datasets to function effectively.
7.2 Model Overfitting
AI models may perform exceptionally well on historical data but fail to generalize to unseen market conditions.
7.3 Market Volatility
Unexpected geopolitical events, natural disasters, or regulatory changes can disrupt market behavior, rendering AI predictions less reliable.
7.4 Regulatory and Ethical Concerns
The use of AI in trading raises concerns about market fairness, transparency, and accountability. Regulators are increasingly scrutinizing AI-driven trading to prevent systemic risks.
8. Case Studies and Real-World Applications
8.1 Hedge Funds
Hedge funds like Renaissance Technologies and Two Sigma have leveraged AI and predictive analytics to achieve consistent, high-risk-adjusted returns. These funds analyze terabytes of data to uncover subtle market inefficiencies.
8.2 Retail Trading Platforms
Retail trading platforms now offer AI-powered analytics to individual investors, enabling sentiment analysis, predictive stock recommendations, and risk alerts previously accessible only to institutional traders.
8.3 Cryptocurrency Trading
AI is particularly suited to cryptocurrency markets due to high volatility and 24/7 trading. Predictive models analyze social media sentiment, blockchain transactions, and historical price trends to generate trading signals.
9. Future Trends
9.1 Explainable AI (XAI)
The future of AI in trading emphasizes transparency. Explainable AI seeks to provide human-readable reasoning behind model predictions, crucial for regulatory compliance and trader trust.
9.2 Integration with Quantum Computing
Quantum computing promises to exponentially accelerate AI computations, allowing for faster, more accurate predictions in complex markets.
9.3 Cross-Market and Multi-Asset Analytics
Future AI systems will increasingly analyze interdependencies across equities, commodities, currencies, and derivatives to identify global trading opportunities.
9.4 Personalized AI Trading Assistants
Retail investors will benefit from AI-powered assistants that provide real-time trade recommendations, risk assessments, and portfolio optimization tailored to individual investment goals.
10. Conclusion
AI and predictive analytics are no longer optional in modern trading—they are essential. By combining massive data-processing capabilities, advanced algorithms, and real-time execution, AI provides traders with unprecedented insights, speed, and adaptability. While challenges like data quality, model overfitting, and regulatory concerns persist, the benefits far outweigh the risks.
The future of trading lies in a hybrid approach: humans working alongside AI, leveraging predictive analytics for smarter, faster, and more informed trading decisions. As technology continues to evolve, AI’s role in financial markets will expand further, ushering in a new era where predictive intelligence defines competitive advantage.
Risk-Free & Low-Risk Trading Strategies1. Understanding Risk in Trading
Before discussing strategies, it is essential to define what “risk” in trading entails. Risk refers to the probability of losing capital or the variance in returns. Common sources of trading risk include:
Market Risk: Price movements due to supply-demand dynamics or macroeconomic events.
Liquidity Risk: Difficulty in executing trades at desired prices.
Credit Risk: Counterparty default in derivative or forex transactions.
Operational Risk: Errors in execution, system failures, or regulatory breaches.
Event Risk: Sudden political, geopolitical, or natural events affecting markets.
Low-risk trading reduces exposure to these uncertainties, whereas risk-free trading strategies aim for almost certain outcomes, often through hedging or arbitrage.
2. Risk-Free Trading: Myth vs. Reality
While absolute risk-free trading is theoretically impossible in volatile markets, practically risk-free methods exist. These strategies rely on mechanisms like hedging, arbitrage, and government-backed instruments to eliminate or drastically reduce exposure.
2.1. Arbitrage Trading
Arbitrage is the simultaneous purchase and sale of an asset in different markets to exploit price discrepancies.
Types of arbitrage:
Stock Arbitrage: Buying a stock on one exchange where it is undervalued and selling on another where it is overvalued.
Forex Arbitrage: Exploiting currency price differences between two brokers or platforms.
Options Arbitrage: Using options strategies (like conversion or reversal trades) to lock in risk-free profits.
Example: If stock ABC trades at $100 on Exchange A and $101 on Exchange B, a trader can buy at $100 and sell at $101 simultaneously, capturing a risk-free $1 per share, minus transaction costs.
Pros: Almost zero market risk if executed correctly.
Cons: Requires high-speed execution, large capital, and minimal transaction costs.
2.2. Hedged Trading
Hedging involves taking offsetting positions to neutralize risk exposure.
Futures Hedging: A stockholder can sell futures contracts to protect against downside price movement.
Options Hedging: Buying put options against an equity holding to ensure a minimum exit price.
Forex Hedging: Holding positions in correlated currency pairs to minimize volatility risk.
Example: An investor holding 1000 shares of Company XYZ can buy put options with a strike price equal to the current market price. Even if XYZ falls sharply, the loss on shares is offset by gains on the options.
Pros: Reduces potential losses dramatically.
Cons: Hedging reduces potential profits; cost of options or futures must be considered.
2.3. Government Bonds and Treasury Instruments
Investments in government securities are often considered risk-free in terms of default (e.g., U.S. Treasury bonds).
Treasury Bills (T-Bills): Short-term government securities with fixed maturity.
Treasury Bonds: Long-term fixed-income instruments.
Inflation-Protected Securities (TIPS): Offer returns adjusted for inflation, protecting purchasing power.
Pros: Virtually no credit risk.
Cons: Returns are modest; inflation can erode gains if not using inflation-linked instruments.
3. Low-Risk Trading Strategies
While risk-free strategies focus on elimination of risk, low-risk strategies aim for capital preservation while achieving steady returns. These strategies balance risk and reward carefully.
3.1. Dollar-Cost Averaging (DCA)
Dollar-cost averaging involves investing a fixed amount at regular intervals, regardless of market conditions.
Smooths out volatility over time.
Reduces the emotional impact of market swings.
Works best in trending markets over the long term.
Example: Investing $500 monthly into an index fund. When the market is low, more units are purchased; when high, fewer units are bought, lowering average cost.
Pros: Simple, disciplined, and low-risk.
Cons: Not optimal for short-term trading; returns may be lower during strong bull markets.
3.2. Index Fund Investing
Instead of picking individual stocks, investing in broad market index funds spreads risk across multiple companies.
Reduces company-specific risk.
Tracks overall market growth.
Can be paired with DCA for better risk management.
Pros: Diversification, minimal research required, lower volatility.
Cons: Market risk still exists; less upside than high-growth stocks.
3.3. Blue-Chip Stock Trading
Blue-chip stocks are shares of large, financially stable companies with consistent performance.
Lower volatility than small-cap stocks.
Regular dividends can provide steady income.
Often resilient during economic downturns.
Pros: Low default risk, capital preservation.
Cons: Slower growth; requires proper selection and monitoring.
3.4. Covered Call Strategy
This options-based strategy involves holding a stock and selling call options on it.
Generates additional income through option premiums.
Slightly reduces downside exposure through received premiums.
Particularly effective in sideways or mildly bullish markets.
Example: Owning 100 shares of XYZ at $50 and selling a call option with a $55 strike. Premium collected provides cushion if stock drops.
Pros: Enhances income, lowers risk.
Cons: Caps upside gains; requires options knowledge.
3.5. Pair Trading
Pair trading is a market-neutral strategy where two correlated assets are traded simultaneously:
Long the undervalued asset.
Short the overvalued asset.
Example: If Stock A and Stock B historically move together but A rises while B falls, buy B and short A to profit when they revert.
Pros: Market risk minimized; suitable for volatile markets.
Cons: Requires statistical analysis and careful monitoring; capital-intensive.
4. Advanced Low-Risk Techniques
For more sophisticated traders, advanced methods further mitigate risk while preserving upside.
4.1. Volatility Trading
Low-risk traders can trade volatility rather than directional market moves:
Use VIX-linked ETFs or options to profit from volatility spikes.
Benefit from market stress without holding underlying assets.
Pros: Diversifies risk; potential profit in sideways or declining markets.
Cons: Complex; requires understanding implied and historical volatility.
4.2. Stop-Loss and Trailing Stop Orders
Setting stop-loss orders automatically exits a position if losses exceed a predetermined threshold.
Fixed Stop-Loss: Exits at a specific price.
Trailing Stop-Loss: Adjusts automatically as the market moves favorably.
Pros: Limits downside risk; enforces discipline.
Cons: Can trigger during short-term fluctuations; may miss recoveries.
4.3. Risk Parity Portfolio
This approach allocates capital across assets so that each contributes equally to overall portfolio risk.
Combines equities, bonds, commodities, and cash.
Adjusts exposure based on volatility.
Reduces portfolio-wide drawdowns.
Pros: Balanced risk; improves long-term stability.
Cons: Complex; requires continuous rebalancing.
5. Risk Assessment and Management Tools
No strategy is complete without proper risk assessment and management techniques:
Value-at-Risk (VaR): Estimates potential loss over a period with a confidence interval.
Beta Coefficient: Measures a stock’s volatility relative to the market.
Sharpe Ratio: Assesses risk-adjusted return.
Stress Testing: Simulates extreme market scenarios to evaluate strategy resilience.
Practical Tip: Combine quantitative tools with qualitative judgment. For example, even a historically low-beta stock may experience sudden drops during geopolitical crises.
6. Practical Examples of Risk-Free & Low-Risk Portfolios
Example 1: Risk-Free Arbitrage
Buy stock at $100 in Exchange A.
Sell at $101 in Exchange B.
Trade size: 1,000 shares.
Profit: $1,000 minus transaction costs.
Outcome: Nearly risk-free profit.
Example 2: Low-Risk Dividend Strategy
Portfolio: 60% blue-chip dividend stocks, 30% bonds, 10% cash.
Dividend yield: 3–5%.
Potential capital appreciation: Moderate.
Risk: Low, as losses are cushioned by bonds and cash.
Example 3: Hedged Options Strategy
Own 1,000 shares of XYZ at $50.
Buy 10 put options with strike $50.
Market drops to $40; put options gain, offsetting stock loss.
Outcome: Capital preservation, limited downside.
7. Key Principles for Low-Risk & Risk-Free Trading
Diversification: Spread capital across assets and sectors to reduce concentration risk.
Hedging: Use derivatives or correlated instruments to offset potential losses.
Discipline: Stick to strategies; avoid emotional trades.
Monitoring: Track markets, news, and portfolio performance regularly.
Leverage Caution: Avoid excessive leverage; amplifies both gains and losses.
Liquidity Awareness: Ensure positions can be exited quickly if needed.
Continuous Learning: Markets evolve; strategies must adapt.
8. Limitations and Realistic Expectations
Risk-free profits are usually small and capital-intensive.
Low-risk strategies sacrifice some upside potential for safety.
Market anomalies, slippage, or transaction costs can erode expected gains.
Even highly diversified portfolios are not immune to systemic crises.
Mindset Tip: Focus on capital preservation first, then on incremental gains. Compounding small, consistent returns often outperforms high-risk speculation over time.
9. Conclusion
Risk-free and low-risk trading strategies are vital for traders seeking consistent returns with capital protection. While no method guarantees absolute safety, techniques like arbitrage, hedging, DCA, diversification, and options-based strategies can significantly reduce exposure.
Successful low-risk trading is less about chasing big profits and more about disciplined execution, risk assessment, and strategy adaptation. By combining these methods with proper monitoring and financial tools, traders can navigate market volatility confidently, protecting capital while capturing incremental gains.
Final Thought: In trading, preserving what you earn is as important as earning itself. Low-risk and risk-free strategies are not just methods—they’re a mindset that prioritizes security, consistency, and long-term growth.