RSI ( Relative Strength Index)In trading, RSI stands for Relative Strength Index, a momentum indicator used to assess overbought or oversold conditions in a market. It measures the speed and change of price movements, providing traders with insights into potential entry and exit points.
X-indicator

MACD ( Moving Average Convergence Divergence)MACD, which stands for Moving Average Convergence Divergence, is a technical indicator used in financial markets to identify potential trading opportunities and analyze price trends. It measures the relationship between two moving averages of a security's price. The MACD indicator is particularly useful for assessing momentum and determining potential trend reversals.

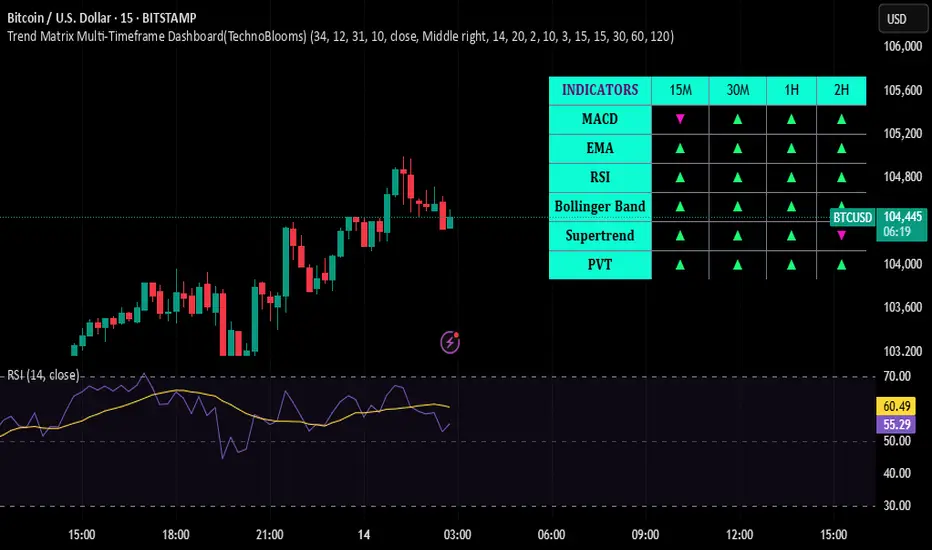
Trend Matrix+RSI: Simple Multi‑Timeframe Strategy for Confident 🔰 Trend Matrix + RSI: Simple Multi‑Timeframe Strategy for Confident Trades 🚀
Want a strategy that’s easy for beginners yet powerful enough for pros? This TradingView idea combines the Trend Matrix Multi-Timeframe Dashboard with the classic RSI indicator to create a visually compelling, high-probability trading method. By aligning multi-timeframe trend signals with momentum confirmation, you get clear guidance on when to enter and exit trades on any market – from Bitcoin and Gold to Nifty 50. 📈✨
Strategy Overview 🎯
• Trend Matrix MTF Dashboard: This is a multi-timeframe trend analyzer that compresses several trusted indicators into one simple dashboard . It displays a grid of up/down arrows showing the trend signal from multiple indicators (like MACD, EMA, RSI, Bollinger Bands, Supertrend, PVT) across different timeframes . If most arrows are green (up), the market’s trend is bullish; if mostly red (down), it’s bearish. Think of it as a “trend at a glance” panel – a quick green-light/red-light system that helps you trade with confidence by filtering out noise . It’s designed to be clean and beginner-friendly (no messy charts!) , so you can instantly gauge the dominant trend without flipping through multiple timeframes.
• RSI (Relative Strength Index): RSI measures momentum and identifies overbought/oversold conditions. It’s a favorite tool for confirming entries: when RSI is low (oversold) in an uptrend, it suggests a good buy the dip opportunity; when RSI is high (overbought) in a downtrend, it suggests a good sell the rally spot . RSI also has a midpoint at 50 – above 50 generally indicates bullish momentum, below 50 indicates bearish momentum. By combining RSI with the Trend Matrix, we add an extra layer of confirmation so we’re not just blindly following trend signals – we’re waiting for momentum to agree with the trend direction.
Why this combo? The Trend Matrix gives you the big picture trend alignment (across 1H, 15M, etc.) while RSI pinpoints timing for entries. This way, you trade with the larger trend but only enter when momentum swings in your favor. The result is a simple strategy that catches strong moves and avoids false signals. This works best in trending markets (when the Trend Matrix shows a clear majority direction) – that’s when our trend+momentum combo shines. In choppy/ranging markets (mixed signals on the dashboard), it’s wise to be patient or use tighter confirmation (e.g. require an extra indicator or higher RSI threshold) because signals can flip-flop in ranges. Always remember: no indicator is 100%, but combining them stacks the odds in our favor by aligning trend and momentum. 💪
Entry & Exit Rules 📌
Timeframes: Higher timeframe: 1H (for trend direction) – Lower timeframe: 15M (for entries). We use 1H Trend Matrix to define the context, and 15M with RSI for execution. (You can adapt to other pairs like 4H/1H for swing trades or 15M/5M for scalping, but 1H/15M is a universal starting point that works for crypto, commodities, and indices.)
1️⃣ Identify the Trend (1H Chart): Check the Trend Matrix dashboard on the 1H timeframe for the asset you’re trading (e.g., BTC/USD, XAUUSD, NIFTY). If the majority of signals on 1H are up (mostly green arrows), your bias is LONG. If the majority are down (mostly red arrows), your bias is SHORT. No clear majority? The market might be sideways – consider waiting. 👍
2️⃣ Align Lower Timeframe (15M Chart): Switch to the 15M chart. Ensure the 15M Trend Matrix is at least mostly aligned in the same direction as the 1H. You want to see that the short-term trend is not fighting the higher timeframe. This keeps you trading in the direction of the dominant trend, avoiding counter-trend traps  .
3️⃣ RSI Confirmation for Entry: Now use RSI on the 15M chart to time your entry:
• For a Long Trade: Wait for RSI to dip into an oversold zone (below ~30) during that uptrend. An oversold reading in a bullish-trending market means price pulled back against the trend – a potential entry point. Enter long when RSI starts rising back up (e.g., crosses above 30 or 40 from below) and the Trend Matrix still shows bullish alignment. Another method: if RSI was below 50 and then pushes back above 50, it signals momentum is regaining in the upward direction . This is your green light to buy.
• For a Short Trade: Wait for RSI to spike into an overbought zone (above ~70) during that downtrend. Overbought in a bearish trend = a bounce that could reverse down. Enter short when RSI turns down from high levels (e.g., drops below 70 or 60) and the Trend Matrix still shows bearish alignment. Alternatively, an RSI cross from above 50 downwards back below 50 can confirm momentum turning down with the trend .
✨ The idea is to buy dips in an uptrend and sell rips in a downtrend. RSI is your trigger to make sure you’re entering when momentum is resetting in your favor, rather than chasing an already overextended move.
4️⃣ Exiting the Trade: Set clear exit rules to lock in profit and limit risk:
• Take Profit/Exit on Momentum Extremes: In a long, consider taking profit when RSI reaches back into overbought (>70) on the 15M or shows a bearish divergence (signs of trend exhaustion). In a short, take profit when RSI goes oversold (<30) or shows bullish divergence. This way, you exit as the move reaches the opposite extreme of momentum.
• Dashboard Trend Reversal: If the Trend Matrix starts to flip signals against your trade (e.g., you were long and you see several key cells turn from green to red on the 15M or 1H dashboard), that warns the trend may be weakening. You could exit if 4-5 or more of the 15M signals turn opposite or if the 1H majority is no longer aligned . For example, if you’re long and the dashboard goes from mostly green to half red, it’s time to secure profits or tighten your stop.
• Stop Loss: Always use a stop! A common approach is placing a stop-loss below the recent swing low (for longs) or above the recent swing high (for shorts) on the 15M chart. If price hits this, it means the setup failed and you exit the trade to prevent larger losses. 🔒
By following these entry/exit rules, you’ll ride the trend when both the trend structure (Trend Matrix) and momentum (RSI) agree, and step aside when they don’t.
Tips for Beginners 💡
• Stick to Clear Trends: This strategy shines in clear uptrends or downtrends. If the Trend Matrix panel is mixed (some green, some red), the market may be choppy – be patient or skip trading until a direction emerges. 🔃
• Use 1H/15M as a Starting Point: For versatility, start with 1H trend and 15M entries, which works well for intraday and short swing trades on BTC, Gold, Nifty, etc. Once comfortable, you can experiment with other timeframe pairs (e.g., 4H/1H for longer swings, or 15M/5M for faster scalps).
• Don’t Ignore Risk Management: Even the best strategy can have losses. Always set a stop-loss and manage your trade size. For example, if the dashboard and RSI setup looks perfect, still only risk a small percentage of your capital on the trade. Risk management is key to long-term success. 📉🔒
• Practice and Review: Try this combo out on historical data or a demo account first. Observe how often the signals would have worked and how you might fine-tune entry timing. With practice, you’ll get a feel for how the Trend Matrix and RSI interact. 📝✅
• Stay Emotionally Disciplined: The dashboard gives a quick green/red view, and RSI adds confidence, but avoid taking trades out of FOMO if the criteria aren’t met. It’s okay to miss a move – there will always be another opportunity. Keep a cool head and stick to the rules. 👍
By following this beginner-friendly game plan, you’ll be leveraging a powerful multi-timeframe edge. The Trend Matrix + RSI combo helps ensure you trade with the trend and with momentum on your side – a recipe for more confident and higher-probability trades. Good luck and happy trading! 🍀🚀
#BTCUSD #XAUUSD #NIFTY50 #TrendMatrix #RSI #TradingStrategy #MultiTimeframe #DayTrading #SwingTrading #TechnoBlooms #Beginners
Option Trading : Options trading gives you the right or obligation to buy or sell a specific security on or by a specific date at a specific price. An option is a contract that's linked to an underlying asset, such as a stock or another security.

PCR (Put and Call Ratio) TradingThe Put-Call Ratio (PCR) is a technical indicator that measures the relative volume of put options to call options in a specific timeframe. It's used to gauge overall market sentiment, with a higher PCR indicating more bearish sentiment and a lower PCR suggesting more bullish sentiment.

Divergence based TradingDivergence occurs when the stochastic oscillator's peaks or troughs disagree with the price. For instance, if the stochastic makes lower highs while the price is rising, it indicates a bearish divergence. Likewise, higher stochastic lows against lower price lows indicate a bullish divergence

Candle Sticks Pattern part 1Candlestick patterns are a visual representation of price movements in financial markets, used in technical analysis to identify potential trend reversals or continuations. Each candlestick represents a specific time period and shows the opening, closing, high, and low prices during that period. By recognizing these patterns, traders can gain insights into market sentiment and make more informed trading decisions.

Institutional Trading part 6Institutional trading consists of the purchase and sale of financial assets by institutions through their traders. This definition of institutional trading applies to institutional equity trading, institutional stock trading, institutional options trading - any subcategory.

Institutional Trading part 3Institutional trading refers to the buying and selling of securities on behalf of large organizations or institutions, like mutual funds, pension funds, and insurance companies. Unlike retail traders who trade with their personal accounts, institutional traders manage money for others, often in large volumes. They may also have access to more complex financial instruments and investment opportunities.

Institutional Trading part 1Institutional trading consists of the purchase and sale of financial assets by institutions through their traders. This definition of institutional trading applies to institutional equity trading, institutional stock trading, institutional options trading - any subcategory.

Why Most Traders Lose Even With “Perfect” Setups!!Intro:
You did everything right.
• Breakout confirmed
• Trendline aligned
• Moving average supported it
• Risk-to-reward looked clean
You clicked “Buy”…
…and the market slapped your SL like it never cared about your plan.
Sound familiar?
You’re not alone.
Because in reality — it’s not the setup that wins the trade. It’s the context.
⸻
1. A Setup Is Just a Structure — Not a Signal
Most traders believe that a clean pattern = green trade.
But setups don’t function in a vacuum.
A double top isn’t bearish if liquidity hasn’t been swept.
A breakout isn’t valid if it happens during a low-volume lunch session.
An engulfing candle means nothing if it’s part of a choppy range.
Without context, your setup is just a drawing.
⸻
2. Timing > Pattern
Ask any experienced trader — timing is everything.
The same setup can work beautifully during London open…
…and completely fail during Asia session close.
Why? Because the market’s energy shifts by the hour:
• Volatility comes in waves
• Liquidity rotates by session
• Algos and institutions dominate at specific times
A perfect setup placed in the wrong hour is like planting a seed in dry soil — it won’t grow.
⸻
3. The Market Doesn’t Reward Pretty — It Rewards Precision
Retail loves:
• Trendline breaks
• RSI divergences
• Candle patterns
And sure, these can work.
But pros look at:
• Reaction vs anticipation
• Structure break vs pattern illusion
• Candle behavior at the level — not just the level itself
The market doesn’t respect geometry — it respects liquidity and intent.
⸻
4. Confirmation Isn’t Just Visual — It’s Behavioral
Retail confirmation = “candle looks good.”
Pro confirmation = “Did price react how it should at my zone?”
Ask:
• Did it trap early entries?
• Was there a failed attempt before the breakout?
• Did the volume drop off on the retrace?
The best setups aren’t the ones that look perfect —
They’re the ones that behave like they’re supported by real orders.
⸻
5. Most Losses Come From One Mistake: Trading Too Early
Here’s what happens:
• You see the pattern forming
• You try to front-run the move
• You skip confirmation
• Market pulls back, triggers your SL
• Then moves exactly where you thought — without you
Sound familiar?
That’s impatience, not a bad setup.
The market didn’t fail you — you jumped the gun.
⸻
So What Actually Matters?
• When is the trade happening? (session, timing, volatility)
• How did price behave leading up to it? (liquidity sweep, false moves)
• What’s the bigger structure? (HTF trend, bias)
• Is there volume? Is there intent? Or just noise?
The difference between a pro and a struggler?
The pro waits.
The struggler reacts.
⸻
Final Word:
Setups are the start.
Context, confirmation, and timing are the edge.
Most traders fail because they think chart patterns will save them.
But the ones who thrive?
They study behavior, not just structure.
So next time your “perfect” setup fails — don’t redraw the line.
Rethink why you entered.
Because in trading, how you act matters more than what you see.
Support and Resistance part 2The support and resistance (S&R) are specific price points on a chart expected to attract the maximum amount of either buying or selling. The support price is a price at which one can expect more buyers than sellers. Likewise, the resistance price is a price at which one can expect more sellers than buyers.

Advanced Trading part 2Advanced trading encompasses sophisticated strategies, tools, and techniques used by experienced traders to navigate complex financial markets and potentially generate higher returns. It involves a deeper understanding of market dynamics, risk management, and technical analysis beyond the basics.

Institutional Trading StrategiesInstitutional traders, including high-frequency trading (HFT) firms, hedge funds, proprietary trading firms, and buy-side institutions, leverage sophisticated strategies powered by algorithmic trading and API automation to gain an edge in financial markets.

Instituional trading part 4Institutional trading refers to the buying and selling of securities on behalf of large organizations or institutions, like mutual funds, pension funds, and insurance companies. Unlike retail traders who trade with their personal accounts, institutional traders manage money for others, often in large volumes. They may also have access to more complex financial instruments and investment opportunities.

MACD (Moving Average Convergence Divergence) part 2MACD, short for Moving Average Convergence Divergence, is a momentum indicator used in technical analysis to identify potential trend changes in a financial market. It's calculated by comparing two exponential moving averages (EMAs) and is represented by a line, a signal line (which is a moving average of the MACD line), and optionally a histogram.

Advanced Database TradingAdvanced Database Trading refers to the use of sophisticated database technologies and techniques in the context of financial markets and trading activities. This includes using specialized databases for real-time data analysis, algorithmic trading, and risk management, as well as leveraging data mining and advanced analytical tools to identify patterns and make informed trading decisions.

Financial MarketsFinancial markets are platforms where individuals, companies, and governments trade financial instruments like stocks, bonds, currencies, and derivatives. These markets facilitate the flow of capital, enabling businesses to raise funds, individuals to invest, and governments to manage their finances.

MACD ( Moving Average Convergence Divergence)MACD, or Moving Average Convergence Divergence, is a momentum indicator used in technical analysis to identify changes in the strength, direction, and duration of a trend. It's calculated by finding the difference between two exponential moving averages (EMAs), typically a 12-period and a 26-period EMA.

Option and Database Trading Options data providers collect specific data points that can later be used to determine price movements over time. These price changes in the stock market help investors and brokers decide which stocks might be ideal to sell or buy given current market conditions.

Institutional Trading part 5Institutional traders are defined as traders who engage in the buying and selling of securities for the accounts that they manage for any institution or a group of people. Some of the most common examples of institutional traders are mutual funds, pension funds, insurance companies, and exchange-traded funds. These institutional traders are capable of investing in securities that are generally not available for retail traders. These securities include both swaps and forwards

Institutional Trading part 4Institutional trading consists of the purchase and sale of financial assets by institutions through their traders. This definition of institutional trading applies to institutional equity trading, institutional stock trading, institutional options trading - any subcategory.

Divergence SecretsIn trading, divergence occurs when the price action of an asset moves in the opposite direction to what a technical indicator, such as a momentum oscillator, indicates. This discrepancy can signal a potential change in trend momentum or a possible reversal of the existing trend.
