Types of Trading Strategies1. Scalping Strategy
Scalping is one of the fastest trading styles, where traders aim to profit from small price movements within very short timeframes — sometimes just seconds or minutes. Scalpers make multiple trades throughout the day, capturing small gains that can accumulate into significant profits over time.
Key Features:
Very short-term trades (seconds to minutes).
High number of trades per day.
Focus on liquidity and tight spreads.
Heavy reliance on technical indicators such as moving averages, Bollinger Bands, and volume indicators.
Advantages:
Quick results and high trading frequency.
Reduced exposure to overnight risk.
Disadvantages:
Requires constant monitoring and quick decision-making.
High transaction costs due to frequent trades.
Scalping is best suited for highly experienced traders with fast execution systems and access to low transaction fees.
2. Day Trading Strategy
Day trading involves buying and selling financial instruments within the same trading day to capitalize on intraday price movements. Traders close all positions before the market closes to avoid overnight risks like unexpected news or global events.
Key Features:
Positions last from minutes to hours.
No overnight holdings.
Heavy use of technical analysis and intraday charts like 5-minute or 15-minute timeframes.
Common Tools Used:
VWAP (Volume Weighted Average Price)
Relative Strength Index (RSI)
MACD (Moving Average Convergence Divergence)
Support and resistance levels
Advantages:
Avoids overnight market gaps and risks.
Multiple opportunities within a single session.
Disadvantages:
High emotional and mental pressure.
Requires significant time and attention during market hours.
Day trading is popular among retail traders and professionals who thrive in fast-paced environments.
3. Swing Trading Strategy
Swing trading is a medium-term strategy that aims to capture price "swings" within a trend. Traders hold positions for several days to weeks, seeking to benefit from short-term momentum.
Key Features:
Time horizon: few days to a few weeks.
Combination of technical and fundamental analysis.
Focus on trend reversals and continuation patterns.
Tools & Indicators:
Trendlines and channels
Moving averages (20, 50, 200 EMA)
Fibonacci retracement levels
Candlestick patterns
Advantages:
Less time-intensive than day trading.
Opportunity to capture larger price moves.
Disadvantages:
Exposure to overnight or weekend risks.
Requires patience and discipline.
Swing trading is ideal for part-time traders who cannot monitor the market all day but still want to actively participate in trading opportunities.
4. Position Trading Strategy
Position trading is a long-term approach where traders hold positions for weeks, months, or even years. It relies more on fundamental analysis—such as company earnings, interest rate trends, or macroeconomic indicators—than on short-term price patterns.
Key Features:
Long-term holding period.
Minimal monitoring compared to short-term trading.
Focus on underlying market fundamentals.
Examples:
Buying undervalued stocks for long-term appreciation.
Holding commodities or currencies based on economic cycles.
Advantages:
Lower transaction costs.
Reduced stress and less market noise.
Disadvantages:
Capital gets locked for longer periods.
Market reversals can lead to larger drawdowns.
Position trading suits investors with patience and a long-term vision.
5. Momentum Trading Strategy
Momentum traders aim to capture profits by trading stocks or assets showing strong price movement in one direction with high volume. The idea is to “ride the wave” of momentum until signs of reversal appear.
Key Features:
Focus on assets with strong trend and volume.
Technical indicators like RSI, MACD, and moving averages are crucial.
Entry often occurs after a breakout from key levels.
Advantages:
Can generate large profits in trending markets.
Simple concept based on market psychology.
Disadvantages:
Reversal risk: momentum can fade suddenly.
Requires strict stop-loss management.
Momentum trading is effective in volatile markets where price trends are strong and sustained.
6. Breakout Trading Strategy
Breakout trading focuses on entering trades when price breaks through a predefined support or resistance level with strong volume. The idea is that once a key level is broken, price tends to continue moving in that direction.
Key Features:
Entry upon confirmed breakout (above resistance or below support).
Stop-loss often placed near the breakout point.
Works well in trending markets.
Advantages:
Early entry in new trends.
High reward potential when breakouts are strong.
Disadvantages:
False breakouts can lead to losses.
Requires confirmation with volume and momentum indicators.
Breakout traders often use chart patterns such as triangles, flags, or rectangles to identify setups.
7. Mean Reversion Strategy
The mean reversion concept assumes that prices will eventually revert to their historical average or “mean.” Traders look for assets that have deviated significantly from their average and place trades expecting a correction.
Key Tools:
Bollinger Bands
Moving Averages
Z-score or Standard Deviation
Example:
If a stock trades far above its average price, a trader might short it expecting a pullback; if it’s below average, they might go long.
Advantages:
Works well in range-bound markets.
Statistically driven and often systematic.
Disadvantages:
Ineffective during strong trending periods.
Risk of extended deviations before mean reversion happens.
Mean reversion is popular in algorithmic and quantitative trading systems.
8. Arbitrage Strategy
Arbitrage trading exploits price differences of the same or related assets across different markets or platforms. It involves buying an asset at a lower price in one market and selling it at a higher price in another.
Types of Arbitrage:
Spatial arbitrage: Same asset on different exchanges.
Statistical arbitrage: Price inefficiencies identified through algorithms.
Merger arbitrage: Trading based on corporate event outcomes.
Advantages:
Low risk when executed properly.
Often provides consistent, small profits.
Disadvantages:
Requires large capital and fast execution systems.
Opportunities are short-lived due to market efficiency.
Arbitrage is mostly used by institutional and algorithmic traders.
9. Algorithmic (Algo) Trading Strategy
Algorithmic trading uses computer programs to execute trades automatically based on pre-defined rules and market conditions. It eliminates emotional bias and can process vast amounts of data quickly.
Key Aspects:
Quantitative models and statistical analysis.
Uses technical indicators, price action, and AI-based decision systems.
Can include high-frequency trading (HFT).
Advantages:
Precision and speed.
Emotion-free and backtestable strategies.
Disadvantages:
Requires programming knowledge and infrastructure.
High risk of system errors or overfitting.
Algo trading dominates institutional markets and is increasingly popular among advanced retail traders.
10. News-Based or Event-Driven Trading Strategy
News-based traders take advantage of volatility caused by economic releases, earnings reports, or geopolitical events. They analyze how markets react to new information and place trades accordingly.
Examples of Events:
Central bank rate decisions.
Corporate earnings announcements.
Political elections or wars.
Advantages:
High volatility offers quick profit opportunities.
Based on real-time data rather than chart patterns.
Disadvantages:
Extremely risky due to unpredictability.
Slippage and widening spreads can occur during volatile events.
This strategy requires sharp analytical skills and real-time information access.
Conclusion
Each trading strategy has its own risk, reward potential, and time commitment. Scalping and day trading suit active traders seeking quick profits, while swing and position trading cater to those preferring a more relaxed pace. Momentum and breakout strategies thrive in trending markets, while mean reversion and arbitrage strategies work in stable or range-bound conditions.
The key to successful trading lies not in using the most popular strategy, but in finding one that fits your personality, capital, time, and risk appetite. Consistent discipline, risk management, and continuous learning form the foundation of every profitable trading strategy.
X-indicator
Global Cues & GIFT Nifty TradingIntroduction
In today’s interconnected financial ecosystem, no market operates in isolation. Global economic events, central bank policies, geopolitical tensions, and market trends from the U.S., Europe, and Asia all influence trading sentiment in India. This interconnectedness is what we call “global cues.” Traders closely watch these cues to anticipate how the GIFT Nifty (formerly SGX Nifty) and the Indian stock markets might open or behave during the trading day.
GIFT Nifty serves as a key pre-market indicator for the Indian equity market, offering traders a glimpse into potential market direction even before the domestic markets open. Let’s explore how global cues interact with GIFT Nifty trading and shape the overall sentiment in India’s financial markets.
What Are Global Cues?
Global cues refer to signals or influences originating from international markets that impact domestic trading behavior. These cues include movements in:
Major Global Indices like the Dow Jones, S&P 500, NASDAQ, FTSE 100, Nikkei 225, Hang Seng, and DAX.
Commodity Prices, such as crude oil, gold, and base metals.
Currency Movements, particularly USD/INR, EUR/USD, and other major pairs.
Bond Yields and global interest rates.
Macroeconomic Data, including inflation, GDP growth, and employment figures from key economies.
Geopolitical Events, such as wars, sanctions, trade agreements, or political instability.
These global indicators collectively affect investor confidence, risk appetite, and capital flows — which ultimately influence Indian markets and the GIFT Nifty.
Understanding GIFT Nifty
GIFT Nifty, officially known as GIFT Nifty 50 Futures, is traded on the NSE International Exchange (NSE IX), located in the GIFT City (Gujarat International Finance Tec-City) in India. It replaced the SGX Nifty (Singapore Exchange Nifty), which was previously traded in Singapore until 2023.
The transition to GIFT Nifty marked India’s effort to bring offshore Nifty trading back within its borders, giving Indian regulators more control and transparency over derivatives linked to Indian markets.
Key features of GIFT Nifty:
Traded almost 21 hours a day, bridging Asian, European, and U.S. time zones.
Denominated in U.S. dollars, attracting foreign institutional participation.
Tracks the performance of the Nifty 50 index, India’s leading stock market benchmark.
Serves as a pre-market indicator for the direction of the Indian equity market.
Because GIFT Nifty trades while Indian markets are closed, its price movement gives traders an idea of how the Indian stock market may open the next morning.
The Role of Global Cues in GIFT Nifty Movements
GIFT Nifty is highly sensitive to global cues due to its extended trading hours overlapping with international markets. Here’s how global factors typically influence its performance:
1. U.S. Market Performance
The U.S. markets, especially indices like Dow Jones, S&P 500, and NASDAQ, play a dominant role in setting global risk sentiment. A strong rally on Wall Street often leads to bullish sentiment in Asian markets and GIFT Nifty, whereas a sharp decline usually results in bearish trends.
For instance, if the NASDAQ closes higher due to strong tech earnings, GIFT Nifty futures may rise overnight, hinting at a positive start for Indian markets.
2. Asian Market Trends
Since GIFT Nifty overlaps with Asian trading hours, performance in indices like Nikkei 225 (Japan), Hang Seng (Hong Kong), and Shanghai Composite (China) can significantly impact it. Weak Chinese data or yen fluctuations can trigger risk aversion across Asian equities, pulling down GIFT Nifty as well.
3. Crude Oil Prices
India is a major importer of crude oil. Rising oil prices increase India’s import bill, widen the current account deficit, and can fuel inflation—all negatives for the Indian economy. As a result, higher oil prices often pressure GIFT Nifty and the Indian rupee. Conversely, a sharp fall in oil prices tends to boost GIFT Nifty sentiment.
4. Currency Movements (USD/INR)
A weakening Indian rupee against the U.S. dollar usually signals foreign outflows and inflationary pressure, which dampen investor sentiment. GIFT Nifty tends to fall in such scenarios. On the other hand, a strengthening rupee supports positive sentiment and may lift GIFT Nifty.
5. U.S. Federal Reserve and Global Interest Rates
The Federal Reserve’s monetary policy decisions are closely tracked worldwide. Any hint of rate hikes or hawkish tone increases global risk aversion, leading to sell-offs in equities and a drop in GIFT Nifty. Conversely, dovish policies (rate cuts or liquidity support) boost risk-taking and lift markets globally.
6. Geopolitical Developments
Geopolitical events such as wars, trade conflicts, or sanctions can cause market volatility. For example, the Russia-Ukraine war initially led to a spike in oil prices and a global risk-off sentiment, dragging GIFT Nifty lower. Similarly, easing geopolitical tensions can trigger recovery rallies.
How Traders Use Global Cues in GIFT Nifty Trading
GIFT Nifty traders often analyze global cues to predict short-term price action and hedge positions in Indian equities. Some common strategies include:
Pre-Market Direction Prediction:
Traders track U.S. and European market closings to gauge where GIFT Nifty may open. This helps in planning trades for the Indian session.
Arbitrage Opportunities:
Since GIFT Nifty trades almost round-the-clock, traders exploit price differences between GIFT Nifty and NSE Nifty futures when domestic markets open.
Hedging FII Exposure:
Foreign institutional investors (FIIs) use GIFT Nifty to hedge their positions in Indian equities based on global risk factors.
Event-Based Trading:
Key global events like U.S. CPI data, Federal Reserve meetings, or OPEC announcements can trigger quick GIFT Nifty reactions. Traders position themselves accordingly before these announcements.
Example: How Global Cues Drive GIFT Nifty
Imagine this scenario:
The Dow Jones surges by 2% overnight on strong U.S. GDP data.
Brent crude drops below $80/barrel, easing inflation fears.
Asian markets open positive.
Result: GIFT Nifty futures jump 100–150 points, signaling a bullish opening for Indian markets the next morning.
In contrast, if:
U.S. bond yields rise sharply,
Crude oil climbs to $95/barrel, and
China reports weak factory data,
GIFT Nifty might fall 150–200 points, reflecting bearish sentiment before the Indian market opens.
Impact of Global Cues on Domestic Market Opening
Because GIFT Nifty trades overnight, it directly influences pre-market sentiment in India. News anchors and analysts frequently refer to “GIFT Nifty indicates a positive/negative start for the Indian markets.”
For example:
If GIFT Nifty is trading 100 points higher, it indicates a likely gap-up opening for Nifty 50.
If it’s 150 points lower, a gap-down opening can be expected.
This helps traders, especially intraday and short-term players, plan their strategies before the NSE opens.
The Future of GIFT Nifty and Global Integration
GIFT Nifty has strengthened India’s position in the global financial ecosystem. With extended trading hours and growing foreign participation, it acts as a bridge between Indian and international investors. As more global funds use GIFT Nifty for exposure to Indian markets, liquidity and volume are expected to rise.
Additionally, the establishment of GIFT City as a global financial hub aligns with India’s vision of becoming a major player in international finance. Over time, more derivative products linked to Indian indices and sectors may be introduced in GIFT City, further deepening market integration.
Conclusion
Global cues and GIFT Nifty trading are tightly interlinked, forming a vital part of India’s financial market ecosystem. Global economic data, geopolitical developments, commodity prices, and central bank policies directly impact GIFT Nifty’s movement — which, in turn, serves as a real-time barometer for the next day’s market sentiment in India.
For traders, understanding these relationships is essential. Those who effectively analyze global cues can make informed trading decisions, manage risk better, and anticipate market direction with greater accuracy. In essence, GIFT Nifty is not just a derivative product — it is India’s window to the world of global finance.

Emotional Discipline and Risk Control in Trading🧠 1. Why Emotional Discipline Matters
Emotional discipline means sticking to your plan regardless of fear or greed.
Markets are designed to test your patience, confidence, and decision-making. Every losing trade tempts you to change your system — but consistency wins.
✅ Key habits of emotionally disciplined traders:
They accept losses without revenge trading.
They follow rules, not impulses.
They manage expectations — no trade will make them rich overnight.
💰 2. Risk Control — Protect Before You Profit
Your risk management defines your survival. Successful traders think in probabilities, not certainties. They never risk too much on one idea.
📏 Golden Rules of Risk Control:
Risk 1–2% of your capital per trade.
Always use a stop-loss, never a “mental” one.
Define your R:R ratio (minimum 1:2 or better).
Never add to a losing position — only to confirmed winners.
Risk control is not about avoiding losses — it’s about limiting damage and staying consistent over time.
🧩 3. How to Strengthen Emotional Discipline
Like a muscle, discipline grows with routine. Try this daily:
Pre-trade routine – review your plan before every session.
Post-trade journal – log your emotions, not just results.
Take breaks – emotional fatigue leads to poor judgment.
Detach from outcomes – focus on process, not profit.
💡 Tip: When you reduce emotional pressure, your clarity and accuracy both improve.
⚙️ 4. Professional Mindset Shift
Amateurs chase profit; professionals protect capital.
Each trade is just one data point — not a reflection of your worth. Once you start thinking like a risk manager first, your results change naturally.
🗣️ “Discipline is choosing what you want most over what you want now.”
📊 Conclusion
To grow as a trader, focus on controlling yourself before controlling the market.
Emotional stability + strict risk control = long-term success.
Be the trader who executes with logic, not emotion. 🧘♂️

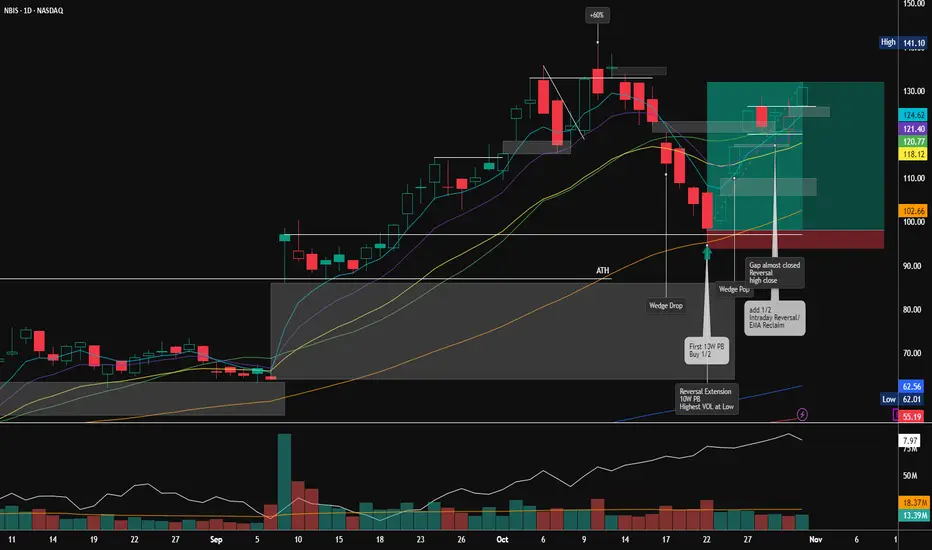
How would you Trade NBIS?Cyan -> 5 EMA
Violette -> 10 EMA
Yellow -> 20 EMA
Green -> 20 SMA
Orange -> 50 SMA
Blue -> 150 SMA
Red -> 200 SMA
Would you have traded NBIS exactly as I did?
Part 7 Trading Master Class With Experts Option Pricing: Understanding the Premium
Option prices are determined by several variables, most famously modeled using the Black-Scholes formula. The main components are:
Underlying Price: The current price of the asset.
Strike Price: The agreed-upon price for the option.
Time to Expiry: Longer durations increase premium due to higher uncertainty.
Volatility: Measures how much the underlying asset’s price fluctuates; higher volatility increases option prices.
Interest Rates and Dividends: Minor but relevant factors affecting option pricing.
Option premium = Intrinsic Value + Time Value
As expiration approaches, the time value declines—this is called time decay (Theta). This is why option sellers often benefit from the passage of time if prices remain stable.

Options Trading StrategiesIntroduction
Options trading has evolved into one of the most dynamic and flexible segments of the financial markets. Unlike straightforward stock trading, where you buy or sell shares, options trading gives traders the ability to structure positions that benefit from different market conditions — bullish, bearish, neutral, or volatile.
An option is a derivative contract that gives the holder the right, but not the obligation, to buy or sell an underlying asset (such as a stock, index, or commodity) at a specified price (called the strike price) before or on a particular date (called the expiry date).
Understanding and applying options trading strategies can allow traders to control risk, enhance returns, and profit even when the market moves sideways — a flexibility unmatched in other financial instruments.
1. Understanding the Basics of Options
Before diving into strategies, it’s crucial to grasp the fundamentals.
a. Types of Options
There are two main types of options:
Call Option: Gives the buyer the right to buy the underlying asset.
Put Option: Gives the buyer the right to sell the underlying asset.
b. Key Terminologies
Premium: The price paid for the option.
Strike Price: The price at which the holder can buy or sell.
Expiration Date: The date when the option contract expires.
In-the-Money (ITM): When exercising the option is profitable.
Out-of-the-Money (OTM): When exercising the option would result in a loss.
At-the-Money (ATM): When the strike price equals the market price.
c. Participants in Options Market
Buyers (Holders): Have limited risk (premium paid) but unlimited profit potential (for calls).
Sellers (Writers): Have limited profit (premium received) but potentially unlimited risk.
2. Why Use Options?
Options offer multiple strategic advantages:
Hedging: Protect an existing position against adverse price moves.
Speculation: Profit from market direction or volatility.
Income Generation: Earn premiums through writing options.
Leverage: Control a large position with limited capital.
Portfolio Flexibility: Create payoff structures that match specific market views.
3. Classification of Options Trading Strategies
Options strategies can be broadly divided based on market outlook and complexity.
A. Based on Market View
Bullish Strategies – Expecting prices to rise.
Bearish Strategies – Expecting prices to fall.
Neutral Strategies – Expecting limited price movement.
Volatility Strategies – Expecting large or small market swings.
B. Based on Construction
Single-Leg Strategies: Using one option (e.g., Buy Call).
Multi-Leg Strategies: Combining multiple options to shape risk and reward (e.g., Bull Spread, Iron Condor).
4. Popular Bullish Option Strategies
When a trader expects the underlying asset to rise in price, these strategies can be used:
a. Long Call
Structure: Buy a Call Option.
Objective: Profit from a strong upward move.
Risk: Limited to the premium paid.
Reward: Unlimited upside potential.
Example: Buy 1 NIFTY 22,000 Call at ₹100 when NIFTY = 21,800.
If NIFTY rises to 22,500, the call becomes worth ₹500 — a significant gain.
b. Bull Call Spread
Structure: Buy one Call (lower strike) and Sell one Call (higher strike).
Objective: Profit from a moderate rise in the underlying.
Risk: Limited to net premium paid.
Reward: Capped at the difference between strikes minus premium.
Example:
Buy 22,000 Call @ ₹100
Sell 22,200 Call @ ₹50
Net Cost = ₹50
Max Profit = ₹150 – ₹50 = ₹100
c. Bull Put Spread
Structure: Sell a Put (higher strike) and Buy a Put (lower strike).
Objective: Earn income with limited risk if prices rise or stay stable.
Risk: Difference in strike prices minus premium received.
Reward: Limited to net premium received.
5. Popular Bearish Option Strategies
These are used when expecting prices to decline.
a. Long Put
Structure: Buy a Put Option.
Objective: Profit from a fall in the underlying.
Risk: Limited to premium paid.
Reward: Substantial, as the price can fall sharply.
Example: Buy NIFTY 22,000 Put at ₹120.
If NIFTY falls to 21,500, the Put’s value jumps to ₹500.
b. Bear Put Spread
Structure: Buy a Put (higher strike) and Sell a Put (lower strike).
Objective: Profit from a moderate price decline.
Risk: Limited to net premium paid.
Reward: Limited to the difference in strike prices minus premium.
c. Bear Call Spread
Structure: Sell a Call (lower strike) and Buy a Call (higher strike).
Objective: Earn premium when expecting limited or downward movement.
Risk: Limited; capped by the spread between strikes.
Reward: Limited to premium received.
6. Neutral or Range-Bound Strategies
When the trader expects the market to stay within a range, the goal is to profit from time decay or lack of volatility.
a. Iron Condor
Structure: Combine a Bull Put Spread and a Bear Call Spread.
Objective: Profit if the price remains within a defined range.
Risk: Limited to the width of spreads minus total premium received.
Reward: Limited to the total premium collected.
This is a popular non-directional strategy among experienced traders.
b. Butterfly Spread
Structure: Combination of three strike prices — Buy 1 ITM option, Sell 2 ATM options, Buy 1 OTM option.
Objective: Profit from minimal price movement around a central strike.
Risk: Limited to premium paid.
Reward: Limited but high if price closes near middle strike.
c. Calendar (Time) Spread
Structure: Buy a long-term option and sell a short-term option at the same strike.
Objective: Profit from time decay and stability in price.
Risk: Limited to net debit.
Reward: Moderate, depending on volatility and expiry behavior.
7. Volatility-Based Strategies
These strategies are not focused on direction but rather on how much the market moves.
a. Long Straddle
Structure: Buy 1 Call + 1 Put at the same strike and expiry.
Objective: Profit from large movements in either direction.
Risk: Limited to total premium paid.
Reward: Unlimited on upside or significant downside.
Ideal during major announcements or earnings results.
b. Long Strangle
Structure: Buy 1 OTM Call and 1 OTM Put.
Objective: Profit from high volatility or large price swings.
Risk: Lower cost than Straddle, but needs bigger move to profit.
Reward: Unlimited upside and substantial downside potential.
c. Short Straddle / Short Strangle
Structure: Sell both options (Call and Put).
Objective: Profit from low volatility and time decay.
Risk: Unlimited if market breaks out sharply.
Reward: Limited to premium received.
Used primarily by experienced traders who can manage risk closely.
8. Advanced Multi-Leg and Professional Strategies
a. Iron Butterfly
Structure: Combines aspects of Butterfly and Iron Condor.
Objective: Profit from minimal movement with higher premium capture.
Reward/Risk: Both limited; works best in stable markets.
b. Ratio Spreads
Structure: Buy 1 option and Sell multiple options of another strike.
Objective: Earn higher returns in mildly trending markets.
Risk: Can become unlimited if price moves sharply beyond expected range.
c. Covered Call
Structure: Own the underlying stock + Sell a Call Option on it.
Objective: Generate steady income from held positions.
Risk: Limited downside from stock, capped upside.
Best For: Long-term investors seeking extra yield.
d. Protective Put
Structure: Buy a Put while holding the stock.
Objective: Hedge downside risk (like an insurance policy).
Risk: Premium cost, but protection against steep losses.
9. Risk Management in Options Trading
Even the best strategy can fail without proper risk control.
Follow these golden principles:
Use position sizing – Don’t allocate more than 2–5% of capital per trade.
Set stop-loss levels – Define exit levels before entering.
Avoid over-leverage – Options are leveraged instruments; misuse can lead to rapid losses.
Monitor volatility – Volatility spikes can distort premiums.
Backtest and paper trade before going live.
Use hedging to balance directional exposure.
10. Choosing the Right Strategy
Selecting an options strategy depends on:
Market View: Bullish, Bearish, Neutral, or Volatile.
Risk Appetite: Conservative vs. Aggressive.
Time Horizon: Short-term trades vs. longer-term positions.
Volatility Levels: High volatility favors selling; low volatility favors buying.
For example:
Expecting big move? → Long Straddle or Strangle.
Expecting stability? → Iron Condor or Butterfly.
Expecting a mild uptrend? → Bull Call Spread.
Expecting moderate decline? → Bear Put Spread.
11. Common Mistakes to Avoid
Ignoring implied volatility before trading.
Using naked options without capital cushion.
Overtrading during volatile sessions.
Holding OTM options till expiry hoping for miracle moves.
Not considering time decay.
Skipping risk-reward calculations.
12. Practical Application and Example
Imagine NIFTY is at 22,000, and you expect a modest rise in two weeks.
You buy 22,000 Call @ ₹100
You sell 22,200 Call @ ₹50
→ Bull Call Spread.
If NIFTY closes at 22,300, your profit = ₹150 – ₹50 = ₹100 per unit.
If it falls, your loss = ₹50 (the premium net paid).
Thus, a defined risk and reward structure makes this strategy ideal for disciplined traders.
Conclusion
Options Trading Strategies open a vast field of opportunities for traders to profit from every kind of market — up, down, or sideways. What makes options powerful is their flexibility, limited-risk nature, and ability to hedge existing portfolios.
However, success in options trading doesn’t come from luck; it arises from understanding market structure, volatility, time decay, and disciplined execution. Traders who master both the art and science of strategy selection, risk management, and psychology can turn options into a consistent and powerful trading edge.
In essence, options trading is not about predicting the market but preparing for it.

Technical Analysis & Price Action MasteryIntroduction
In the world of trading, where market movements can shift within seconds, the ability to interpret price charts and forecast future moves is one of the most valuable skills a trader can possess. Technical analysis and price action mastery together form the foundation of this skill — enabling traders to read market psychology, anticipate potential reversals, and make data-driven decisions with confidence.
Unlike fundamental analysis, which focuses on company performance or macroeconomic indicators, technical analysis studies the market itself — using price, volume, and chart patterns to identify opportunities. Price action, on the other hand, takes this a step deeper by interpreting raw price movements without relying on indicators.
Mastering these two disciplines allows a trader to see beyond noise and understand the true story behind every candle on a chart — the story of buyers and sellers in constant battle.
1. The Essence of Technical Analysis
Technical analysis is based on three key principles formulated decades ago by Charles Dow — the father of modern market analysis. These principles still guide traders today:
Price Discounts Everything
All available information — economic, political, or psychological — is already reflected in price. Therefore, price itself becomes the ultimate truth.
Price Moves in Trends
Markets rarely move randomly. They follow identifiable patterns — uptrends, downtrends, or sideways ranges — which tend to persist until a clear reversal occurs.
History Tends to Repeat Itself
Human emotions like fear and greed drive markets. Because human psychology is constant, the patterns formed by price movements often repeat over time.
These foundations make technical analysis a universal language for traders across asset classes — whether in stocks, forex, commodities, or cryptocurrencies.
2. Tools and Techniques of Technical Analysis
Technical analysis is a broad field that combines multiple tools and strategies. The most widely used include:
a) Chart Types
Line Charts: Simplest form; shows closing prices over time — good for spotting long-term trends.
Bar Charts: Display open, high, low, and close — providing more depth.
Candlestick Charts: The most popular; visually intuitive and used for price action analysis. Each candle tells a story of market sentiment.
b) Trend Analysis
Trendlines help traders visualize the direction of price.
Uptrend: Higher highs and higher lows.
Downtrend: Lower highs and lower lows.
Sideways Trend: Range-bound, showing indecision.
A disciplined trader uses trendlines and moving averages to confirm trend direction before entering trades.
c) Support and Resistance
Support is where demand prevents the price from falling further; resistance is where supply halts a price rise. These zones are psychological barriers where traders often enter or exit trades.
A breakout above resistance or breakdown below support often signals strong market momentum.
d) Volume Analysis
Volume validates price moves. A price rise accompanied by high volume signals strength, while a rise on low volume can suggest weakness. Volume indicators like On-Balance Volume (OBV) and Volume Profile help in understanding the participation behind a move.
e) Indicators and Oscillators
While price action traders may avoid heavy indicator use, technical analysts often rely on tools for additional confirmation:
Moving Averages (MA): Identify trend direction and momentum.
Relative Strength Index (RSI): Measures overbought or oversold conditions.
MACD (Moving Average Convergence Divergence): Reveals momentum shifts.
Bollinger Bands: Indicate volatility and potential breakouts.
The best traders, however, use indicators as supporting evidence, not as the sole basis for decisions.
3. Understanding Price Action: The Heart of Market Psychology
Price Action is the purest form of technical analysis. It strips away indicators and focuses solely on how price behaves — through candlesticks, patterns, and key levels.
Every price movement represents a tug-of-war between buyers (bulls) and sellers (bears). Understanding this battle helps traders anticipate what might happen next.
a) Candlestick Psychology
Each candlestick shows the open, high, low, and close of a period. But beyond that, it reveals the emotion behind the move:
Bullish Candles: Buyers in control; close higher than open.
Bearish Candles: Sellers dominate; close lower than open.
Doji Candles: Indecision; open and close nearly the same.
Learning to interpret candle shapes and their context gives traders deep insights into potential reversals or continuations.
b) Key Price Action Patterns
Certain formations consistently appear in charts and indicate likely market behavior:
Pin Bar (Hammer/Shooting Star):
Long wick shows rejection of higher or lower prices — strong reversal signal.
Engulfing Pattern:
A large candle completely engulfs the previous one, showing a strong shift in control.
Inside Bar:
Represents market consolidation before a breakout — often a continuation pattern.
Breakout and Retest:
After breaking a key level, price often returns to “retest” it before continuing — a favorite entry point for professionals.
c) Market Structure in Price Action
Understanding structure means recognizing how price transitions between phases:
Accumulation: Smart money builds positions quietly.
Markup: Strong uptrend begins as more participants join.
Distribution: Smart money exits, price slows down.
Markdown: Trend reverses; prices fall as selling accelerates.
This structure repeats across all markets and timeframes — mastering it is the foundation of consistent profitability.
4. Combining Technical Analysis and Price Action
While technical analysis provides tools, price action gives context. A professional trader combines both approaches for precision and confidence.
For instance:
Use support and resistance to mark key zones.
Wait for price action confirmation (like a pin bar or engulfing pattern).
Confirm with volume or trend indicators.
Execute trade with defined risk-reward and stop-loss placement.
This systematic blend helps traders avoid emotional decisions and react logically to market data.
5. Risk Management: The Core of Mastery
No matter how accurate the analysis, losses are part of trading. The real mastery lies not in avoiding losses but in managing risk effectively.
Key risk management principles include:
Position Sizing: Never risk more than 1–2% of total capital per trade.
Stop-Loss Orders: Always define the level at which a trade is invalidated.
Risk-Reward Ratio: Aim for at least 1:2 — potential profit should be double the risk.
Trade Journal: Track every trade to identify strengths and weaknesses.
Technical mastery without risk control leads to eventual losses. Consistent traders understand that preserving capital is their first priority.
6. Trading Psychology and Discipline
Beyond charts and setups, success in trading depends heavily on mindset. Technical knowledge may get you started, but psychological discipline keeps you profitable.
Patience: Wait for high-probability setups; avoid overtrading.
Emotional Control: Don’t let fear or greed influence decisions.
Adaptability: Markets evolve — stay flexible.
Confidence through Practice: Backtesting and journaling build trust in your strategy.
Mastering technical analysis is not about predicting every move — it’s about responding intelligently to what the market shows.
7. Multi-Timeframe Analysis
Professional traders analyze multiple timeframes to align short-term setups with long-term trends.
Higher Timeframes (Daily, Weekly): Identify major trend and key zones.
Lower Timeframes (15m, 1h): Find precise entries and exits.
This “top-down approach” ensures trades are aligned with the overall market direction, reducing false signals.
8. Volume Profile & Market Structure Integration
Advanced traders integrate Volume Profile and Market Structure with price action for higher accuracy:
Volume Profile: Shows traded volume at different price levels — highlighting areas of strong institutional interest.
High Volume Nodes (HVN): Areas of heavy activity; act as support/resistance.
Low Volume Nodes (LVN): Thin zones — price tends to move quickly through them.
Combining these with price action helps identify where the next big move might begin.
9. Building a Complete Trading System
To truly master technical analysis and price action, a trader must build a personal trading system — a set of rules combining analysis, execution, and psychology.
A robust system should include:
Market Selection: Which instruments to trade (stocks, forex, commodities).
Setup Criteria: Clear patterns or signals to look for.
Entry Triggers: What must happen before taking a trade.
Stop-Loss & Targets: Defined before entering.
Risk Management Rules: Position sizing and capital exposure.
Review Process: Post-trade analysis to refine performance.
Once developed, this system should be followed with discipline and consistency. The goal is to remove emotion and rely on process — just like a professional.
10. Continuous Learning and Adaptation
Markets are dynamic, and strategies that work today may not always work tomorrow. True mastery requires continuous learning — adapting to changing volatility, economic shifts, and new tools.
Traders can enhance skills by:
Reviewing trades regularly.
Studying institutional order flow concepts.
Learning about liquidity traps, false breakouts, and market manipulation.
Using simulation tools for backtesting.
The more you study the market, the clearer its rhythm becomes.
Conclusion
Technical Analysis and Price Action Mastery is not about memorizing patterns or predicting the future — it’s about understanding the underlying forces that move markets and positioning yourself in harmony with them.
Every candle, every level, and every breakout represents human emotion in action. When you learn to read this emotion through structure, context, and momentum, you begin to trade with confidence — not guesswork.
Ultimately, the mastery of technical analysis and price action is a journey of discipline, patience, and deep observation. It turns trading from speculation into a structured profession — where each decision is backed by logic, not luck.
In the hands of a patient, risk-aware trader, these tools become a map to consistent profitability and long-term success in financial markets.

Algorithmic & Quantitative TradingIntroduction
Over the past two decades, the global financial markets have transformed from bustling trading floors filled with human brokers shouting orders to high-speed electronic exchanges dominated by algorithms. This shift represents one of the most profound technological revolutions in finance — the rise of Algorithmic and Quantitative Trading (AQT).
These two closely related fields leverage mathematics, statistics, and computing to make trading more efficient, data-driven, and disciplined. They have not only changed how trades are executed but also how investment decisions are made. Understanding algorithmic and quantitative trading is therefore essential for grasping how modern financial markets truly function today.
1. Understanding Algorithmic Trading
1.1 Definition and Core Concept
Algorithmic trading (Algo trading) refers to the use of computer algorithms — step-by-step sets of coded instructions — to execute trades automatically based on pre-defined criteria such as price, timing, volume, or market conditions.
In simpler terms, instead of a human clicking a buy or sell button, a computer program makes the decision and executes it faster than any human could.
An algorithm can be designed to:
Identify trading opportunities,
Execute trades at optimal prices,
Manage risk through stop-loss or profit-taking rules, and
Adjust its strategy dynamically as the market evolves.
The central goal of algorithmic trading is to eliminate human emotion and delay from the trading process, thereby increasing speed, precision, and consistency.
2. The Evolution of Algorithmic Trading
Algorithmic trading began in the 1970s with electronic trading systems like NASDAQ. The real explosion came in the 1990s and early 2000s with advances in computing power and connectivity. By 2010, a significant portion of trading volume in developed markets such as the U.S. and Europe was algorithmic.
Today, algorithms are responsible for over 70% of equity trades in the U.S. and an increasing share of trades in emerging markets like India. The evolution has moved through stages:
Simple Execution Algorithms – Used to break large institutional orders into smaller parts to minimize market impact.
Statistical Arbitrage and Pairs Trading – Exploiting small price inefficiencies between related securities.
High-Frequency Trading (HFT) – Using ultra-fast systems to exploit millisecond-level market movements.
AI-Driven and Machine Learning Algorithms – Continuously adapting strategies using live market data.
3. How Algorithmic Trading Works
Algorithmic trading operates through a set of coded rules implemented in trading software. A basic algorithm typically includes the following components:
3.1 Strategy Definition
This is where the logic of the trade is specified. For instance:
Buy 100 shares of XYZ if the 50-day moving average crosses above the 200-day moving average (a “Golden Cross”).
Sell a stock if its price falls 2% below the previous day’s close.
3.2 Market Data Input
Algorithms consume real-time and historical data — prices, volumes, order book depth, and even news sentiment — to make decisions.
3.3 Signal Generation
Based on input data, the algorithm identifies a trading opportunity, generating a buy or sell signal.
3.4 Order Execution
The algorithm automatically places orders in the market, sometimes splitting large orders into smaller “child orders” to minimize price impact.
3.5 Risk Management
Modern algorithms include risk controls, such as maximum position size, stop losses, or exposure limits, to prevent major losses.
3.6 Performance Monitoring
Traders or institutions continuously monitor the algorithm’s performance and make parameter adjustments when required.
4. Understanding Quantitative Trading
4.1 Definition
Quantitative trading (Quant trading) focuses on using mathematical and statistical models to identify profitable trading opportunities. While algorithmic trading automates execution, quantitative trading focuses on the design and development of the trading strategy itself.
In essence:
Quantitative Trading = The science of building strategies using data and math.
Algorithmic Trading = The engineering of executing those strategies efficiently.
Most modern trading operations combine both — a quant model discovers the opportunity, and an algorithm executes it automatically.
5. The Building Blocks of Quantitative Trading
5.1 Data Collection and Cleaning
Quantitative trading begins with data — historical prices, volume, fundamentals, economic indicators, sentiment data, etc. This data must be cleaned, normalized, and structured for analysis.
5.2 Hypothesis Development
A quant trader might form a hypothesis such as “small-cap stocks outperform large-caps after earnings surprises.” The model then tests this hypothesis statistically.
5.3 Backtesting
The strategy is simulated on historical data to measure performance, risk, and robustness. Metrics such as Sharpe Ratio, drawdown, and win rate are used to evaluate success.
5.4 Optimization
Parameters are fine-tuned to improve results without overfitting (a common trap where a model performs well historically but fails in live markets).
5.5 Execution and Automation
Once validated, the strategy is deployed through algorithmic systems for live execution.
6. Common Quantitative Strategies
Quantitative trading covers a wide range of strategies, including:
Statistical Arbitrage – Exploiting temporary mispricings between correlated assets.
Mean Reversion – Betting that prices will return to their long-term average after deviations.
Momentum Trading – Riding the wave of stocks showing strong price trends.
Market Making – Providing liquidity by continuously quoting buy and sell prices.
Event-Driven Strategies – Trading based on corporate actions like earnings announcements or mergers.
Machine Learning Models – Using AI to identify hidden patterns or predict price movements.
7. Role of Technology in Algorithmic and Quantitative Trading
Technology is the backbone of AQT.
Key technological pillars include:
7.1 High-Speed Connectivity
Millisecond-level latency can determine profitability in markets dominated by speed.
7.2 Co-location and Proximity Hosting
Firms place their trading servers physically close to exchange servers to minimize transmission delay.
7.3 Advanced Programming Languages
Languages like Python, C++, and Java are used to develop models and execution systems.
7.4 Big Data and Cloud Computing
Handling terabytes of market data requires scalable computing environments.
7.5 Artificial Intelligence and Machine Learning
AI systems can continuously learn from new data, adapt to market changes, and improve their predictive accuracy.
8. Advantages of Algorithmic & Quantitative Trading
8.1 Speed and Efficiency
Algorithms execute trades in microseconds, ensuring optimal entry and exit points.
8.2 Emotion-Free Decisions
Trading based on predefined rules eliminates emotional biases such as fear or greed.
8.3 Better Execution and Reduced Costs
Execution algorithms reduce slippage (difference between expected and actual trade prices) and transaction costs.
8.4 Backtesting and Strategy Validation
Traders can test strategies on historical data before risking capital.
8.5 Diversification
Algorithms can manage multiple strategies and asset classes simultaneously, reducing overall portfolio risk.
9. Challenges and Risks
Despite its sophistication, algorithmic and quantitative trading comes with notable risks:
9.1 Overfitting and Model Risk
A strategy that performs brilliantly on past data might fail miserably in live markets if it’s over-optimized.
9.2 Market Volatility Amplification
Algorithms can sometimes intensify volatility, as seen during events like the 2010 “Flash Crash.”
9.3 Technical Failures
Software glitches, connectivity losses, or coding errors can lead to massive financial losses.
9.4 Competition and Saturation
As more firms adopt similar strategies, profit opportunities diminish — leading to a “race to the bottom.”
9.5 Regulatory and Ethical Issues
Market regulators constantly monitor algorithmic activity to prevent manipulation such as spoofing or layering.
10. Regulation of Algorithmic Trading
Globally, regulators have imposed frameworks to ensure transparency and fairness.
For example:
U.S. SEC & FINRA regulate algorithmic practices under strict risk control requirements.
MiFID II in Europe demands algorithmic systems undergo stress testing and registration.
SEBI (India) has guidelines requiring brokers to seek prior approval before deploying any algo strategy and maintain strong risk controls.
The goal is to ensure that the speed advantage of technology does not compromise market integrity.
11. The Role of Data Science and Machine Learning
The next frontier in AQT lies in Machine Learning (ML) and Artificial Intelligence (AI). These technologies go beyond rule-based systems by allowing algorithms to learn from experience.
For instance:
Neural Networks can predict short-term price direction based on complex non-linear relationships.
Natural Language Processing (NLP) can analyze news headlines or social media sentiment to anticipate market reactions.
Reinforcement Learning allows algorithms to evolve and optimize trading behavior through trial and feedback.
The integration of ML transforms traditional models into adaptive, self-learning systems capable of functioning even in rapidly changing environments.
12. The Human Element in a Quant World
Despite the automation, humans remain central to algorithmic and quantitative trading.
Quantitative analysts (“quants”) design and validate models, while risk managers ensure systems operate within limits.
Moreover, intuition and judgment still matter — particularly in interpreting data, handling market anomalies, or adjusting strategies during unexpected events like geopolitical crises or pandemics.
Thus, the future of AQT is not about replacing humans but enhancing their decision-making power through technology.
13. Future Trends in Algorithmic & Quantitative Trading
The future of AQT is shaped by several emerging trends:
AI-Driven Adaptive Systems: Fully autonomous algorithms capable of evolving in real time.
Quantum Computing: Expected to dramatically enhance processing speeds and optimization capacity.
Blockchain Integration: Smart contracts could enable decentralized, algorithmic trading platforms.
Retail Algorithmic Access: Platforms like Zerodha’s Streak or Interactive Brokers’ APIs are democratizing algo trading for retail investors.
Sustainability and ESG Integration: Algorithms now factor in environmental and social data to align with ethical investing trends.
These innovations will make markets more efficient but also more complex, demanding greater regulatory oversight and risk awareness.
Conclusion
Algorithmic and Quantitative Trading represent the perfect blend of mathematics, technology, and finance. Together, they have revolutionized the way markets operate — making trading faster, more efficient, and more data-driven than ever before.
While algorithms dominate execution, quantitative models drive strategy formulation. The synergy between them defines modern finance’s competitive edge. Yet, success in this domain requires not just technical skill but also rigorous risk control, continuous learning, and a deep understanding of market behavior.
As we look ahead, the boundary between human intelligence and artificial intelligence in markets will continue to blur. The future trader will be part mathematician, part programmer, and part strategist — operating in a world where data is the new currency and algorithms are the engines that power the markets of tomorrow.

Part 2 Ride The Big Moves Advantages of Option Trading
Option trading offers several benefits:
Leverage: Small premiums control large positions, magnifying potential returns.
Flexibility: Options can be used for income generation, speculation, or hedging.
Limited Risk for Buyers: The maximum loss for option buyers is limited to the premium paid.
Diverse Strategies: Traders can design complex setups for any market condition.
Portfolio Protection: Helps reduce downside risks without liquidating assets.
Because of these advantages, options have become integral to both institutional and retail trading strategies worldwide.

Part 1 Ride The Big Moves Role of Options in Hedging and Speculation
Options serve two primary purposes—hedging and speculation.
Hedging: Investors use options to protect their portfolios from adverse price movements. For example, a fund manager expecting a market downturn might buy put options on an index to limit potential losses.
Speculation: Traders use options to bet on the direction of price movements with relatively low capital compared to buying stocks outright. For instance, buying a call option allows participation in a stock’s upside potential without investing the full stock price.
Thus, options balance the needs of both conservative and aggressive market participants.

Part 1 Intraday Master ClassParticipants in Option Markets
There are generally four participants in an options market:
Buyers of Call Options – Expect prices to rise.
Sellers (Writers) of Call Options – Expect prices to remain stable or fall.
Buyers of Put Options – Expect prices to fall.
Sellers (Writers) of Put Options – Expect prices to remain stable or rise.
Buyers pay the premium and hold limited risk but unlimited profit potential. Sellers receive the premium but bear potentially unlimited risk, especially in the case of uncovered or “naked” positions. This difference in risk profile defines the strategic balance of the options market.

The New Era of India’s Market BoomIntroduction: India’s Economic Renaissance
India’s financial markets are witnessing a remarkable transformation, marking the beginning of a new era of growth, resilience, and opportunity. From a developing economy once dependent on global cues, India has evolved into one of the world’s most attractive investment destinations. The “New Era” of India’s market boom is not just about record-breaking indices or surging foreign investments; it reflects the nation’s structural strength, demographic power, and digital transformation driving long-term wealth creation.
This boom represents the confluence of policy reforms, entrepreneurial innovation, and investor confidence — a cycle that has redefined how both domestic and international participants view India’s economic potential.
1. The Evolution of India’s Market Landscape
India’s journey from a closed, regulated economy in the 1980s to one of the most vibrant capital markets globally has been extraordinary. Liberalization in 1991 opened the doors to foreign investment, privatization, and global integration. Over the last decade, successive reforms — such as GST, the Insolvency and Bankruptcy Code (IBC), and Make in India — have further streamlined business operations and enhanced transparency.
The equity markets have mirrored this evolution. The BSE Sensex and NSE Nifty have grown exponentially, attracting both institutional and retail investors. Market participation has broadened beyond major cities, with millions of first-time investors joining via digital platforms. India’s financial system now stands on robust pillars of technology, regulation, and liquidity — key ingredients of sustainable growth.
2. Structural Drivers Behind the Boom
Several underlying factors have fueled India’s market resurgence. These are not temporary catalysts but foundational shifts that ensure longevity in growth momentum.
a. Demographic Dividend
India’s young population — with a median age of just 28 — offers a unique consumption and productivity advantage. A growing workforce means more income, savings, and investments, leading to strong domestic demand. As the middle class expands, so does spending on housing, automobiles, insurance, and financial products — creating ripple effects across sectors.
b. Policy Reforms and Governance
Government reforms have created an ecosystem conducive to business expansion and capital formation. Initiatives like “Digital India,” “Atmanirbhar Bharat,” and “Production-Linked Incentive (PLI)” schemes have modernized industries, encouraged manufacturing, and boosted exports. Moreover, greater emphasis on infrastructure spending and fiscal prudence has improved investor trust.
c. Technological Advancement and Fintech Revolution
India’s fintech and digital payment ecosystem is among the most advanced in the world. With platforms like UPI, IndiaStack, and online brokerage systems, access to financial markets has become seamless. This democratization of investing has brought millions of retail investors into the equity and mutual fund space, creating a stable and long-term domestic investor base.
d. Robust Corporate Earnings
Corporate India has shown consistent earnings growth post-pandemic, supported by strong demand recovery, operational efficiency, and deleveraged balance sheets. Key sectors like banking, infrastructure, IT, and energy have recorded record profits, signaling economic health and boosting market confidence.
3. Domestic Liquidity: The Silent Market Force
One of the most powerful trends driving the current market boom is domestic liquidity. Traditionally, India’s markets were heavily influenced by Foreign Institutional Investors (FIIs). However, today, Domestic Institutional Investors (DIIs) and retail investors have become a counterbalancing force.
Mutual funds, insurance companies, and retail investors now account for a large share of market participation. The Systematic Investment Plan (SIP) revolution has created a steady inflow of funds into equities every month, insulating markets from global volatility. As of 2025, India records monthly SIP inflows exceeding ₹20,000 crore — an unprecedented level that showcases the maturity and confidence of domestic investors.
4. India in the Global Investment Map
Global investors increasingly see India as a structural growth story rather than a cyclical opportunity. Amid global economic uncertainty, geopolitical tensions, and slowing growth in China, India stands out as a stable and promising alternative.
Multinational corporations are shifting their supply chains towards India, recognizing it as a key hub for manufacturing, software services, and renewable energy. According to global reports, India is projected to contribute nearly 15% of global GDP growth over the next decade — a testament to its rising influence.
India’s inclusion in global bond indices, strong foreign exchange reserves, and stable macroeconomic indicators further enhance its attractiveness. The country’s financial depth and transparency have reached levels where foreign investors view it as a strategic, not speculative, bet.
5. Sectoral Catalysts Powering the Boom
The market rally is not uniform; it’s powered by diverse sectors that reflect India’s structural evolution.
a. Banking and Financial Services
Banks and NBFCs have emerged stronger after years of consolidation and balance sheet clean-up. With credit growth exceeding 15% annually, financial institutions are well-positioned to drive economic expansion. Digital banking and fintech integration have enhanced efficiency and accessibility.
b. Infrastructure and Real Estate
The government’s focus on roads, logistics, and housing has triggered a boom in infrastructure-related stocks. Real estate, once stagnant, is witnessing a revival fueled by rising incomes, affordable loans, and urbanization. The “Housing for All” and Smart City initiatives continue to boost construction demand.
c. Information Technology and Digital Transformation
Indian IT companies remain global leaders in software services, but the narrative is expanding toward digital transformation, cloud computing, AI, and cybersecurity. The export-driven IT sector provides stability, while emerging startups add dynamism to the digital economy.
d. Manufacturing and Make in India
The PLI scheme has revitalized domestic manufacturing across electronics, automobiles, and defense. India is becoming a preferred base for smartphone assembly, electric vehicle production, and renewable energy components — reducing dependence on imports and creating jobs.
e. Energy and Sustainability
India’s ambitious renewable energy goals — including its target of achieving 500 GW of renewable capacity by 2030 — have created investment opportunities in solar, wind, and green hydrogen. Energy transition is now a central pillar of India’s economic strategy.
6. The Rise of Retail Investors
Perhaps the most defining feature of this new era is the participation of retail investors. Over 13 crore Demat accounts in India signify a paradigm shift in how citizens perceive wealth creation. Digital platforms, financial literacy drives, and social media education have made investing accessible to all.
Retail investors are no longer passive participants. They follow market data, understand technical trends, and use tools like volume profile and market structure analysis to make informed decisions. This behavioral shift has made the market more resilient and diversified.
7. Market Valuations and Sustainability
While valuations in some sectors have stretched due to optimism, the long-term sustainability of India’s market boom lies in its fundamentals. Corporate earnings, policy support, and demographic trends back this growth. Unlike speculative bubbles, this phase is characterized by real economic expansion and disciplined monetary management.
The Reserve Bank of India (RBI) has maintained a balanced stance, ensuring inflation remains within target while supporting credit growth. Fiscal discipline and a focus on infrastructure spending further strengthen the macroeconomic framework.
However, investors must remain cautious of short-term corrections. Market booms often invite volatility, but corrections are natural and healthy in a long-term growth cycle. The key lies in diversification and maintaining a long-term investment perspective.
8. The Digital Edge: A Catalyst for Market Expansion
India’s digital economy — valued at over $200 billion and growing rapidly — acts as a backbone for its market expansion. Online trading apps, mobile banking, and AI-driven analytics have revolutionized how people invest. Data transparency and real-time access to markets have reduced barriers and increased participation.
Artificial intelligence and machine learning tools are now helping investors analyze sentiment, predict price movements, and optimize portfolios — reflecting how technology is reshaping traditional finance. This digital momentum is expected to continue driving market depth and efficiency.
9. Challenges and Global Dependencies
While India’s market boom looks unstoppable, it is not without challenges. Global factors such as oil prices, geopolitical tensions, and currency fluctuations can influence sentiment. A slowdown in exports or global demand may temporarily affect sectors like IT and manufacturing.
Domestically, maintaining inflation control, ensuring job creation, and sustaining credit discipline are crucial. Regulatory oversight will play a vital role in protecting investors and preserving market integrity amid rapid expansion.
10. The Road Ahead: A Decade of Transformation
India’s next decade promises to be transformative. With a GDP growth trajectory expected to average 6.5–7%, India could become the third-largest economy in the world by 2030. This economic ascent will be mirrored in its capital markets — with more IPOs, deeper derivatives markets, and greater global integration.
The ongoing listing of startups and SMEs also reflects India’s entrepreneurial vibrancy. As innovation meets capital, the ecosystem will nurture global-scale companies across tech, renewable energy, and financial services.
Conclusion: The Dawn of a New Financial Future
The new era of India’s market boom is not just a cyclical uptrend — it’s a structural evolution of an economy maturing into a global powerhouse. Driven by reforms, demographics, technology, and investor confidence, India’s markets represent a story of resilience and renewal.
This transformation signifies more than rising indices — it symbolizes India’s emergence as a self-reliant, investment-driven, and globally respected economy. As the world rebalances its economic priorities, India’s capital markets stand tall — not as a follower, but as a leader shaping the next chapter of global financial history.

What Are Cryptocurrencies? A Simplified Overview1. The Basic Definition: What Is a Cryptocurrency?
A cryptocurrency is a digital or virtual form of money that uses cryptography (a method of securing information) to ensure secure transactions. Unlike traditional currencies such as the rupee, dollar, or euro — which are issued and controlled by governments or central banks — cryptocurrencies operate on decentralized networks, usually based on blockchain technology.
This means no single authority, like a bank or government, controls cryptocurrency. Instead, users themselves verify and record transactions through computer networks spread across the globe.
In short: Cryptocurrency = Digital Money + Cryptography + Decentralization
2. The Birth of Cryptocurrency: A Revolution in Digital Money
The idea of digital money isn’t entirely new. Efforts to create online currencies started as early as the 1980s and 1990s. But these early systems failed because they depended on a central authority, which made them vulnerable to fraud and manipulation.
The real breakthrough came in 2009, when a mysterious individual (or group) under the name Satoshi Nakamoto introduced Bitcoin — the first successful decentralized cryptocurrency.
Bitcoin solved two major problems that earlier attempts couldn’t:
Double-spending problem – ensuring digital money couldn’t be copied or spent twice.
Trust problem – enabling users to transact without needing to trust a middleman or central authority.
The launch of Bitcoin marked the beginning of a new financial era — one where money could move freely and securely on the internet.
3. How Cryptocurrencies Work
At the heart of every cryptocurrency lies a technology called the blockchain.
Think of a blockchain as a public digital ledger — a kind of record book that’s accessible to everyone but can’t be changed or tampered with.
Here’s how it works step by step:
Transaction Creation:
When someone sends cryptocurrency to another person (say, sending Bitcoin to a friend), that transaction is broadcast to a network of computers.
Verification:
These computers (called nodes) verify the transaction details — ensuring the sender actually has enough funds and that there’s no duplication.
Block Formation:
Verified transactions are grouped together into a “block”.
Blockchain Addition:
Once verified, this block is added to the existing chain of previous transactions — forming a continuous and secure “blockchain”.
Immutability:
Once a block is added, it cannot be altered. This makes blockchain systems highly secure and transparent.
Every participant in the network can view the transactions, but nobody can modify them. This creates a trustless system, meaning people don’t need to trust each other — they only need to trust the system’s mathematics and cryptography.
4. Mining: The Backbone of Cryptocurrency Creation
Most cryptocurrencies (like Bitcoin) are “mined” rather than printed. Mining refers to the process of using powerful computers to solve complex mathematical problems that validate transactions and create new coins.
When miners solve these problems, they add new blocks to the blockchain.
As a reward for their effort and energy, they receive new cryptocurrency coins.
This process not only issues new coins into circulation but also keeps the network secure and decentralized.
However, mining requires significant computing power and electricity. As a result, it has raised environmental concerns, leading newer cryptocurrencies to adopt more energy-efficient methods such as Proof of Stake (PoS) instead of Proof of Work (PoW) used by Bitcoin.
5. Types of Cryptocurrencies
While Bitcoin was the pioneer, thousands of other cryptocurrencies have since emerged, each with unique purposes and features. Some popular examples include:
Bitcoin (BTC):
The original and most valuable cryptocurrency. Often referred to as “digital gold”.
Ethereum (ETH):
Introduced the concept of smart contracts — programmable digital agreements that execute automatically when conditions are met.
Ripple (XRP):
Designed to make international payments faster and cheaper, especially for banks and financial institutions.
Litecoin (LTC):
A lighter, faster version of Bitcoin, often used for smaller transactions.
Cardano (ADA) and Solana (SOL):
Focus on scalability and energy efficiency for decentralized applications (DApps).
Stablecoins (like USDT, USDC):
These are cryptocurrencies pegged to stable assets like the US dollar to reduce volatility.
Meme coins (like Dogecoin, Shiba Inu):
Created for fun or community engagement, though some gained massive popularity.
The cryptocurrency ecosystem continues to expand, with coins serving purposes from gaming and supply chain management to healthcare and finance.
6. Why Are Cryptocurrencies So Popular?
Several reasons explain why cryptocurrencies have gained such massive popularity worldwide:
Decentralization and Independence:
People are drawn to the idea of money that isn’t controlled by banks or governments.
High Return Potential:
Early investors in Bitcoin and other cryptocurrencies saw extraordinary gains, inspiring millions to invest.
Transparency and Security:
Blockchain records are public and cannot be altered, which increases trust.
Borderless Transactions:
You can send money across countries instantly, with minimal fees and no need for conversion.
Financial Inclusion:
Cryptocurrencies can provide banking access to people in remote areas who lack traditional financial infrastructure.
Technological Innovation:
Blockchain technology opened the door for smart contracts, NFTs, and decentralized finance (DeFi), reshaping industries.
7. Risks and Challenges of Cryptocurrencies
Despite their promise, cryptocurrencies also come with significant challenges and risks:
Volatility:
Prices of cryptocurrencies can fluctuate dramatically. Bitcoin, for example, can gain or lose thousands of dollars in a single day.
Regulatory Uncertainty:
Governments worldwide are still developing laws to regulate crypto trading, taxation, and consumer protection.
Security Risks:
While blockchains are secure, cryptocurrency exchanges and wallets can be hacked if users are careless.
Environmental Concerns:
Mining consumes large amounts of electricity, raising questions about sustainability.
Lack of Understanding:
Many people invest without fully understanding the technology, leading to poor financial decisions.
Scams and Fraud:
Fake coins, Ponzi schemes, and rug pulls have caused investors to lose billions globally.
These issues show that while crypto offers freedom and innovation, it also demands responsibility, education, and regulation.
8. The Role of Blockchain: The Foundation of Crypto
Blockchain is the real hero behind cryptocurrencies. It ensures transparency, security, and decentralization.
Each block in the blockchain contains:
A list of transactions
A timestamp
A unique code (hash)
A reference to the previous block
This interconnected system prevents tampering and creates a permanent record of all transactions.
Beyond cryptocurrencies, blockchain is now being adopted in industries like:
Banking (for fast settlements)
Supply Chain Management (to track goods)
Healthcare (for secure patient data)
Voting Systems (to prevent fraud)
Real Estate (for transparent ownership records)
This shows that blockchain’s potential goes far beyond digital money — it can revolutionize how trust and information are managed in society.
9. The Legal and Regulatory Landscape
Different countries view cryptocurrencies differently:
El Salvador became the first nation to adopt Bitcoin as legal tender in 2021.
India, the U.S., and the European Union allow crypto trading but are working on stricter rules for taxation and anti-money laundering.
Some countries like China have banned crypto transactions altogether.
In India, the government does not recognize crypto as legal tender but allows its trading and taxes it at 30% on profits, similar to gambling or speculative income. This reflects a cautious but open approach.
Over time, global regulation is expected to bring more clarity, investor protection, and institutional participation in the crypto market.
10. The Future of Cryptocurrencies
The future of cryptocurrencies is still being written. Some believe crypto will replace traditional banking systems, while others see it as a speculative bubble. However, one thing is certain — the underlying technology is here to stay.
Here are a few emerging trends shaping the future:
Central Bank Digital Currencies (CBDCs):
Many countries are launching their own digital versions of national currencies (like India’s Digital Rupee) to combine the benefits of crypto with government control.
Decentralized Finance (DeFi):
Platforms allowing people to lend, borrow, and trade without banks are gaining massive popularity.
Tokenization of Assets:
Real-world assets like real estate, gold, or art are being represented digitally through blockchain tokens.
Mainstream Adoption:
Companies like Tesla, PayPal, and Visa are integrating cryptocurrencies into their payment systems.
Regulated Crypto Ecosystems:
With better laws and security, institutional investors (like mutual funds and pension funds) are entering the market, bringing legitimacy and stability.
Despite challenges, crypto continues to evolve, pushing the boundaries of how we define money and value.
11. The Human Side: A Shift in Financial Power
Beyond technology, cryptocurrencies represent a philosophical and social shift.
For centuries, financial systems have been controlled by powerful intermediaries — banks, governments, and corporations. Crypto challenges this by empowering individuals directly.
It promotes:
Financial freedom
Transparency
Equal access
Innovation through collaboration
In this sense, cryptocurrencies are not just a new asset class — they symbolize a movement toward democratizing finance.
12. Conclusion: The Evolution of Money
Cryptocurrencies began as a simple idea — to create digital money independent of centralized control. In just over a decade, they have transformed into a global financial revolution influencing technology, policy, and economics.
They are more than an investment trend; they represent the next evolution of how humans exchange value, trust systems, and manage wealth. Yet, as with all powerful innovations, they require understanding, caution, and responsibility.
As the world continues to embrace digital transformation, cryptocurrencies will likely play an essential role — whether as alternative investments, technology enablers, or the foundation of the next-generation financial system.
Arbitrage as the Invisible Hand of Market BalanceUnderstanding the Concept of Arbitrage and Why Cross-Market Opportunities Exist.
Introduction: The Timeless Appeal of Arbitrage
In the world of finance and trading, arbitrage is one of the oldest and most reliable concepts for making profits with minimal risk. The idea is simple yet powerful — taking advantage of price discrepancies for the same asset across different markets or instruments. Arbitrageurs act as the balancing agents of the financial ecosystem. By exploiting small differences in prices, they help maintain market efficiency and price stability.
While it might sound straightforward — buy low here, sell high there — in practice, arbitrage is an intricate process driven by technology, timing, and global financial linkages. Cross-market arbitrage, in particular, shows how interconnected today’s world is, where an event in New York or London can instantly impact prices in Mumbai or Singapore.
Let’s delve deeper into what arbitrage means, its types, and why cross-market opportunities continue to exist despite the rise of advanced trading systems and AI-driven algorithms.
1. What is Arbitrage?
Arbitrage is the practice of simultaneously buying and selling an asset in different markets to profit from the difference in price. The key here is simultaneity — both transactions occur at the same time to lock in a risk-free profit.
In essence, arbitrage ensures that the law of one price holds true: an identical asset should have the same price across all markets. When this is not the case, arbitrageurs step in, quickly exploiting the gap until prices converge again.
Example:
Suppose shares of Company X trade at ₹1,000 on the National Stock Exchange (NSE) and ₹1,005 on the Bombay Stock Exchange (BSE). A trader can buy on NSE and sell on BSE simultaneously, earning ₹5 per share in profit before transaction costs. While this seems small, when executed at scale with automation, such trades can generate significant returns.
2. The Core Principle: The Law of One Price
At the heart of arbitrage lies the law of one price, which states that in an efficient market, identical assets should trade for the same price when exchange rates, transaction costs, and other frictions are considered.
If gold is priced at ₹6,000 per gram in India and $70 per gram in the U.S., and the exchange rate is ₹85 per dollar, then ₹6,000/₹85 = $70.5 per gram — nearly identical. Any meaningful difference would invite traders to move gold (physically or virtually) from one market to another until prices align.
However, real-world markets aren’t always perfectly efficient, which gives rise to temporary price imbalances — and hence, arbitrage opportunities.
3. Types of Arbitrage in Financial Markets
Arbitrage comes in several forms, each suited to different asset classes and market structures. Below are the most common:
a) Spatial (Geographical) Arbitrage
This is the classic form of arbitrage where an asset is bought in one location and sold in another. Common examples include commodities, currencies, or stocks listed on multiple exchanges.
b) Temporal Arbitrage
This occurs when traders exploit price differences across time periods. For instance, buying a stock today and selling a futures contract for delivery next month when the future price is higher.
c) Statistical Arbitrage
Here, traders use quantitative models to identify mispriced securities based on historical relationships. It’s not purely risk-free but relies on probability and mean reversion.
d) Triangular Arbitrage (Currency Markets)
In the forex market, triangular arbitrage involves exploiting discrepancies among three currency pairs. For instance, if EUR/USD, USD/GBP, and EUR/GBP don’t align mathematically, a trader can profit by cycling through the three conversions.
e) Merger or Risk Arbitrage
This form occurs during corporate events such as mergers or acquisitions. Traders speculate on price movements between the target company’s current price and the offer price.
f) Cross-Market Arbitrage
This involves exploiting price differences for the same or related assets across different markets or asset classes — such as spot and futures, or equity and derivatives markets.
Cross-market arbitrage is increasingly important in today’s globalized, interconnected trading landscape.
4. Understanding Cross-Market Arbitrage
Cross-market arbitrage happens when traders take advantage of price differences for the same security, index, or commodity across multiple exchanges or platforms — often across borders.
For example, if Reliance Industries trades at ₹2,500 on the NSE but ₹2,507 on the Singapore Exchange (SGX) as a derivative instrument, an arbitrageur could buy the cheaper one and sell the higher-priced version, profiting from the spread until prices converge.
This form of arbitrage often occurs between:
Spot and futures markets (cash-and-carry arbitrage)
Domestic and international exchanges
Equity and derivative markets
Cryptocurrency exchanges across countries
The profit margins may be narrow, but in high-volume or algorithmic environments, these trades can yield consistent gains.
5. Why Do Cross-Market Opportunities Exist?
If markets are efficient, one might wonder — why do such price differences exist at all? Theoretically, arbitrage should eliminate inefficiencies quickly. However, several real-world frictions allow opportunities to emerge and persist, at least temporarily.
Let’s explore the main reasons:
a) Market Segmentation
Not all investors have access to all markets. Regulatory barriers, currency restrictions, or exchange-specific membership requirements can create segmented markets, allowing the same asset to trade at different prices.
For instance, Chinese A-shares often trade at higher valuations on mainland exchanges compared to Hong Kong-listed H-shares of the same company due to limited investor access in mainland markets.
b) Currency Exchange Rates
When assets are priced in different currencies, exchange rate movements can create temporary mispricing. Even slight discrepancies in forex rates can lead to arbitrage between markets.
c) Liquidity Differences
Some markets are more liquid than others. Lower liquidity can lead to price delays or inefficiencies, allowing faster traders to exploit differences between high-liquidity and low-liquidity venues.
d) Information Asymmetry
Not all markets react to information simultaneously. If news reaches one market faster, prices there adjust sooner, creating short-lived arbitrage opportunities elsewhere.
e) Transaction Delays and Infrastructure Gaps
Even in an era of high-frequency trading, minor lags in data transmission or order execution can result in tiny but exploitable differences between exchanges.
f) Demand and Supply Imbalances
Cross-market demand differences — due to institutional orders, fund flows, or hedging needs — can push prices temporarily away from equilibrium, creating room for arbitrage.
g) Regulatory and Tax Factors
Different tax structures, capital controls, or transaction charges across countries can cause effective price differences for the same asset.
6. How Arbitrage Helps Maintain Market Efficiency
Arbitrage isn’t just about making profits — it plays a crucial stabilizing role in the global financial system.
Whenever arbitrageurs exploit price gaps, their actions force prices back toward equilibrium. For example, buying in the cheaper market increases demand (raising the price) while selling in the expensive market increases supply (lowering the price). This self-correcting mechanism ensures that prices remain aligned across regions and instruments.
In this sense, arbitrage acts as a natural regulator of market inefficiencies, contributing to:
Price uniformity
Efficient capital allocation
Market liquidity
Reduced volatility
7. The Role of Technology in Arbitrage
In earlier decades, arbitrage required manual observation, phone calls, and physical trade execution. Today, it’s dominated by algorithms and high-frequency trading (HFT).
Modern arbitrageurs use advanced systems to:
Track price discrepancies in microseconds
Execute simultaneous trades across exchanges
Manage massive volumes with minimal latency
Technological advancements such as co-location (placing servers near exchange data centers), API connectivity, and AI-driven analytics have transformed arbitrage from human-driven intuition to machine-executed precision.
However, this also means that arbitrage opportunities now close much faster — often within milliseconds — requiring traders to invest heavily in technology.
8. Risks and Challenges in Arbitrage
While arbitrage is considered “risk-free” in theory, in reality, several factors can turn it risky:
Execution Risk: Prices may change before both sides of the trade are completed.
Latency Risk: Delays in order processing can erase profits.
Transaction Costs: Fees, taxes, and slippage can turn a profitable trade into a loss.
Regulatory Restrictions: Some countries restrict cross-border or high-frequency trading.
Currency Risk: Exchange rate fluctuations can alter effective profits.
Thus, while arbitrage is low-risk compared to speculative trading, it demands precision, capital, and infrastructure to succeed consistently.
9. Real-World Examples of Cross-Market Arbitrage
a) NSE–BSE Price Differentials
Large-cap Indian stocks often trade simultaneously on both exchanges. Automated systems constantly scan for minute price differences to execute cross-exchange arbitrage.
b) SGX–Nifty Futures Arbitrage
For years, the SGX Nifty index futures in Singapore traded slightly differently than Indian NSE Nifty futures. Arbitrageurs would buy in one market and sell in the other, balancing the two indices.
c) Cryptocurrency Exchanges
Crypto markets, being decentralized and fragmented, often exhibit significant cross-exchange price differences. For instance, Bitcoin might trade at a premium in South Korea compared to the U.S. — known as the “Kimchi Premium.”
10. The Future of Arbitrage in a Globalized Market
As technology continues to advance and global connectivity deepens, traditional arbitrage margins are shrinking. However, new forms of arbitrage are emerging, especially with the rise of:
Digital assets and tokenized securities
Decentralized finance (DeFi) platforms
Algorithmic and machine-learning-based trading strategies
Cross-market inefficiencies will likely persist in newer, evolving markets where regulatory fragmentation, liquidity gaps, and data asymmetry continue to exist.
In other words, while arbitrage profits might be slimmer, the scope of opportunities is expanding — not disappearing.
Conclusion
Arbitrage is more than just a trading strategy — it’s a mechanism that keeps the global financial system efficient and interconnected. By seizing fleeting opportunities born from imperfections, arbitrageurs ensure that prices reflect true value across geographies and instruments.
Cross-market opportunities exist because no market is perfectly efficient. Differences in time zones, liquidity, regulation, and information flow continuously create temporary imbalances. For traders equipped with speed, strategy, and precision, these moments translate into consistent profits — and for the broader system, into greater market harmony and stability.
In a world that trades 24/7 across borders, arbitrage will always find a way — adapting to new technologies, instruments, and markets — remaining one of the purest expressions of financial logic and opportunity.

Part 2 Master Candle Stick PatternWhy Trade Options?
Options can be used for different purposes:
Speculation – Traders predict whether prices will rise or fall and buy options to profit from that movement.
Hedging – Investors use options to protect their portfolios from potential losses, like insurance for their investments.
Income Generation – Some investors sell options to earn premiums regularly.

Part 11 Tradig Master ClassKey Terminologies
Strike Price: The fixed price at which the asset can be bought or sold.
Premium: The cost paid by the buyer to the seller (writer) of the option for the rights granted by the contract.
Expiration Date: The date on which the option contract expires.
In-the-Money (ITM): When exercising the option would result in a profit.
Out-of-the-Money (OTM): When exercising the option would result in a loss.

Understanding Modern Consumption PatternsIntroduction: The Changing Face of Consumption
The way people consume goods and services has changed dramatically over the past few decades. Modern consumption is not just about purchasing necessities—it’s about experiences, identity, convenience, sustainability, and technology. Globalization, digitalization, and shifting cultural values have transformed the psychology and behavior of consumers worldwide. Today’s buyers are more informed, more connected, and more value-conscious than ever before. Understanding modern consumption patterns is crucial for businesses, policymakers, and economists, as these patterns influence production systems, marketing strategies, and even national economic growth.
1. The Shift from Ownership to Experience
One of the most striking trends in modern consumption is the transition from owning products to seeking experiences. Millennials and Gen Z consumers, in particular, are driving this shift. Instead of investing heavily in durable goods like cars or houses, many prefer spending on travel, entertainment, dining, and digital experiences.
This behavioral transformation is often described as the “experience economy.” Platforms such as Airbnb, Spotify, and Netflix exemplify this trend—offering access and enjoyment without ownership. The idea of “access over ownership” resonates with modern lifestyles that value flexibility and minimalism.
This shift also reflects deeper psychological and social changes. Experiences often provide emotional satisfaction and personal stories that physical goods cannot. Social media amplifies this effect by allowing consumers to share their experiences, creating a loop of social validation and aspirational living.
2. The Role of Digital Transformation
The rise of e-commerce and digital ecosystems has revolutionized consumption patterns. From Amazon to Alibaba, online shopping has made purchasing convenient, borderless, and data-driven. The 24/7 availability of products, along with quick delivery and easy returns, has made online buying the new normal.
Moreover, AI-driven personalization plays a critical role. Algorithms analyze browsing habits, purchase histories, and even search keywords to offer tailor-made product recommendations. Consumers are no longer passive participants—they interact with brands through reviews, ratings, and social feedback, shaping market trends in real time.
Mobile commerce is another force reshaping consumption. With smartphones in every hand, shopping happens everywhere—from metro rides to coffee breaks. Social commerce, where purchases are made directly via platforms like Instagram or TikTok, blurs the line between social interaction and consumerism.
3. Conscious and Sustainable Consumption
Modern consumers are increasingly environmentally aware and socially responsible. The rise of sustainable consumption is a direct response to climate change, resource depletion, and ethical concerns over labor practices.
Buyers today ask questions like:
Is this product eco-friendly?
Is it made ethically and locally?
Can it be recycled or reused?
Brands such as Patagonia, Tesla, and IKEA have successfully aligned themselves with sustainability narratives, attracting loyal customers who want their spending to reflect their values. This trend has led to the growth of circular economies, emphasizing reuse, repair, and recycling rather than linear production and disposal.
Greenwashing, however, is a growing concern. Some brands market themselves as sustainable without making substantial environmental commitments. This has pushed consumers to demand transparency through product labeling, supply chain visibility, and third-party certifications.
4. The Influence of Social Media and Influencer Culture
Social media has turned consumption into a social activity rather than a private decision. Platforms like Instagram, YouTube, and TikTok influence purchasing decisions by showcasing lifestyles, trends, and products through creators and influencers.
Influencers—often seen as relatable figures—shape consumer opinions more powerfully than traditional advertisements. Their reviews and endorsements make products appear authentic and attainable. This peer-based trust model has redefined how marketing works, especially among younger demographics.
However, the same ecosystem can lead to overconsumption and status anxiety. The constant exposure to curated images of luxury lifestyles encourages impulsive purchases and material comparison. The rise of “de-influencing” movements—where creators encourage minimalism or mindful spending—shows that even within social media, there is a countercurrent toward responsible consumption.
5. Demographic and Generational Shifts
Different generations exhibit distinct consumption behaviors shaped by their economic and technological environments.
Baby Boomers (born 1946–1964) still represent significant purchasing power, especially in real estate, healthcare, and luxury goods.
Generation X (born 1965–1980) values practicality, brand reliability, and work-life balance.
Millennials (born 1981–1996) prioritize experiences, convenience, and sustainability.
Generation Z (born after 1996) are digital natives—highly connected, socially aware, and experimental with brands.
Gen Z’s rise as a consumer force is particularly influential. They prefer brands with authenticity, inclusivity, and social responsibility. They also value digital-first interactions and expect seamless integration between online and offline experiences.
6. The Data-Driven Consumer Economy
In the modern age, data is the new currency. Every click, purchase, and search contributes to a consumer data trail that companies analyze to forecast trends and personalize offers.
From predictive analytics to AI-powered marketing, businesses can now anticipate consumer needs even before they are consciously expressed. Subscription models and loyalty programs use behavioral data to create recurring revenue streams.
However, this also raises serious privacy and ethical concerns. Consumers are becoming more aware of how their personal data is used. The introduction of regulations like GDPR (Europe) and DPDP (India) reflects growing efforts to protect user privacy. Future consumption models will need to balance personalization with transparency and consent.
7. The Rise of Convenience and Instant Gratification
Modern consumers live in an age of speed and convenience. Food delivery apps, one-click payments, same-day shipping, and on-demand entertainment all feed the desire for instant gratification.
This culture has redefined expectations—waiting is no longer tolerated. Retailers and service providers compete not only on price or quality but also on delivery speed, ease of use, and customer support efficiency.
However, this convenience culture also contributes to unsustainable consumption patterns, as the demand for instant products often leads to excessive packaging, high carbon footprints from logistics, and impulse purchases that result in waste.
8. Localization and Personal Identity in Global Markets
While globalization has expanded access to international goods, there is also a resurgence of local consumption. Consumers increasingly value products that represent local culture, authenticity, and craftsmanship. This trend is seen in the popularity of farm-to-table restaurants, handmade goods, and regional brands.
In countries like India, “vocal for local” campaigns have encouraged support for domestic industries and artisans. Similarly, many Western consumers seek unique, personalized products instead of mass-produced items.
Modern consumption is thus becoming glocal—a mix of global access and local identity. It reflects the desire for individuality in a world dominated by mass production.
9. The Subscription and Sharing Economy
The subscription model—from Netflix to meal kits to SaaS tools—represents a fundamental shift from one-time purchases to continuous relationships between brands and consumers. It creates predictable revenue for businesses and convenience for consumers who prefer flexibility over ownership.
Similarly, the sharing economy—typified by Uber, Airbnb, and community tool-sharing platforms—has transformed consumption into collaborative access. Instead of owning a car, you can share one; instead of buying a power drill you use once a year, you can rent it.
This shift is both economically efficient and environmentally beneficial, reducing waste and optimizing resource use. However, it also creates challenges in regulation, taxation, and labor rights, as seen in the gig economy debates.
10. Economic and Psychological Drivers
Understanding consumption patterns also requires exploring economic and psychological motives.
Economically, rising disposable incomes in emerging markets, coupled with easy credit and digital payment systems, have accelerated spending. Psychologically, consumption is deeply tied to identity formation and emotional fulfillment. Buying behavior often reflects aspirations, social belonging, and even self-expression.
The concept of “retail therapy”—shopping as a mood enhancer—shows the emotional side of consumption. However, post-pandemic behavioral studies reveal a growing shift toward mindful spending and financial caution, especially as inflation and global uncertainties affect household budgets.
11. Post-Pandemic Consumer Behavior
The COVID-19 pandemic marked a turning point in global consumption. Lockdowns accelerated e-commerce adoption, remote work increased demand for home improvement and digital gadgets, and health-consciousness soared.
Consumers became more selective, focusing on essential goods, health, and wellness. Simultaneously, digital payment systems, contactless delivery, and virtual experiences (such as online fitness or education) became mainstream.
Even after the pandemic, many of these habits have persisted, forming a hybrid consumption model—a blend of physical and digital experiences known as phygital retail.
12. The Future of Consumption: Personalization, Ethics, and Technology
Looking ahead, modern consumption will be shaped by three powerful forces:
Hyper-personalization through AI and machine learning, where products and services are tailored to individual needs.
Ethical and inclusive consumerism, focusing on equality, diversity, and transparency.
Technological integration, with AR/VR shopping experiences, blockchain-based product authentication, and the growth of virtual goods in digital worlds (metaverse consumption).
Consumers will expect brands not only to sell but also to stand for something—values, sustainability, or community engagement.
Conclusion: Toward Mindful Modern Consumption
Modern consumption patterns reflect a complex interplay of technology, psychology, and social values. Consumers today are informed, connected, and empowered—but also more demanding and conscious of their impact.
Businesses that thrive in this environment are those that understand why people buy, not just what they buy. The future of consumption lies in balancing convenience with sustainability, personalization with privacy, and global access with local authenticity.
In essence, modern consumption is a mirror of modern life—dynamic, digital, and deeply human. Understanding it means understanding how society itself evolves.

The Cost of Common Trading Mistakes1. The Price of Poor Risk Management
Perhaps the single most costly mistake in trading is the failure to manage risk effectively. Risk management isn’t exciting — it’s not about predicting which stock will rally or when the market will crash — but it’s what separates long-term survivors from those who blow up their accounts.
The mistake: Traders often risk too much on a single position or fail to use stop-losses. They believe “this trade can’t go wrong,” which is usually when it does.
The cost: A single large loss can wipe out weeks or even months of steady gains. For instance, risking 20% of capital per trade means losing just five trades in a row could reduce your account by over 60%.
The fix: Never risk more than 1–2% of your capital on any single trade. Always define exit points before entering. Position sizing and disciplined stop-loss placement are your best defense against market uncertainty.
In trading, your number one job is not to make money — it’s to protect your capital.
2. Overtrading: When Action Becomes Addiction
Overtrading is one of the most silent killers of profitability. The temptation to “always be in the market” arises from boredom, greed, or the illusion of control.
The mistake: Taking too many trades in a day or week, often without solid setups or edge.
The cost: High transaction costs, emotional fatigue, and poor decision-making. Frequent trades erode profits through brokerage fees and slippage. More importantly, it leads to mental exhaustion, increasing the likelihood of impulsive actions.
The fix: Focus on quality, not quantity. A single high-probability setup can be more profitable than 10 random ones. Define your trading plan and stick to it — trade only when the odds align with your edge.
Remember: patience pays more than constant participation.
3. Ignoring the Power of Emotions
Trading is as much a psychological game as it is a financial one. Emotions like fear, greed, and impatience cloud rational judgment, turning what should be a strategic activity into an emotional rollercoaster.
The mistake: Traders panic-sell during drawdowns or chase prices when they see momentum building.
The cost: Fear often causes traders to exit winning positions too early, while greed makes them hold losing ones for too long. Both habits destroy risk-reward balance and long-term profitability.
The fix: Develop emotional discipline. Stick to predefined rules. Consider journaling your trades and feelings to identify emotional triggers. Meditation, mindfulness, or even stepping away from screens can help maintain balance.
Markets reward logic, not emotion.
4. Lack of a Trading Plan
Without a structured plan, trading becomes guesswork — and guesswork rarely pays.
The mistake: Many traders enter trades based on “gut feeling” or tips from others. They lack clear entry and exit rules, risk limits, or defined objectives.
The cost: Inconsistent results and an inability to measure performance. Without a plan, traders don’t know what’s working or failing, making improvement impossible.
The fix: Every trader should build a Trading Plan that includes:
Market selection (e.g., equities, commodities, forex)
Entry/exit rules
Stop-loss and take-profit strategy
Risk per trade
Maximum drawdown tolerance
Time commitment and review schedule
Once you have a plan — follow it with discipline. Adjust it only after analyzing sufficient data, not on emotion.
5. The Dangers of Averaging Down
Averaging down — buying more of a losing position — is one of the most expensive mistakes traders make. It stems from ego and denial.
The mistake: When a stock drops, traders add more, believing it’s “cheaper now.” They hope the market will reverse.
The cost: If the trend continues downward, losses multiply quickly. Averaging down can turn a small, manageable loss into a portfolio disaster.
The fix: Respect stop-losses. Never add to a losing trade unless it’s part of a pre-tested, rule-based scaling strategy. The best traders add to winning positions, not losing ones.
Hope is not a trading strategy.
6. FOMO and Chasing Trends
The Fear of Missing Out (FOMO) is a modern-day trading plague. Watching others profit from a sharp rally often triggers impulsive buying — usually right before the trend reverses.
The mistake: Entering trades too late, when prices are overextended.
The cost: Buying at tops and selling at bottoms. The emotional rush of chasing momentum leads to poor entries and steep losses.
The fix: Accept that missing some moves is part of trading. Opportunities never end; markets are infinite. Instead of chasing, plan your entries ahead — set alerts and wait for pullbacks.
Discipline will always beat excitement.
7. Neglecting Market Conditions
A strategy that works in a trending market might fail miserably in a choppy one. Many traders ignore the context in which they are trading.
The mistake: Applying the same approach regardless of volatility, liquidity, or trend conditions.
The cost: Misaligned trades — for example, trend-following in sideways markets or scalping in low-volume environments.
The fix: Always assess market structure before trading. Identify whether the market is trending, consolidating, or reversing. Adjust position size, targets, and stop-loss accordingly.
Adaptation is the hallmark of professional trading.
8. Lack of Continuous Learning
Markets evolve — what worked yesterday might not work tomorrow. Many traders, after some early success, stop learning and refining their edge.
The mistake: Relying on outdated strategies or ignoring new tools like algorithmic signals, volume profiles, or AI-based analysis.
The cost: Reduced performance and missed opportunities. The cost of stagnation is gradual but devastating.
The fix: Treat trading as a lifelong learning process. Read, backtest, follow credible analysts, and review your trades weekly. Stay flexible and open-minded.
In trading, education is cheaper than ignorance.
9. Ignoring Position Sizing
Even with a good strategy, poor position sizing can lead to disaster.
The mistake: Betting too big when confident and too small when uncertain — purely based on emotion.
The cost: Volatile results and emotional burnout. Large positions increase stress and magnify mistakes.
The fix: Use a consistent formula, such as the 2% rule, meaning you risk only 2% of capital per trade. Position sizing should depend on stop-loss distance and account equity, not “gut feeling.”
Consistency builds compounding.
10. Revenge Trading
After a loss, some traders immediately jump into another trade, desperate to recover. This is known as revenge trading — a fast track to bigger losses.
The mistake: Trading emotionally after a setback without analysis or patience.
The cost: Poor entries, disregard for setups, and compounding losses. It also damages psychological balance.
The fix: Accept losses as part of the business. Take a break after significant drawdowns. Review what went wrong before returning to the market.
In trading, emotional control is wealth control.
11. Neglecting Data and Journaling
Professional traders analyze data — amateur traders rely on memory. The absence of trade journaling means lessons are forgotten, and mistakes are repeated.
The mistake: Not recording trades, reasoning, and emotional state.
The cost: Inability to identify patterns of success or failure. Without analytics, improvement is random.
The fix: Maintain a trading journal noting entry/exit points, market context, emotions, and results. Over time, this becomes a goldmine of self-knowledge.
You can’t fix what you don’t measure.
12. Blindly Following Others
Social media, Telegram groups, and “expert” calls have created a dangerous herd mentality in trading.
The mistake: Copying trades of others without understanding the logic behind them.
The cost: When trades go wrong — and they often do — followers panic because they lack conviction. Losses multiply due to delayed exits and emotional confusion.
The fix: Learn from others but think independently. Build your own thesis for every trade. Blind faith in “tips” is financial suicide.
Confidence comes from clarity, not consensus.
13. Neglecting the Broader Picture
Focusing only on charts and ignoring macroeconomic factors is another costly error. Economic data, interest rates, and geopolitical events shape price behavior.
The mistake: Overreliance on technicals without considering news or sentiment shifts.
The cost: Unexpected volatility and stop-loss hits during major announcements.
The fix: Combine technical and fundamental awareness. Track calendars for earnings, policy announcements, and macro events.
Markets move because of context, not just candles.
14. Misunderstanding Leverage
Leverage amplifies both profits and losses. Many traders misuse it, seduced by the idea of “fast money.”
The mistake: Using excessive leverage without understanding margin requirements or potential drawdowns.
The cost: A small price move against your position can trigger a margin call or total account wipeout.
The fix: Use leverage cautiously. Consider it a double-edged sword. If your system isn’t consistently profitable, leverage will only accelerate losses.
Leverage doesn’t make you rich — discipline does.
15. Failure to Accept Mistakes
The most expensive mistake of all is not learning from mistakes. Every loss has a lesson, but many traders refuse to confront their errors, blaming the market instead.
The mistake: Denial of responsibility and lack of self-assessment.
The cost: Repeating the same pattern until the account is gone.
The fix: Treat every loss as data, not defeat. Review trades weekly. Identify recurring errors and eliminate them.
In trading, humility pays compound interest.
Conclusion: Every Mistake Has a Price — Learn Before You Pay
Trading mistakes are inevitable — but repeating them is optional. Every poor decision has a financial cost, an emotional cost, and an opportunity cost. What separates successful traders from struggling ones isn’t luck or genius; it’s the willingness to analyze, adapt, and evolve.
Avoiding these common mistakes won’t make you instantly rich, but it will prevent you from going broke — and in trading, that’s the real foundation of success.
Master your risk, control your emotions, plan your trades, and treat every mistake as a tuition fee paid to the market. Over time, those lessons compound — just like profits do.
Part 3 Learn Institutional TradingHow Option Trading Works
Option trading involves two main parties: the buyer and the seller (writer).
The buyer pays a premium and gets the right (not obligation) to buy or sell the underlying asset.
The seller receives the premium and takes on the obligation to buy or sell the asset if the buyer exercises the option.
Let’s take an example:
Suppose a trader buys a call option for Stock A with a strike price of ₹1,000, paying a premium of ₹50. If the stock rises to ₹1,100, the trader can exercise the option to buy at ₹1,000 and sell at ₹1,100, earning ₹100 per share (minus the ₹50 premium). The profit is ₹50 per share.
If the stock stays below ₹1,000, the trader won’t exercise the option and only loses the ₹50 premium paid.

Part 1 Ride The Big Moves What Are Options?
An option is a financial contract that gives the buyer the right, but not the obligation**, to buy or sell an underlying asset at a predetermined price (called the strike price) before or on a specific date (the expiry date).
Options are categorized into two types:
Call Option: Grants the holder the right to buy the underlying asset.
Put Option: Grants the holder the right to sell the underlying asset.
For example, if an investor believes a stock’s price will rise, they might buy a call option. Conversely, if they expect the price to fall, they might buy a put option.

Infrastructure & Capital Goods Momentum: Building India’s Growth1. Sector Overview: Foundation of Economic Growth
The Infrastructure and Capital Goods sectors are closely linked yet distinct in nature.
Infrastructure represents the creation of physical assets like roads, highways, airports, ports, metros, power grids, pipelines, and urban development projects.
Capital Goods refers to manufacturing equipment and machinery used in producing goods and services — such as engineering equipment, construction machinery, electrical systems, heavy vehicles, and automation tools.
Together, these sectors form the backbone of industrial expansion. When infrastructure improves, industrial productivity rises. And when capital goods companies thrive, it indicates that industries are investing in new capacities — a key sign of economic confidence.
2. Revival of the Capex Cycle
After nearly a decade of subdued corporate investment post-2012, India’s private capital expenditure is witnessing a broad-based revival.
Several trends are converging to create this momentum:
Government-Led Push:
The Indian government’s capital expenditure has increased by over 3.5x since FY17, with infrastructure allocations crossing ₹11 lakh crore in Budget FY25. Flagship programs like Gati Shakti, National Infrastructure Pipeline (NIP), and PM Gati Shakti Master Plan are ensuring integrated infrastructure development.
Private Sector Reinvestment:
After years of deleveraging, Indian corporates have cleaned up their balance sheets. Now, with improved demand visibility and strong profitability, private players are again investing in capacity expansion — especially in sectors like cement, steel, energy, and manufacturing.
PLI and Make-in-India Push:
The Production Linked Incentive (PLI) schemes across multiple sectors — including electronics, auto components, renewables, and defence — are catalyzing fresh capital investments. This, in turn, is boosting demand for industrial equipment and capital goods.
Urbanization and Infrastructure Expansion:
India’s urbanization rate, currently around 36%, is expected to cross 40% by 2030. This urban transition is driving demand for smart cities, transport corridors, real estate, and public utilities.
In essence, India’s capex cycle has entered a structurally positive phase — and that’s what’s fueling the ongoing rally in infrastructure and capital goods stocks.
3. Infrastructure Sector Momentum
3.1 Roads & Highways
The roads and highways segment remains the biggest beneficiary of the government’s infrastructure focus. The Ministry of Road Transport & Highways continues to allocate record budgets under the Bharatmala Pariyojana scheme.
Construction pace has averaged 35 km per day, with an aim to cross 45 km/day by 2026.
Companies like IRB Infra, KNR Constructions, HG Infra, and PNC Infratech have witnessed healthy order inflows and margin expansion.
Toll monetization and hybrid annuity models (HAM) have reduced financial risks and ensured sustainable cash flows.
3.2 Railways & Metro Projects
Indian Railways’ capital outlay crossed ₹2.5 lakh crore in FY25, focused on modernization, track electrification, and station redevelopment.
Metro rail expansion in Tier-2 cities (like Surat, Patna, Nagpur, and Indore) is opening new project opportunities.
Stocks like IRCON, RVNL, RITES, and Titagarh Rail Systems have gained sharply due to strong order pipelines and profitability visibility.
3.3 Power & Energy Infrastructure
The power infrastructure story is evolving beyond traditional generation to transmission and renewable integration.
Companies like Power Grid, KEC International, Techno Electric, and Kalpataru Projects are winning large transmission and substation orders.
The upcoming Green Energy Corridors project and National Smart Grid Mission are creating long-term opportunities in grid modernization and electrification.
3.4 Urban Infra & Water Management
Urban infrastructure — including housing, water supply, sanitation, and waste management — is gaining momentum under AMRUT 2.0, Jal Jeevan Mission, and Smart City Mission.
Players like VA Tech Wabag, L&T Construction, and NCC Ltd. are executing large urban infra contracts.
Demand for efficient project management and technology integration is driving digitalization in infra execution.
4. Capital Goods Sector Momentum
The capital goods sector’s resurgence is a clear signal that industrial demand is returning. This segment has seen a sharp order inflow in FY24-FY25, driven by public and private capex revival.
4.1 Industrial Equipment & Engineering
Companies such as Larsen & Toubro (L&T), ABB India, Siemens, and Thermax are reporting record order books.
L&T’s order inflow has crossed ₹3.3 lakh crore, with visibility across oil & gas, defence, power, and infrastructure.
Engineering exports have also picked up due to global supply chain diversification, giving Indian firms an edge.
4.2 Electrical & Automation
The automation and electrification segments are witnessing significant growth due to India’s industrial digitization wave.
ABB, Siemens, and Schneider Electric are benefiting from demand for smart factories, process automation, and EV charging infrastructure.
Domestic players like CG Power and Industrial Solutions, KEC, and Polycab are seeing strong growth in transformers, cables, and industrial systems.
4.3 Defence & Aerospace Manufacturing
The government’s push for Atmanirbhar Bharat in defence production is reshaping the landscape.
With import substitution policies and 74% FDI allowance in defence manufacturing, companies like HAL, BEL, Bharat Dynamics, and Mazagon Dock are expanding capacity.
Defence PSUs have robust order books and steady revenue visibility for the next 4–5 years.
4.4 Machinery & Construction Equipment
The construction equipment segment is riding the infrastructure boom.
ACE, JCB India, and Tata Hitachi are seeing high utilization and sales volumes.
The mechanization of rural infrastructure and smart city projects is further expanding their market.
5. Financial Performance & Market Trends
5.1 Order Book Strength
Order books across infrastructure and capital goods companies have hit multi-year highs.
For instance:
L&T’s consolidated order book: ₹4.8 lakh crore
ABB India’s order inflow growth: 25% YoY
IRCON, RVNL, and RITES: Combined orders exceeding ₹1 lakh crore
These numbers highlight strong execution visibility for the next 2–3 years.
5.2 Margin Expansion
With raw material prices stabilizing and better execution efficiency, companies are reporting operating margin improvement.
Project delays are reducing due to better financing models and project management tools.
5.3 Stock Market Momentum
Both sectors have been market leaders in the 2024–2025 rally:
The BSE Capital Goods Index surged over 60% YoY, outperforming the Sensex.
The Infrastructure Index gained nearly 45% YoY, led by PSUs and construction majors.
Retail and institutional investors have increased exposure, especially in public-sector and midcap engineering stocks.
6. PSU Leadership: The New Growth Drivers
Public Sector Undertakings (PSUs) have emerged as major beneficiaries of this momentum.
Companies like BEL, BHEL, RVNL, NBCC, and IRCON have delivered multi-bagger returns in the past two years.
These PSUs are executing large government projects with improved financial discipline and better dividend payouts.
Investor perception has shifted — PSUs are no longer “value traps,” but strategic growth vehicles aligned with national infrastructure goals.
7. Key Growth Drivers Ahead
Budgetary Allocation Continuity:
The government’s FY26 budget is likely to sustain high capital expenditure, ensuring visibility for the next several years.
Private Capex Acceleration:
Sectors like cement, metals, renewables, and chemicals are entering new capacity expansion phases, boosting machinery and engineering demand.
Green & Renewable Transition:
India’s target of 500 GW renewable capacity by 2030 will generate opportunities across energy transmission, grid modernization, and clean tech equipment.
Global Supply Chain Realignment:
Multinational companies are diversifying away from China, positioning India as a manufacturing hub — benefiting domestic capital goods makers.
Digital & Automation Integration:
The adoption of industrial automation, robotics, and IoT is creating long-term opportunities for high-tech engineering firms.
8. Challenges and Risks
While the outlook remains robust, certain risks need monitoring:
Execution Delays: Large infra projects still face bureaucratic and land acquisition challenges.
Commodity Price Volatility: Sudden spikes in steel, cement, or copper prices can affect margins.
Interest Rate Sensitivity: Infrastructure companies are capital-intensive, and high borrowing costs can impact profitability.
Global Demand Slowdown: Exports of capital goods may face headwinds if global growth slows in 2025–2026.
9. Investment Outlook: Sustained Multi-Year Opportunity
The Infrastructure & Capital Goods theme represents one of the strongest multi-year investment opportunities in India’s growth story.
Key investment themes include:
PSU Infrastructure Leaders: IRCON, RVNL, BEL, NBCC
Private Engineering Majors: L&T, Siemens, ABB, Thermax
Construction & EPC Specialists: KNR Constructions, HG Infra, NCC, Kalpataru
Electrical Equipment & Automation: CG Power, Polycab, KEI Industries, KEC International
Investors should focus on companies with:
High order book-to-revenue ratios
Healthy balance sheets
Strong execution track records
Exposure to sunrise sectors like renewables, defence, and automation
10. Conclusion
India’s Infrastructure and Capital Goods momentum marks the beginning of a new growth era.
After years of policy groundwork, the country is witnessing the materialization of its infrastructure dreams — from world-class highways to modern railways, from green energy corridors to smart cities.
The capital goods industry, in turn, is powering this transformation with engineering excellence, technological adoption, and renewed corporate confidence.
With government capex and private investments working in tandem, these sectors are not just cyclical plays anymore — they represent structural growth themes for the next decade.
As India builds the foundation for its $5 trillion economy target, Infrastructure and Capital Goods will remain its most powerful pillars — delivering both economic strength and market leadership.

Midcap & Smallcap Index Volatility1. Understanding Midcap and Smallcap Indices
Before diving into volatility, it’s important to understand what midcap and smallcap indices represent.
Nifty Midcap 100 Index: This tracks the performance of the top 100 mid-sized companies listed on NSE, ranked from 101 to 200 by full market capitalization.
Nifty Smallcap 100 Index: This tracks the next 100 companies, ranked from 201 to 300 by market capitalization.
These indices help investors monitor the performance of mid- and small-sized businesses in India — companies that are neither as large nor as stable as blue-chip giants, but often more dynamic, growing, and entrepreneurial in nature.
2. What Is Volatility?
Volatility is a measure of how much and how quickly the price of a stock or index moves over a period of time. In simple words, it reflects the degree of price fluctuation.
High volatility: Prices move sharply up or down within short periods.
Low volatility: Prices move gradually or remain relatively stable.
For example, if the Nifty Midcap 100 rises 2% one day, falls 3% the next, and rises 4% the following day, it’s showing high volatility. In contrast, the Nifty 50 (large-cap) might move only ±0.5% on average during the same period.
Volatility can be historical (based on past price movements) or implied (based on expectations embedded in options pricing). In this explanation, we focus mainly on historical and structural volatility of midcap and smallcap indices.
3. Why Midcap and Smallcap Indices Are More Volatile
There are several reasons why these segments show higher volatility than large caps:
(a) Liquidity Constraints
Midcap and smallcap stocks are often less liquid, meaning fewer buyers and sellers trade them compared to large caps. As a result, even small trading volumes can lead to large price swings.
For instance, a ₹10 crore order might barely move Reliance Industries’ price but can cause a 5–10% jump or fall in a smallcap company.
(b) Limited Institutional Participation
Large-cap stocks attract foreign institutional investors (FIIs) and domestic mutual funds due to their size, governance, and liquidity. Midcaps and smallcaps, however, often have limited institutional coverage.
This means retail sentiment can heavily influence prices, increasing volatility.
(c) Business Fragility
Smaller companies generally face higher business risks — such as dependence on fewer products, markets, or clients. During economic slowdowns, their earnings can decline sharply, which directly reflects in stock prices.
(d) Information Asymmetry
Midcap and smallcap companies often have limited analyst coverage, and information about their operations, financials, or management decisions may not be widely available.
This creates uncertainty, and uncertainty breeds volatility.
(e) Retail and Momentum Trading
Retail traders dominate the smallcap segment, and many of them chase momentum rather than fundamentals. When stocks rally, more traders jump in, fueling a sharp rise; when prices fall, panic selling intensifies — both driving up volatility.
4. Historical Perspective of Midcap & Smallcap Volatility
Over the past decade, Indian midcap and smallcap indices have displayed cycles of extreme outperformance followed by deep corrections. Let’s look at key phases:
(i) 2014–2017: The Bull Run
Post the 2014 general elections, midcaps and smallcaps experienced a historic rally.
Economic optimism, policy reforms, and liquidity inflows lifted investor confidence.
Between 2014 and 2017, the Nifty Midcap 100 delivered over 100% returns, and the Smallcap 100 gained more than 120%.
However, this sharp rise came with high volatility — daily swings of 1.5–3% were common.
(ii) 2018–2019: Sharp Correction
After years of outperformance, valuations became stretched.
Rising interest rates, liquidity concerns, and corporate defaults triggered a massive correction.
The Smallcap index fell over 30–40% from its peak, while the Midcap index dropped around 25–30%.
This period highlighted the downside volatility risk of small companies.
(iii) 2020: Pandemic Crash and Recovery
The COVID-19 crash in March 2020 wiped out years of gains in weeks. The Smallcap index fell over 45% in less than a month.
However, when liquidity flooded the market later in 2020–21, these same indices rebounded dramatically — doubling or tripling in value.
This shows how midcap and smallcap volatility cuts both ways — losses and gains.
(iv) 2023–2024: New Volatility Phase
Post-2023, the Indian smallcap and midcap segments once again became hot due to strong retail inflows, mutual fund SIPs, and manufacturing revival themes.
But by mid-2024, SEBI and AMFI began cautioning investors about overheated valuations, leading to bouts of profit booking and corrections — clear signs of rising volatility again.
5. Measuring Volatility
Volatility can be quantified using several metrics:
(a) Standard Deviation
It measures how much daily returns deviate from the average return.
A higher standard deviation means higher volatility.
For example:
Nifty 50 annualized volatility: around 10–12%
Nifty Midcap 100: around 18–22%
Nifty Smallcap 100: around 24–30%
(b) Beta (β)
Beta measures how much an index moves relative to a benchmark (like Nifty 50).
Midcap index beta ≈ 1.3–1.5
Smallcap index beta ≈ 1.6–1.8
This means smallcaps move almost 1.8 times more than large caps on average.
(c) India VIX vs. Segment Volatility
While India VIX reflects volatility expectations of the Nifty 50, the implied volatility for smallcap/midcap stocks tends to be higher during uncertain or speculative phases.
6. Factors Influencing Volatility in Midcaps & Smallcaps
(a) Economic Conditions
Mid- and small-sized companies are highly sensitive to economic cycles.
When GDP growth slows or interest rates rise, these businesses often suffer earlier than large caps.
(b) Liquidity Flow
Mutual fund and retail inflows can fuel rallies; sudden outflows can trigger steep declines.
(c) Corporate Earnings
Since many midcap and smallcap companies have small profit bases, even small fluctuations in earnings can lead to big price changes.
(d) Market Sentiment
These indices are more sentiment-driven. Positive narratives like “Make in India,” “Renewable Energy,” or “Defence Manufacturing” often create sharp thematic rallies.
(e) Global Triggers
Although midcap and smallcap companies are mostly domestic-focused, global events (like oil price spikes, US Fed rate hikes, or geopolitical tensions) can still affect them via liquidity or risk appetite channels.
7. The Double-Edged Sword of Volatility
Volatility in midcap and smallcap indices isn’t inherently bad — it’s a double-edged sword.
For traders, volatility provides opportunities for quick profits. Price swings mean frequent entry and exit points.
For investors, it offers chances to buy quality companies at lower valuations during corrections.
However, volatility also brings emotional stress and the risk of large losses if one chases momentum blindly.
8. Managing Volatility – Risk Control Strategies
Here’s how traders and investors can handle volatility in midcap and smallcap segments:
(a) Diversification
Avoid concentrating too much capital in a few small stocks. Spread exposure across sectors to reduce specific risk.
(b) Staggered Investment
Use Systematic Investment Plans (SIPs) or phased buying instead of lump-sum entries to average out volatility.
(c) Quality Filter
Focus on companies with:
Strong balance sheets
Consistent earnings
Low debt-to-equity ratios
Credible management
Not all smallcaps are speculative — many future large-caps emerge from this space.
(d) Technical & Volume Analysis
Traders can use volume profile, moving averages, and support-resistance levels to gauge strength and avoid entering during euphoria or exhaustion phases.
(e) Stop-Loss Discipline
Always use predefined stop-loss levels to protect against deep drawdowns.
(f) Macro Monitoring
Keep an eye on:
RBI’s monetary policy
Inflation trends
FIIs’ flow data
Fiscal deficit
as these macro factors influence liquidity and sentiment — the lifeblood of mid/smallcap rallies.
9. Psychological Aspect of Volatility
Volatility tests not just portfolios but also patience and psychology.
When prices fall sharply, retail investors often panic and sell at lows. Conversely, when prices surge, they chase high-flying stocks at inflated valuations.
Successful participants in midcap/smallcap segments are those who:
Think long-term
Avoid herd mentality
Use volatility as a friend, not an enemy
Remember Warren Buffett’s words:
“Be fearful when others are greedy, and greedy when others are fearful.”
That advice fits midcap and smallcap investing perfectly.
10. Current Scenario (2025 Outlook)
As of late 2025, volatility in midcap and smallcap indices remains elevated due to multiple factors:
Concerns over stretched valuations
Shifts in interest rate expectations
Sector rotations between infrastructure, renewables, and financials
Heavy retail participation via smallcap mutual funds and direct trading
Regulatory bodies like SEBI and AMFI continue monitoring fund inflows to ensure stability. Meanwhile, many analysts suggest stock-specific investing instead of chasing the broader index, as valuations in some pockets remain high.
In short:
Volatility = Opportunity + Risk
Selectivity = Survival
11. Conclusion
Midcap and smallcap indices are the heartbeat of India’s growth story. They represent emerging leaders, innovative businesses, and fast-expanding industries. However, with high potential comes high volatility.
Key takeaways:
Midcaps and smallcaps are structurally more volatile than large caps due to liquidity, size, and sentiment factors.
Their volatility can amplify both bullish rallies and bearish corrections.
Understanding volatility helps traders time entries better and helps investors hold quality names with conviction.
Risk management, diversification, and patience are essential tools for navigating this roller coaster.
In essence, midcap and smallcap volatility is not something to fear — it’s something to respect and manage. For those who understand its rhythm, volatility becomes a powerful ally in building long-term wealth.

Banking Sector Leadership & PSU Bank Rally – A Deep Dive1. Introduction
The Indian stock market has witnessed several phases of leadership rotation over the years. At times, technology stocks dominate; at other times, energy or infrastructure sectors take the front seat. However, whenever the broader market gears up for a major uptrend or a new bull cycle begins, the Banking sector often takes the leadership role — and within that, Public Sector Undertaking (PSU) banks frequently emerge as key outperformers.
The recent rally in PSU banks and the resurgence of the banking sector as a whole highlight not just cyclical market behavior but also deep structural changes in the Indian economy. To understand this movement, it’s important to analyze both why banking leads and what’s fueling the PSU bank rally in particular.
2. Why Banking Sector Often Leads the Market
a. Core to Economic Growth
Banks are the financial backbone of any economy. When economic activity expands — whether through manufacturing, infrastructure, or consumer spending — banks benefit directly. Credit growth picks up, deposit bases rise, and loan demand strengthens. Therefore, the health and momentum of the banking sector often act as a mirror of economic strength.
b. Credit Cycle Expansion
A strong economy usually corresponds to an expanding credit cycle. When businesses borrow more for expansion, and individuals take more loans for consumption (homes, vehicles, education), banks record higher net interest income (NII) and better profitability.
During the early-to-mid phase of a bull market, credit growth typically accelerates sharply, turning the banking sector into a market leader.
c. Interest Rate Cycle and Net Interest Margins
The interest rate environment plays a crucial role. When rates stabilize after a hiking cycle, banks — especially those with a large low-cost deposit base — witness margin expansion. With loan yields rising faster than deposit costs, Net Interest Margin (NIM) improves.
This scenario often unfolds in the mid-stages of economic recovery — precisely when the stock market’s optimism about growth is at its peak.
d. Heavy Market Weightage
In indices like the Nifty 50 and Bank Nifty, banking and financial services account for around 35–40% of total weightage. Naturally, whenever large investors — both domestic and foreign — turn bullish on India, their first entry point is often the banking sector, leading to index-level leadership.
3. Banking Sector’s Structural Transformation
The Indian banking landscape has undergone a major transformation over the last decade — both in private and public sectors.
a. Clean-up of Balance Sheets
Post the 2014–2018 NPA crisis, Indian banks, particularly PSUs, faced massive challenges due to bad loans, corporate defaults, and poor asset quality. The Insolvency and Bankruptcy Code (IBC) and RBI’s asset quality reviews forced banks to recognize, provision, and resolve bad assets.
Today, most major banks — especially SBI, Bank of Baroda, Canara Bank, and Union Bank — have net NPA ratios below 1%–1.2%, compared to 5–6% a few years ago. This clean-up has set the stage for a sustainable recovery.
b. Digitization & Efficiency Gains
The digital transformation in banking — UPI, mobile apps, digital KYC, and paperless loans — has enhanced operational efficiency, reduced cost-to-income ratios, and improved customer acquisition. PSU banks, once lagging behind in technology, have now made significant progress through partnerships with fintechs and internal digital drives (like SBI’s YONO or BoB World).
c. Government Recapitalization and Consolidation
Between FY2017 and FY2021, the Indian government infused over ₹3 lakh crore into PSU banks, strengthening their capital buffers. Additionally, bank mergers created stronger entities — for example:
Bank of Baroda absorbed Dena and Vijaya Bank,
Canara Bank merged with Syndicate Bank,
Union Bank merged with Andhra and Corporation Bank.
This consolidation reduced fragmentation, created scale, and enhanced competitiveness.
4. The PSU Bank Rally – What’s Driving It?
The PSU bank rally has been one of the most notable themes in the Indian stock market in recent years. After a decade of underperformance, these stocks have turned into multi-baggers, with several PSU banks delivering 200–500% returns in just 2–3 years.
Let’s decode the reasons behind this rally:
a. Massive Valuation Re-rating
For a long time, PSU banks traded at deep discounts to book value — often between 0.3x to 0.6x — reflecting investor pessimism. With the clean-up of balance sheets, profitability return, and stable management, the market started to re-rate these banks.
Currently, large PSU banks trade at 1.0–1.5x P/B, still lower than private peers (2.5x–4x), leaving room for further revaluation.
b. Return of Profitability
Post-2020, PSU banks started showing consistent quarterly profits, driven by lower provisioning costs and higher NII.
Example:
SBI’s FY2025 profits are expected to exceed ₹75,000 crore,
Canara Bank, BoB, and Union Bank are recording ROEs above 15%, levels not seen in over a decade.
These results changed investor sentiment from skepticism to confidence.
c. Credit Growth Momentum
PSU banks are witnessing robust credit growth of 12–14%, led by retail loans (housing, personal, auto), SME lending, and corporate capex revival. Their strong presence in rural and semi-urban areas gives them an edge in deposit mobilization, leading to stable funding costs.
d. Capital Adequacy & Improved Asset Quality
Thanks to recapitalization and internal profit generation, most PSU banks now have Capital Adequacy Ratios above 14%, giving them room to expand their balance sheets. Their Gross NPA ratios have fallen below 4%, compared to 10–12% in 2018.
e. FII and DII Interest
Foreign Institutional Investors (FIIs) and Domestic Institutional Investors (DIIs) have both turned net buyers of PSU banks. The segment is considered a proxy for India’s growth story — benefiting from both cyclical and structural drivers.
Moreover, PSU banks offer attractive dividend yields (3–5%) and stable earnings visibility, making them a favorite in the current interest rate environment.
5. Comparing PSU vs Private Banks
Parameter PSU Banks Private Banks
Valuation (P/B) 0.9–1.5x 2.5–4.0x
ROE/ROA Improving (12–15%) High (16–18%)
NIM 3–3.3% 3.5–4.5%
Asset Quality Improved, but slightly lower Very strong
Technology Adoption Rapidly catching up Already advanced
Growth Drivers Retail, Infra, SME, Rural Credit Premium Retail, Digital, Corporate
Investor Sentiment Recovering fast Already strong
The valuation gap between PSU and private banks has started narrowing, but PSUs still remain value plays, whereas private banks are seen as quality growth plays.
6. Banking Sector as Market Leader in 2025 Cycle
In the ongoing market cycle, banking is again showing signs of leadership emergence, driven by several factors:
a. Capex Revival
India’s private and public sector capex is gaining momentum — from roads and ports to data centers and manufacturing. Banks will play a financing role in this multi-trillion-rupee expansion phase.
b. Liquidity & Deposit Growth
Despite competition from small finance and fintech banks, traditional banks — especially PSUs — have maintained strong CASA (Current Account Savings Account) ratios, ensuring liquidity. This gives them pricing power in a tightening liquidity environment.
c. Credit Quality Cycle at Its Best
With low slippages and strong recoveries, India is in the best credit quality cycle in two decades. Credit costs (provisions as a % of assets) are at multi-year lows, directly boosting profitability.
d. Government Support & Reforms
The government continues to push for PSU bank modernization, privatization of smaller entities, and improvement in governance. The “bad bank” (NARCL) initiative has further helped clear legacy NPAs.
e. Rising Financialization of Savings
With rising income levels and formalization, more money is flowing into banking and financial systems — deposits, mutual funds, and loans — further deepening the sector’s dominance.
7. Technical & Market Structure Perspective
From a market structure angle, the Bank Nifty index is often the leading indicator for Nifty’s trend direction. Historically:
When Bank Nifty outperforms Nifty, it signals broad-based bullishness.
When PSU banks outperform private banks, it often indicates a mid-stage bull market, where value stocks catch up with growth stocks.
As of 2025, both Bank Nifty and Nifty PSU Bank Index are trading near record highs, showing strong volume support, healthy price structure, and institutional accumulation — confirming that leadership lies with the banking pack.
8. Risks & Challenges
Despite strong fundamentals, certain risks remain:
Interest Rate Volatility: A sharp rate hike cycle can squeeze margins.
Global Slowdown: If export demand or global growth falters, corporate loan demand may soften.
Competition from Fintechs: Fintechs may eat into certain profitable retail segments.
Policy Risks: Privatization delays or regulatory tightening can temporarily hurt PSU valuations.
However, these are manageable risks in the current macro setup, as most PSU and private banks maintain high provisioning buffers and stable management practices.
9. Outlook for 2025 and Beyond
The outlook for the banking sector remains constructive and bullish. Analysts expect:
Credit growth of 12–14% CAGR,
NIMs to remain steady,
ROEs to sustain above 14%,
Asset quality to remain stable.
PSU banks are expected to narrow the valuation gap with private banks as they continue to deliver consistent profits, higher dividends, and improved governance.
In the medium term (2025–2027), the PSU Bank Index could potentially outperform broader indices, supported by:
Credit growth in infrastructure, housing, and MSMEs,
Rising investor confidence,
India’s macroeconomic resilience.
10. Conclusion
The Banking sector’s leadership in the market is not accidental — it is rooted in economic cycles, financial system dominance, and investor psychology. Every major bull market in India’s history has been led, directly or indirectly, by banks.
The PSU Bank rally represents not just a price recovery but a structural turnaround story — from being crisis-hit entities plagued by NPAs and inefficiency to becoming profitable, tech-savvy, dividend-paying institutions aligned with India’s growth narrative.
As India’s GDP moves toward the $5 trillion mark, and capex, consumption, and credit cycles expand together, banks — both private and public — will remain the torchbearers of the next leg of India’s equity bull market.
