Technical Trading analysisTechnical analysis in trading is a method that uses historical price and volume data to predict future price movements, identifying patterns, trends, and signals to assist traders in making informed decisions.
X-indicator

RSI Divergence explainedRSI (Relative Strength Index) divergence in technical analysis occurs when the price of an asset and the RSI indicator move in opposite directions, potentially signaling a trend reversal or weakening momentum.

ADX ExpalanationThe Average Directional Index (ADX) is a technical analysis tool used to measure the strength of a trend, regardless of its direction, helping traders assess market momentum and make informed decisions.

Database Trading In the context of trading, "database trading" or "data trading" refers to using data, often from financial markets, to gain knowledge and make better trading decisions, potentially automating the process.

Price Action TradingPrice action trading is a strategy where traders make decisions based on the movement of an asset's price over time, focusing on trends, chart patterns, and significant price events, rather than relying heavily on technical indicators.

PCR analysisPCR (Polymerase Chain Reaction) is a molecular biology technique used to amplify specific DNA sequences, enabling the creation of millions of copies from a small sample, used in various applications like diagnostics, research, and forensics.

Meaning of Management and psychologyManagement is the process of planning, organizing, leading, and controlling resources to achieve organizational goals, while psychology is the scientific study of behavior and mental processes. Management psychology, also known as managerial psychology, applies psychological principles to understand and improve managerial practices and organizational behavior.

How to Trade Using Automatic Fibonacci Zones!What is AutoFibGauge? How to Trade Using Automatic Fibonacci Zones! 🎯
⸻
Manually drawing Fibonacci retracements can be confusing and time-consuming.
That’s why I use AutoFibGauge, a custom tool that automatically detects swing highs and lows and plots key Fibonacci levels for you.
It makes my trading faster, more accurate, and helps avoid emotional errors.
⸻
What is Fibonacci Retracement?
Fibonacci retracement is based on the idea that markets tend to retrace a predictable portion of a move before continuing in the original direction.
The most important Fibonacci levels are:
• 23.6% – Minor pullback
• 38.2% – Healthy correction
• 50.0% – Psychological midpoint
• 61.8% – Golden zone (high probability bounce/reversal area)
• 78.6% – Deep correction zone
Traders use these levels to spot potential support and resistance zones.
⸻
What AutoFibGauge Does:
• Automatically finds recent swing points
• Plots Fibonacci retracement levels instantly
• Highlights important reaction zones like 38.2%, 50%, 61.8%
• Updates dynamically as the market evolves
⸻
How I Use It:
1. Identify if price is reacting to key Fib levels (like 0.382 or 0.618)
2. Combine with trend confirmation (like QMA or Parabolic SAR)
3. Plan entries, exits, and stop-loss around these Fib zones
This saves time and removes the guesswork!
⸻
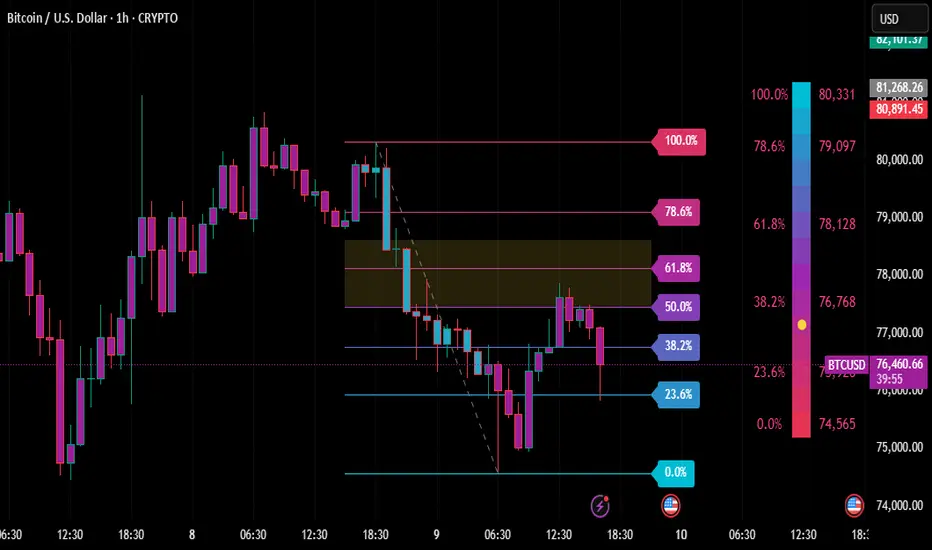
Real Example (BTC/USD 1H Chart):
• After a strong fall, AutoFibGauge plotted the Fibonacci zones automatically.
• Price reacted perfectly near the 61.8% and 78.6% retracement areas.
• These zones act as high-probability reversal or continuation areas.
⸻
I’m using the AutoFibGauge indicator (available free under TechnoBlooms on TradingView).
If you’d like the direct link or help setting it up, feel free to comment below or DM me!
⸻
Tap LIKE ❤ & FOLLOW ➕ if you found this helpful! More trading tools and strategy tips coming soon!
⸻
#BTCUSD #Bitcoin #AutoFibGauge #FibonacciTrading #TechnicalAnalysis #PriceAction #TradingTools #LearnTrading #CryptoTrading #ForexStrategy
Support and Resistance part 2Support or resistance is determined by whether price is above or below the level identified by the trader. Generally, a trader can think of support being levels below price whereas resistance is formed above price. Levels of support and resistance can be formed in a few different ways.

Support and Resistance part 1In trading, "support" and "resistance" refer to price levels where a stock or asset's price is more likely to stop falling (support) or rising (resistance), acting as potential floors and ceilings, respectively.

Management and PsychologyAn understanding of psychological principles can profoundly enhance managerial capabilities. Recognising the various factors that influence human behaviour—including biases, perception, and social dynamics—enables managers to foster an environment that promotes efficiency, innovation, and well-being among team members.

Database trading InfluxDB is a high-performance, purpose-built time-series database designed for real-time analytics. It boasts low-latency writes, efficient storage, and a powerful query engine tailored for event-driven systems like algorithmic trading.

Candle sticks pattern analysis part-2The bullish engulfing pattern and the ascending triangle pattern are considered among the most favorable candlestick patterns. As with other forms of technical analysis, it is important to look for bullish confirmation and understand that there are no guaranteed results.

MACD trading techniquesThe Moving Average Convergence Divergence (MACD) is a technical analysis indicator used to identify potential buy and sell signals by analyzing the relationship between two exponential moving averages (EMAs) of a security's price, typically a 12-period and a 26-period EMA.

database trading Database trading involves the exchange of data assets, which can include raw data, processed data, or access rights to specific datasets.
Database trading refers to the buying and selling of databases or data-related products, often for financial or commercial purposes, encompassing large datasets, data assets, or rights to access specific data.

Database Trading AnalysisDatabase trading refers to the buying and selling of databases or data-related products, often for financial or commercial purposes, encompassing large datasets, data assets, or rights to access specific data.

Importance of RSIThe Relative Strength Index (RSI) is a crucial momentum indicator in technical analysis, helping traders identify potential overbought or oversold conditions and gauge the strength of price movements, ultimately aiding in making informed trading decisions

Divergence based tradingDivergences are identified by using charting techniques. This involves tracking the highs and lows of a price chart and that of an indicator and identifying if they are making higher highs and higher lows, which is a classic bullish pattern, or lower highs and lower lows, which is a bearish pattern.

basic of support and resistanceSupport occurs at the point where a downtrend is expected to pause due to a concentration of demand. Resistance occurs at the point where an uptrend is expected to pause due to a concentration of supply. Support and resistance areas can be identified on charts using trendlines and moving averages.

Catch Trends Early with Parabolic SAR + QMA combo!Title:
Catch Trends Early with Parabolic SAR + QMA Combo! 🚀 (BTC/USD Example)
⸻
Here’s a simple but powerful trend-following strategy I personally use — combining Parabolic SAR with Quantum Moving Average (QMA).
Works great on Bitcoin, Gold, Nifty, and other trending assets.
⸻
How it Works:
1. Identify the Trend:
• When price is below QMA and Parabolic SAR dots are above price → strong downtrend
• When price is above QMA and Parabolic SAR dots are below price → strong uptrend
2. Confirm Entry After Reversal:
• Wait for price to close above QMA and SAR dots flip below price for a long setup
• Wait for price to close below QMA and SAR dots flip above price for a short setup
⸻
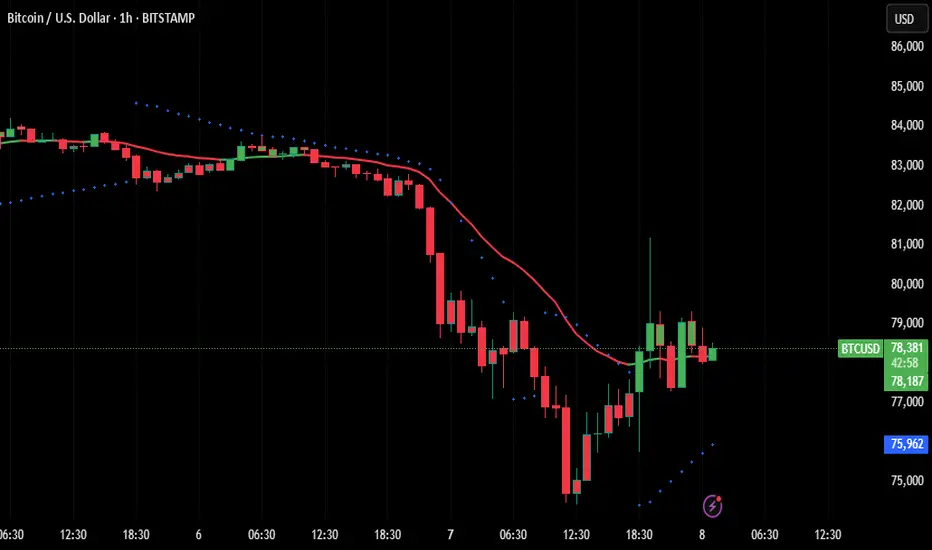
Real Example (BTC/USD 1H Chart):
• After a heavy downtrend, price broke above QMA and Parabolic SAR flipped below.
• This suggests a possible early trend reversal toward the upside.
If the setup holds, BTC could move back toward higher fib levels or supply zones.
⸻
Why I Love This Combo:
• Easy visual confirmation (SAR dots + moving average)
• Works well on 1H and 4H charts for swing trading
• Filters out false breakouts and sideways chop
⸻
Backtest this simple combo on your favorite assets and see the magic!
⸻
Found this helpful? Tap LIKE ❤ & FOLLOW ➕ for more strategies shared weekly!
⸻
#BTCUSD #Bitcoin #ParabolicSAR #TrendFollowing #TradingStrategy #QMA #TechnicalAnalysis #PriceAction #ForexStrategy #CryptoTrading
Divergence explanationIn a general sense, "divergence" means moving apart or becoming different, whether in terms of physical objects, ideas, or mathematical concepts. In mathematics, it specifically refers to the rate at which a vector field expands or contracts at a point.

How to learn trading ?#1 Decide What Type of Trader You Want to Be.
#2 Research Brokerages and Choose One Suitable for You.
#3 Open a Brokerage Account and Fund it.
#4 Research the Stocks You Want to Own.
#5 Place Your Order to Buy or Sell Stocks.
#6 Manage Risk.
The Bottom Line.

Database Trading**Database trading** refers to the process of buying and selling databases or data-related products, often for financial or commercial purposes. This could involve trading large datasets, data assets, or even the rights to access and use specific data. In financial contexts, it could also refer to trading information or algorithms derived from data for making investment decisions. Here's a breakdown of how database trading works and its typical applications
