Option Trading Master class Part -7Fundamentals of Stock Investing
Types of Investors:
Value Investors: Focus on undervalued companies
Growth Investors: Target high-growth potential stocks
Dividend Investors: Prefer regular income from dividends
Research Parameters:
Earnings per Share (EPS)
Price-to-Earnings Ratio (P/E)
Return on Equity (ROE)
Debt-to-Equity Ratio
Industry Trends
Tools for Investing:
Demat and Trading Account
Research Platforms (e.g., TradingView, Screener.in)
Portfolio Tracker (e.g., Zerodha Console)
X-indicator

Option Trading Master classIntroduction to Investing and Option Trading
Investing and option trading are two pillars of wealth creation and risk management in modern finance. Investing focuses on long-term growth by acquiring assets that appreciate over time, while option trading involves strategic bets on price movements within a defined period using derivative contracts. Together, they offer investors a combination of growth, income, and hedging capabilities.
What is Investing?
Definition:
Investing is the process of allocating money into financial instruments (like stocks, bonds, ETFs, or real estate) with the expectation of generating a return over time.
Key Objectives:
Wealth accumulation
Passive income generation
Capital preservation
Beating inflation
Common Asset Classes:
Equity (Stocks): Ownership in companies
Fixed Income (Bonds): Lending capital to earn interest
Real Estate: Physical properties generating rental income
Mutual Funds/ETFs: Pooled investments
Commodities and Gold: Inflation hedges

Institution Master class Welcome to the Institution Trading Master Class, an advanced educational module crafted for serious traders and investors who want to understand how big institutions trade, move markets, and manage risk at scale. This course blends practical market experience with strategic tools and institutional concepts.
📘 Page 1: Understanding Institutional Trading
🔹 What is Institutional Trading?
Institutional trading refers to market activities performed by large entities like:
Mutual Funds
Pension Funds
Hedge Funds
Insurance Companies
Foreign Institutional Investors (FIIs)

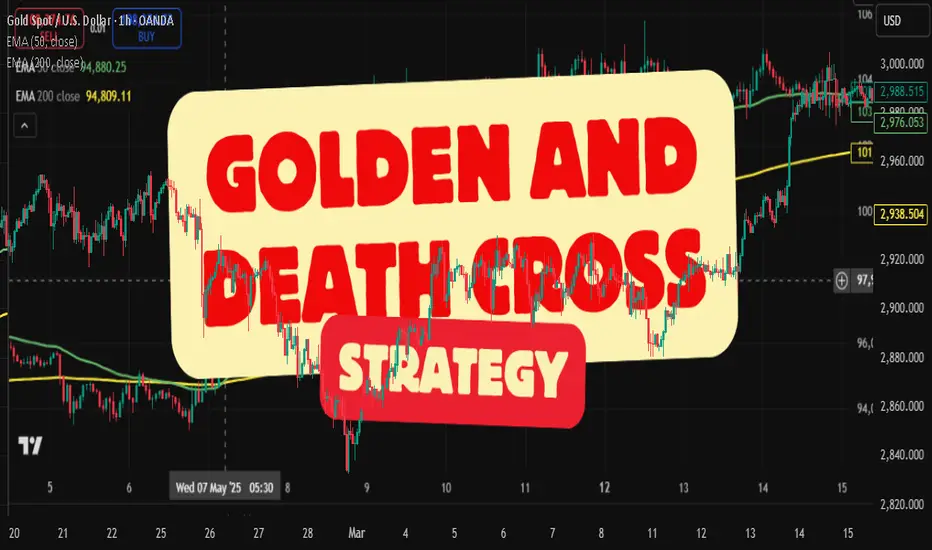
Golden and Death Cross Strategy....📌 GOLDEN CROSS AND DEATH CROSS – A Classic Trend Signal
WHAT IS A GOLDEN CROSS?
A golden cross occurs when a short-term moving average (typically 50 EMA) crosses above a long-term moving average (typically 200 EMA).
This is widely seen as a bullish signal, indicating a potential long-term trend reversal to the upside.
💡 It often signals that momentum is shifting from bearish to bullish.
WHAT IS A DEATH CROSS?
A death cross is the opposite — it forms when the short-term moving average crosses below the long-term moving average.
It is considered a bearish signal, warning of a potential downtrend or trend exhaustion.
📊 APPLICATION IN TRADING
* Works well in trending markets, especially on higher timeframes such as daily or weekly
* Can be used in combination with volume, RSI, or MACD for confirmation
* False signals can occur in sideways or choppy markets
🛠️ STRATEGY TIPS
* Use golden cross to look for long setups
* Use death cross to consider shorting or exiting long positions
* Combine with risk management — no signal is perfect
💬 YOUR THOUGHTS?
Do you use golden and death crosses in your strategy? Share your insights in the comments
👇👇👇
📝 Disclaimer: This is for educational purposes only and not financial advice. Always do your own research and manage your risk.
Institution Option Trading Part-3How Option Database Trading Works (Step-by-Step)
Step 1: Data Collection
Real-time data from NSE, BSE, CBOE, or broker APIs (Zerodha, Interactive Brokers, etc.).
Store tick-level or EOD snapshots into SQL/NoSQL databases.
Step 2: Data Cleaning & Normalization
Remove missing values, align timestamps, convert formats.
Normalize values like IV to make models consistent.
Step 3: Exploratory Data Analysis (EDA)
Use Python (Pandas, Matplotlib) or R to analyze:
Option volume spikes
Volatility contraction/expansion
Unusual OI build-ups
Step 4: Backtesting Trading Strategies
Strategies like Straddle, Strangle, Iron Condor, or IV Crush are tested.
Entry/exit logic coded, and trades simulated on historical data.
Step 5: Deploying Models
Successful strategies get automated using APIs or Trading Bots.
Regular performance metrics tracked and refined.

Trading Road Map 1. Foundation Stage (Beginner Level)
Understand Markets: Equity, Commodity, Forex, Derivatives
Basic Concepts: What is a stock, index, option, futures
Learn Platforms: TradingView, Zerodha, Upstox
Risk Awareness: Avoid FOMO, control emotions, capital safety
🔹 2. Skill Building Stage (Intermediate Level)
Technical Analysis: Charts, Patterns, Indicators (MACD, RSI, Moving Averages)
Fundamental Analysis: Earnings, Balance Sheets, PE ratio
Paper Trading: Practice without risking money
Journaling: Track trades, wins/losses, and learn from mistakes
🔹 3. Strategy Development (Advanced Level)
Create Systems: Scalping, Swing, Positional
Options Mastery: Strategies like Iron Condor, Straddle, Spread
Risk Management: Position sizing, SL rules, R:R ratio
Backtesting: Validate your strategy on historical data
🔹 4. Execution & Scaling (Pro Level)
Discipline & Psychology: Stick to plans, stay unemotional
Automation & Tools: Algo Trading, Screeners
Capital Scaling: From ₹10K to ₹10L+ systematically
Diversification: Trade across assets, build passive income

Trading with Experts What is Option Trading?
Option trading is a financial strategy where traders buy and sell options contracts — financial instruments that derive value from underlying assets like stocks or indices. Each option gives the buyer the right (not obligation) to buy (Call) or sell (Put) at a specified price before expiry.
🔹 Types of Options:
Call Option – Right to Buy
Put Option – Right to Sell
Index Options – Based on Nifty, Bank Nifty, etc.
Stock Options – Based on individual stocks (e.g., Reliance, HDFCBANK)
🔹 Key Components:
Strike Price – Agreed price to buy/sell
Premium – Price paid for the option
Expiry Date – Validity of the contract
Lot Size – Fixed quantity of shares per contract
ITM, ATM, OTM – In-the-money, At-the-money, Out-of-the-money
🔹 Why Trade Options?
✅ Leverage with less capital
✅ Hedging portfolio risk
✅ Strategic plays (Bullish, Bearish, Neutral)
✅ Income generation via selling options

Option Trading Master ClassOption Trading Master Class – Overview
🔹 Module 1: Basics of Options
What are Options? (Call vs Put)
Terminologies: Strike Price, Premium, Expiry, Lot Size
European vs American Options
🔹 Module 2: Options Pricing & Greeks
Intrinsic vs Extrinsic Value
Option Greeks: Delta, Gamma, Theta, Vega, Rho
How volatility affects option price
🔹 Module 3: Strategies for Beginners
Covered Call, Protective Put
Bull Call Spread, Bear Put Spread
Pros & Risks of each strategy
🔹 Module 4: Advanced Strategies
Iron Condor, Straddle, Strangle
Butterfly Spreads, Calendar Spreads
Adjusting positions for risk
🔹 Module 5: Live Market Application
Using Option Chain Analysis
Open Interest & Volume Interpretation
Entry/Exit points with technical support
🔹 Module 6: Psychology & Risk Management
Avoiding overtrading & expiry traps
Position sizing, SL rules
Emotional discipline in volatile markets

Option Trading with Option chainIf you're looking for a simple options trading definition, it goes something like this: Options trading gives you the right or obligation to buy or sell a specific security on or by a specific date at a specific price. An option is a contract that's linked to an underlying asset, such as a stock or another security.
Options trading also involves two parties: the holder (buyer) and the writer (sometimes called the seller). Holders are investors who purchase contracts, while writers create them. The holder pays the writer a premium for the right to sell or buy a stock by a certain date.

Technical Cass 9Hammer:
Doji :
Three-white soldiers:
Bullish Engulfing:
Tweezer Bottom:
How to confirm candlestick pattern?
Here are two reliable methods for confirming candlestick patterns with indicators:
MACD: A bullish crossover occurring alongside a bullish candlestick strengthens the case for upward movement.
RSI: Divergence between price and RSI can signal potential reversals, especially when aligned with candlestick patterns.

Learn Institutional options trading Part-4SEBI Regulations & Reforms
SEBI has made multiple reforms to ensure safe and transparent options trading:
Peak Margin Requirements – Traders must maintain full upfront margin.
Ban List – Illiquid stock options are periodically banned.
Lot Size Revisions – To control leverage and speculation.
Options Chain Transparency – Exchanges provide real-time data.
Investor Education Initiatives – Workshops, certifications, and sandbox testing.
Risks in Options Trading'
Options can generate high rewards, but they carry significant risks, especially if misused without understanding.
Key Risks:
Premium decay
Volatility risk
Leverage risk
Liquidity issues in stock options
Wrong position sizing
SEBI has introduced risk-mitigation measures, such as margin rules and banning of certain contracts for illiquid stocks.

Learn Institutional options trading Part-5Future of Options Trading in India
What Lies Ahead:
More weekly expiries (e.g., MIDCPNIFTY)
Improved retail education
Stricter compliance and reporting
Rise in algo trading and automation
Integration with global exchanges (GIFT City)
With platforms like NSE IFSC, Indian traders may soon get access to international stock derivatives from Indian soil.

Learn Institutional options trading Part-6Psychology & Discipline in Options Trading
Success in options requires:
Defined trading plan
Strict risk-reward ratio
Avoiding revenge trades
Avoiding overtrading on expiry days
Regular review and journaling of trades
Emotional control and discipline are more important than strategy in consistent profitability.

India’s Growth Story & Sectoral RotationTopic: India’s Growth Story & Sectoral Rotation
Slide 1: Introduction to India’s Growth Story
India is one of the world’s fastest-growing major economies. With strong demographics, reform-driven policies, and rising consumption, India is projected to become the third-largest economy by 2030.
Key Drivers of Growth:
Youth population & rising middle class
Government capex & infrastructure push
Tech innovation & digital economy
Global supply chain diversification (China+1)
Slide 2: Macroeconomic Tailwinds
✅ Stable GDP growth (6.5–7.5% range)
✅ Controlled inflation & improving fiscal health
✅ Strong forex reserves
✅ Structural reforms (GST, IBC, PLI schemes)
✅ FDI inflows & domestic manufacturing boost
Slide 3: Understanding Sectoral Rotation
Sectoral rotation is the shift in investor preference from one sector to another based on economic cycles, interest rates, or valuation changes. Smart investors track these rotations to maximize returns.
Why It Matters:
Not all sectors perform at the same time
Aligns portfolio with macro & earnings trends
Helps avoid underperforming sectors
Slide 4: Economic Cycle vs. Sector Performance
Economic Phase = Leading Sectors
Early Recovery = Auto, Capital Goods
Mid Expansion = Banking, Infra, IT
Peak FMCG, = Pharma
Slowdown Utilities, = Healthcare
Rotation typically happens quarterly to annually, often influenced by budget, RBI policy, and global cues.
Slide 5: Recent & Future Sector Trends
2023-2024 Themes:
Capital Goods & Infra: Capex surge
PSU Banks: Balance sheet revival
Defence & Railways: Govt-led spending
IT & FMCG: Facing margin pressure, expect rotation soon
Green Energy & EV: Emerging megatrends
2025 Outlook:
Watch for rotation into Financials, Consumption, Manufacturing, and selective Midcaps as earnings visibility improves.
Slide 6: Smart Investment Strategies
🔹 Use Sectoral/Thematic Mutual Funds or ETFs
🔹 Monitor quarterly earnings and sectoral updates
🔹 Combine with Smart SIP & dynamic asset allocation
🔹 Stay updated with policy announcements (Union Budget, RBI)
Smart SIP Strategy & Mutual Fund SelectionTopic: Smart SIP Strategy & Mutual Fund Selection
Slide 1: Introduction to Smart SIP Investing
A Systematic Investment Plan (SIP) helps investors build wealth gradually by investing fixed amounts in mutual funds at regular intervals. A “Smart SIP” goes beyond just monthly investing — it optimizes fund selection, timing, and asset allocation for better returns with lower risks.
Slide 2: What is a Smart SIP?
Traditional SIP vs. Smart SIP:
Traditional SIP invests the same amount monthly, regardless of market condition.
Smart SIP adjusts the investment amount based on market volatility, valuation, or technical indicators.
Smart SIP Components:
Dynamic contribution (more in dips)
Tactical asset allocation (equity, debt, gold)
Fund rebalancing every 6–12 months
Slide 3: Benefits of Smart SIP
✅ Enhances returns through market timing
✅ Reduces downside risk during bear phases
✅ Better rupee cost averaging
✅ Psychological edge (disciplined but flexible investing)
Slide 4: Mutual Fund Selection Criteria
When choosing funds, consider:
Category (Large-cap, Flexi-cap, Mid-cap, etc.)
Fund Manager Performance (Consistency over 3–5 years)
Expense Ratio (Lower = better returns)
Portfolio Quality (Diversification, sector exposure)
Fund Ratings (Morningstar, CRISIL, Value Research)
Slide 5: Types of Funds to Combine in a Smart SIP
Large Cap Fund – Stability & consistent returns
Flexi-Cap Fund – Dynamic across market cap
Mid/Small Cap Fund – Higher growth (add with caution)
Debt Fund – Hedge during market volatility
Thematic/Sectoral Fund – Optional, high-risk/high-reward
Slide 6: Ideal Smart SIP Strategy
🔹 Step 1: Allocate based on age & risk profile
🔹 Step 2: Use staggered investing — more in market dips
🔹 Step 3: Track fund performance quarterly
🔹 Step 4: Rebalance portfolio every 6–12 months
🔹 Step 5: Exit or reduce allocation when valuations are extreme
Open Interest & Option Chain Analysis Topic: Open Interest & Option Chain Analysis
1: What is Open Interest (OI)?
Simple Meaning:
Open Interest means the total number of active option or futures contracts in the market that haven’t been closed yet.
Easy Example:
If you and your friend enter into a new option trade, the open interest is 1. If someone else joins with a new trade, it becomes 2. But if you close your trade, it becomes 1 again.
What It Tells You:
If OI is increasing, more people are joining the market.
If OI is decreasing, traders are exiting their trades.
Combine OI with Price Movement:
Price going up + OI going up = New buying → Bullish
Price going down + OI going up = New selling → Bearish
Price going up + OI going down = Traders exiting shorts → Short covering
Price going down + OI going down = Traders exiting longs → Profit booking
2: What is an Option Chain?
Simple Meaning:
Option Chain is a table that shows all the call and put options for a stock at different strike prices.
What You’ll See in an Option Chain:
Strike Price: The price you agree to buy/sell.
Calls (CE): Right to buy.
Puts (PE): Right to sell.
Open Interest (OI): How many contracts are active.
Volume: How many were traded today.
LTP: Latest price of that option.
3: How to Read Option Chain Like a Pro
1. Spot the Support Levels:
Look for the highest OI on the put (PE) side → Big money sees this as support.
2. Spot the Resistance Levels:
Look for the highest OI on the call (CE) side → Traders think price won't go above this.
3. Track Market Mood:
If more puts are being written (PE OI going up) → Traders are bullish.
If more calls are being written (CE OI going up) → Traders are bearish.
4. PCR (Put Call Ratio):
PCR > 1 → More puts than calls = Bullish
PCR < 1 → More calls than puts = Bearish

Advance Institutions Option Trading - Lecture 3Options trading might feel like gambling on a single trade, but informed decisions make it fundamentally different. Reckless trading without a plan can resemble gambling but is not the proper way to trade. With discipline and skill, options trading stands apart from luck-based activities.
Options involve risk and are not suitable for all investors. Certain requirements must be met to trade options. Before engaging in the purchase or sale of options, investors should understand the nature of and extent of their rights and obligations and be aware of the risks involved in investing with options.

Advance Institutions Option Trading - Lecture 1Institutional traders are professionals trading for large entities like mutual funds, hedge funds, etc. Oftentimes they will trade options to hedge their positions, but they may also trade options as pure speculation.
Equirus Securities is one of the leading domestic institutional equities brokerage firms in India with more than 180 companies under over coverage and empanelment with almost all domestic institutions and many leading FIIs.

Option Chain AnalysisTo read an options chart effectively, consider the following steps:
Identify the strike price associated with each line on the chart.
Observe the direction and steepness of the lines to gauge the options' delta values. ...
Assess the options' positions concerning the current market price of the underlying asset.

Basic to Advance in Trading Understand market trends and patterns.
Use risk management strategies, like setting stop-loss orders.
Focus on liquid assets with high volume.
Keep emotions in check and stick to a trading plan.
Limit the number of trades to manage risk.
Constantly educate yourself on market dynamics and trading strategies.

Class for Advanced Trader part 2To understand how to become a trader, follow these seven steps:
Complete your education. ...
Learning the basics of trading. ...
Determine the product in which you want to trade. ...
Develop trading techniques. ...
Gain trading experience. ...
Understand risk management. ...
Review your trades.

Class for Advanced Trader Advanced trading strategies usually involve multiple technical indicators and more complicated instruments, such as options and futures.

Put Call Ratio (PCR) Trading The Put Call Ratio (PCR) is a tool in the stock market to understand how investors feel about a stock or the market's future. It compares the number of put options to call options traded. More puts traded mean investors expect prices to fall (bearish). More calls traded mean investors expect prices to rise (bullish).
