Risk Management vs Position Sizing in Option Trading1. Introduction to Risk Management in Option Trading
Risk management refers to the strategies and techniques traders use to minimize potential losses and protect their capital. In simple terms, it’s the process of deciding how much risk you are willing to take on each trade and how to respond when the market moves against you.
Option trading is inherently riskier than traditional stock trading because of leverage, time decay, and volatility sensitivity. Without a sound risk management plan, even the most skilled traders can wipe out their capital quickly.
Key Objectives of Risk Management
Capital Preservation – Protect your trading capital from large drawdowns.
Consistent Returns – Maintain a stable equity curve with controlled risk exposure.
Psychological Stability – Reduce emotional stress by limiting large unexpected losses.
Longevity in the Market – Survive long enough to benefit from the law of large numbers and experience.
2. Importance of Risk Management in Options
Options are leveraged instruments, meaning small price changes in the underlying asset can result in large percentage gains or losses in the option’s value. This amplifies both potential profits and potential risks.
Consider this scenario:
You buy a call option for ₹100 (premium) on NIFTY.
If NIFTY moves in your favor, the option could rise to ₹200 — a 100% return.
If NIFTY falls, your option could drop to ₹20 or even expire worthless — an 80–100% loss.
Without managing your risk per trade, such swings can lead to emotional trading, over-leveraging, and account blowouts.
Core Components of Option Risk Management
Defining Maximum Risk Per Trade – Most professionals risk 1–2% of total capital per trade.
Setting Stop-Loss Levels – Determine the exit point where losses are capped.
Diversification – Spread exposure across different stocks, sectors, or strategies.
Volatility Consideration – Manage trades based on implied and historical volatility levels.
Risk-Reward Ratio – Ensure that the potential reward is at least twice the risk (2:1 ratio).
Hedging – Use opposite positions (like protective puts) to reduce overall portfolio risk.
3. The Relationship Between Risk Management and Position Sizing
Risk management and position sizing are two sides of the same coin.
Risk management answers “How much can I afford to lose?”
Position sizing answers “How big should my trade be?”
Key Relationship:
Risk per trade defines the maximum acceptable loss.
Position sizing translates that risk into number of contracts.
Together, they ensure that no single trade can cause significant damage to your account, maintaining capital stability and emotional discipline.
4. Why Traders Fail Without These Concepts
Most new option traders focus entirely on predicting market direction, ignoring money management. They trade too large, too often, and without structured risk control.
Common reasons for failure include:
Over-leveraging (too many lots for account size)
No stop-loss or adjustment strategy
Risking inconsistent amounts per trade
Emotional revenge trading after losses
Ignoring volatility and time decay
By applying consistent position sizing and risk management rules, traders can survive losing streaks and remain profitable long-term, even with a win rate as low as 40–50%.
5. Types of Risks in Option Trading
Before applying risk management, traders must understand the different types of risks involved in option trading:
a. Market Risk
The risk of losing money due to adverse price movements in the underlying asset.
b. Volatility Risk
Changes in implied volatility (IV) affect option premiums. A sudden drop in IV can cause losses even if the price moves favorably.
c. Time Decay Risk (Theta)
Options lose value over time, especially as they approach expiry. Holding long options without movement can lead to gradual losses.
d. Liquidity Risk
Low open interest or volume can make it difficult to exit positions at fair prices.
e. Execution Risk
Delays or slippages during trade entry or exit can increase actual losses beyond planned levels.
Understanding these risks helps traders plan position size and protective measures accordingly.
6. Risk Management Techniques in Option Trading
a. Use of Stop-Loss Orders
Set stop-loss levels based on technical indicators, volatility bands, or fixed percentage loss.
Example: Exit if the option premium drops 30–40% below entry.
b. Hedging Positions
Offset risk with opposite positions:
Long stock + long put = protective hedge
Short call + long call (spread) = limited loss
c. Strategy Selection
Use defined-risk strategies like spreads, straddles, and butterflies instead of naked options. This caps potential losses upfront.
d. Diversification Across Trades
Avoid placing all capital on a single stock or index. Diversify across:
Different sectors
Expiry dates
Strategy types (e.g., spreads, iron condors, strangles)
e. Portfolio Risk Management
Monitor total portfolio exposure instead of individual trades.
Limit total open risk to no more than 10–15% of trading capital.
7. Psychological Role of Risk and Position Sizing
Trading psychology plays a significant role in executing these principles. When traders know their maximum loss upfront, it reduces anxiety and prevents panic decisions.
Proper position sizing allows traders to trade objectively, even during volatile periods.
Benefits include:
Increased confidence
Better emotional control
Reduced overtrading
More consistent performance
Advanced Risk Management Tools for Option Traders
Greeks Management – Use delta, gamma, theta, and vega to manage exposure dynamically.
Portfolio Margining – Optimize capital usage by evaluating net exposure.
Scenario Analysis – Simulate market movements and estimate potential losses.
Stop-Loss Automation – Use algorithmic or rule-based systems to exit losing trades swiftly.
Volatility Filters – Avoid trading during excessive volatility or major news events.
8. The Compounding Power of Controlled Risk
Consistent position sizing with controlled risk leads to geometric capital growth.
For example, if you risk 1% per trade with a 2:1 reward-to-risk ratio and maintain 50% accuracy, your capital will grow steadily.
The Math Behind It
Over 100 trades:
50 winners × 2% gain = +100%
50 losers × 1% loss = -50%
Net Gain = +50% with disciplined risk and sizing
This demonstrates that consistent risk management is more important than win rate.
9. Common Mistakes to Avoid
Risking too much on one trade
Ignoring correlation between positions
Overtrading after a winning streak
Refusing to cut losses early
Neglecting volatility effects on options
Avoiding these mistakes ensures steady progress and capital safety.
10. Integrating Risk Management & Position Sizing into a Trading Plan
A professional trading plan should include:
Defined capital allocation for each strategy.
Maximum risk per trade and per day/week.
A clear position sizing formula.
Stop-loss and target guidelines.
Rules for scaling in/out of trades.
Performance review metrics (risk-adjusted returns).
Conclusion
Risk management and position sizing are the twin pillars of success in option trading. While strategy selection determines what to trade, risk management determines how much to trade and how to survive in the long run.
A trader who risks 1–2% per trade and sizes positions properly can withstand market volatility, endure losing streaks, and steadily grow wealth through compounding.
Ultimately, trading is not about predicting the future — it’s about managing uncertainty. The traders who master risk and position sizing don’t just survive — they thrive.
X-indicator
Part 12 Trading Master ClassMastering the Art of Option Trading
Option trading blends mathematics, psychology, and market logic. It’s not just about predicting direction but understanding probabilities, risk management, and timing. Successful traders treat options as tools for strategic advantage — not gambling tickets.
In essence:
Options = Flexibility + Leverage + Protection.
They empower traders to define risk, hedge intelligently, and profit across market cycles.
But to master them, one must study pricing models, volatility behavior, and trade discipline.
Whether you’re a hedger protecting a portfolio or a speculator chasing momentum, options are the bridge between risk and opportunity — making them one of the most powerful innovations in modern financial markets.

Part 11 Trading Master ClassWhat Is Option Trading?
Option trading is a form of derivatives trading, where investors buy or sell contracts that give them the right but not the obligation to buy or sell an underlying asset (such as stocks, indices, or commodities) at a predetermined price before or on a specific date.
Unlike stocks, which represent ownership in a company, options represent a financial contract derived from the price movement of another asset — hence, they are part of the derivatives market.
There are two main types of options:
Call Options: Give the holder the right to buy an asset at a set price.
Put Options: Give the holder the right to sell an asset at a set price.
Each option contract involves:
Strike Price: The agreed-upon price for buying/selling the asset.
Expiry Date: The last date the option can be exercised.
Premium: The price paid to buy the option.

Part 2 Trading Master Class With ExpertsHow Option Trading Works
Let’s take a practical example:
Suppose you buy a Nifty 50 Call Option with a strike price of ₹22,000, expiring in one month, by paying a premium of ₹100 per lot (lot size 50).
If Nifty moves up to 22,500 before expiry — your call option becomes profitable because you can buy at 22,000 (strike) and sell at 22,500 (market price).
If Nifty falls to 21,800 — your option becomes worthless, and you lose only the ₹100 premium.
In short, your risk is limited to the premium paid, but your profit potential is unlimited (for call buyers).
Similarly, for a put option, profits come when the market goes down.

Part 3 Learn Institutional TradingKey Terminologies in Option Trading
Before diving deeper, let’s understand a few critical terms:
Strike Price: The predetermined price at which the option can be exercised.
Premium: The price you pay to buy the option contract.
Expiry Date: The date on which the option contract ends.
In-the-Money (ITM): When exercising the option is profitable.
For Calls: When market price > strike price.
For Puts: When market price < strike price.
Out-of-the-Money (OTM): When exercising the option is not profitable.
At-the-Money (ATM): When the market price equals the strike price.
Lot Size: Options are traded in predefined quantities called lots.
Underlying Asset: The stock, index, or commodity on which the option is based.
These basics are the building blocks for understanding how profits and losses are calculated.

Part 1 Ride The Big Moves Introduction to Options Trading
Options trading is one of the most fascinating and flexible instruments in the financial market. It allows traders and investors to speculate, hedge, and generate income — all from the same market tool.
An option is a financial derivative — meaning its value is derived from an underlying asset, such as stocks, indices, commodities, or currencies. Options are contracts that give the buyer the right, but not the obligation, to buy or sell an asset at a specific price (called the strike price) before or on a particular date (called the expiry date).
In essence, options trading helps investors control large positions with relatively smaller amounts of capital while limiting risk when used correctly.

Momentum Trading Secrets: Unlocking the Market’s Hidden Energy1. The Science of Momentum
Momentum trading is rooted in behavioral finance and market psychology. It leverages the tendency of investors to underreact or overreact to new information, creating sustained price moves. The basic scientific principle can be summarized as:
“Assets that have performed well recently are likely to continue performing well in the near future, and vice versa.”
Key aspects include:
Trend Identification: Momentum traders look for assets with strong directional movement.
Rate of Change (ROC): Calculating how fast an asset’s price is changing helps determine momentum strength.
Volume Confirmation: High trading volume validates the sustainability of a trend.
Behavioral Patterns: Fear and greed amplify trends, making momentum strategies more predictable.
2. Tools and Indicators in Momentum Trading
Momentum traders rely heavily on technical indicators to gauge the strength of a move. Some of the most effective tools include:
Relative Strength Index (RSI): Measures overbought or oversold conditions to anticipate potential trend continuations or reversals.
Moving Average Convergence Divergence (MACD): Helps identify trend direction and momentum shifts.
Stochastic Oscillator: Useful for spotting trend reversals or continuation signals in volatile markets.
Volume Weighted Average Price (VWAP): Indicates the average price weighted by volume, often used by institutional traders to confirm momentum.
Rate of Change (ROC): Measures the percentage change in price over a specific period, signaling momentum strength.
The secret lies in combining indicators rather than relying on one. For example, using RSI for trend strength and MACD for entry timing often produces higher-probability trades.
3. Secrets to Identifying True Momentum
Not all price movements represent genuine momentum. The following secrets help distinguish real trends from false signals:
Look Beyond the Noise: Small price fluctuations are often misleading. True momentum comes with consistent directional moves and high volume.
Time Frame Alignment: Momentum should be confirmed across multiple time frames. A short-term uptrend in a long-term downtrend can be risky.
Sector and Market Context: Stocks often move in sync with sectors. Identifying sector momentum can increase trade success.
Catalyst Awareness: Earnings reports, news events, and macroeconomic data often trigger strong momentum moves.
Volume Patterns: Sudden spikes in volume often precede sharp moves, indicating institutional participation.
4. Entry and Exit Strategies
Mastering momentum trading requires precise timing. Secrets in execution include:
Breakout Trading: Enter trades when price breaks key resistance or support levels with high momentum.
Pullback Entries: Waiting for minor retracements during a trend allows for safer entries at lower risk levels.
Trailing Stop Losses: Using dynamic stops that follow the trend ensures profits are locked in while letting winners run.
Scaling Positions: Incrementally increasing positions as momentum strengthens reduces risk exposure.
The critical secret: never fight the trend. Momentum trading is about riding the wave, not predicting reversals.
5. Risk Management Secrets
Momentum trading can be extremely profitable but also highly risky if not managed properly. Successful traders use:
Position Sizing: Limiting exposure to a small percentage of the trading account prevents catastrophic losses.
Stop Loss Discipline: Predefined exit points are crucial, as momentum can reverse quickly.
Diversification: Trading across multiple assets or sectors spreads risk while capturing diverse momentum opportunities.
Volatility Assessment: Understanding the volatility of the instrument ensures proper risk-reward alignment.
The secret is balancing aggressive profit potential with controlled risk, turning a volatile strategy into a sustainable one.
6. Psychological Edge in Momentum Trading
Momentum trading is as much about mindset as strategy. The key psychological secrets include:
Emotion Control: Fear and greed can destroy momentum trades. Sticking to rules and systems is vital.
Patience and Discipline: Waiting for the right setup rather than chasing price is a hallmark of successful traders.
Adaptability: Market conditions change. Momentum traders must adjust strategies to new trends, not rely on past performance.
Confidence vs. Overconfidence: Understanding the difference ensures consistent execution without reckless risk-taking.
7. Advanced Momentum Trading Techniques
Seasoned traders often leverage advanced techniques to amplify profits:
Sector Rotation Strategy: Moving capital into sectors showing strongest momentum while exiting weak sectors.
Pairs Trading with Momentum: Trading correlated assets by buying the stronger momentum asset and shorting the weaker.
Algorithmic Momentum Strategies: Using quantitative models to scan multiple instruments and automatically execute trades.
Options for Momentum Leverage: Using call and put options to magnify returns while managing capital efficiently.
These techniques reveal the “hidden secrets” of institutional-level momentum trading, making it more than just buying high and selling higher.
8. Common Mistakes to Avoid
Even experienced traders stumble when ignoring momentum trading rules. Common pitfalls include:
Chasing Trends Too Late: Entering after most of the move is over reduces profit potential.
Ignoring Volume: Low-volume momentum often reverses unexpectedly.
Over-Leveraging: Excessive leverage can wipe out accounts during sudden reversals.
Neglecting Market Context: Ignoring broader market trends can lead to false signals.
Awareness of these mistakes is a secret weapon in protecting both capital and confidence.
9. Case Studies of Momentum Trading Success
Momentum trading has produced legendary gains for traders who mastered its secrets. For instance:
Tech Stock Surges: Riding early momentum in high-growth tech companies during earnings announcements.
Commodity Moves: Capturing sharp momentum in oil or gold during geopolitical events.
Cryptocurrency Trends: Exploiting rapid price swings with disciplined momentum strategies.
These examples highlight that momentum trading is applicable across markets and time frames, provided the rules are followed.
10. The Future of Momentum Trading
With advancements in technology, momentum trading is evolving:
AI and Machine Learning: Algorithms can detect momentum patterns faster than human traders.
Social Sentiment Analysis: Platforms now measure crowd psychology and predict momentum based on social chatter.
High-Frequency Trading (HFT): Institutional traders use speed and algorithms to exploit tiny momentum shifts.
Traders who understand these trends and adapt their strategies will maintain a competitive edge in the future markets.
Conclusion
Momentum trading is an art backed by science. Its secrets lie not just in indicators or charts, but in understanding market psychology, managing risk, and executing trades with discipline. By mastering trend identification, entry and exit timing, and psychological control, traders can transform momentum strategies into consistent profit engines.
While momentum trading can seem risky, applying these secrets systematically turns volatility into opportunity. In today’s fast-moving markets, momentum trading remains one of the most powerful tools for traders willing to combine technical skill with strategic insight.
Intraday Trading vs Swing TradingIntroduction
Brief overview of trading in financial markets.
Importance of choosing the right trading style for profitability and risk management.
Statement of purpose: Compare intraday trading and swing trading across multiple dimensions such as time horizon, risk, capital requirements, strategy, and psychology.
1. Understanding Intraday Trading
1.1 Definition
Buying and selling financial instruments within the same trading day.
Positions are squared off before the market closes.
1.2 Characteristics
Short-term focus (minutes to hours).
High trade frequency.
Requires constant market monitoring.
1.3 Tools & Techniques
Technical indicators: RSI, MACD, moving averages, Bollinger Bands.
Chart patterns: Flags, triangles, head & shoulders.
Level 2 data, real-time market depth.
1.4 Advantages
Potential for high profits in a single day.
No overnight risk exposure.
Quick capital turnover.
1.5 Disadvantages
High stress due to rapid decision-making.
Significant brokerage and transaction costs.
Requires advanced knowledge and quick reflexes.
2. Understanding Swing Trading
2.1 Definition
Holding positions for several days to weeks to capture medium-term price movements.
2.2 Characteristics
Medium-term focus.
Fewer trades but larger profit potential per trade.
Less time-intensive compared to intraday trading.
2.3 Tools & Techniques
Technical analysis: Trendlines, support/resistance, moving averages.
Fundamental analysis: Earnings reports, sector trends, macroeconomic indicators.
Swing patterns: Breakouts, pullbacks, reversals.
2.4 Advantages
Less stressful than intraday trading.
More time to analyze and make informed decisions.
Lower transaction costs due to fewer trades.
2.5 Disadvantages
Exposure to overnight and weekend risks.
Capital is tied up longer.
Requires patience and disciplined risk management.
3. Time Horizon and Trading Frequency
Intraday: Trades last minutes to hours; multiple trades daily.
Swing: Trades last days to weeks; limited trades but larger exposure.
Impact on lifestyle: Intraday requires active screen time; swing allows more flexibility.
4. Capital Requirements
Intraday: Leverage is often used; margin requirements are smaller but risk is higher.
Swing: Requires more capital per trade due to longer holding periods and lower leverage.
Risk of capital erosion: Intraday mistakes can wipe out a day’s gains; swing mistakes can impact several days of profit potential.
5. Risk and Reward Dynamics
Intraday: High volatility can yield high rewards but also steep losses.
Swing: Moderate volatility, potential for larger cumulative gains, but exposure to overnight gaps.
Risk management strategies: Stop-loss orders, position sizing, diversification.
6. Trading Psychology
Intraday:
Requires quick decision-making and mental resilience.
Emotional discipline is crucial; fear and greed can destroy profits quickly.
Swing:
Patience is essential to ride trends.
Ability to handle temporary drawdowns without panic-selling.
7. Strategy and Analysis
Intraday Trading Strategies:
Scalping: Quick small gains.
Momentum trading: Riding strong price trends within the day.
Swing Trading Strategies:
Trend-following: Entering trades along prevailing trends.
Reversal trading: Buying dips and selling rallies.
Technical vs fundamental analysis balance: Swing trading often incorporates both; intraday is heavily technical.
8. Costs and Tax Implications
Intraday:
Higher brokerage and STT due to frequent trades.
Short-term gains taxed differently depending on jurisdiction.
Swing:
Lower trading costs.
Gains may qualify for medium/long-term capital gains benefits.
9. Suitability for Different Traders
Intraday: Best for active, risk-tolerant, experienced traders with fast decision-making skills.
Swing: Suitable for part-time traders, working professionals, and those seeking less stressful trading.
10. Technology and Tools
Intraday: Real-time charts, high-speed internet, advanced trading platforms.
Swing: Standard charting tools, technical analysis software, news alerts.
Algorithmic trading: Both can benefit but intraday relies more heavily on automated systems.
11. Performance Metrics
Intraday:
Profit per trade is smaller but cumulative daily gains can be significant.
Key metrics: Win rate, risk-reward ratio, drawdown percentage.
Swing:
Profit per trade larger due to capturing trends.
Key metrics: Holding period returns, average gain/loss, volatility capture.
12. Case Studies
Example of successful intraday trades: High-volume stocks, news-based spikes.
Example of successful swing trades: Trend-following in indices or sectoral stocks.
Comparison of returns, drawdowns, and effort required.
13. Hybrid Approaches
Combining intraday scalping with swing trading to diversify income streams.
Portfolio allocation between short-term and medium-term trades.
Pros and cons of hybrid trading.
14. Choosing Your Style
Assess your risk tolerance, time availability, capital, and psychological comfort.
Test both styles using paper trading before committing real capital.
Flexibility and adaptation to changing market conditions.
15. Conclusion
Recap of key differences: time horizon, risk, rewards, strategies, tools.
Emphasis on personal suitability over “best style.”
Encouragement to practice disciplined trading, regardless of style.

Consumption Trends in the Indian Trading Market1. Introduction
Consumption trends refer to the patterns and behaviors exhibited by consumers in terms of purchasing goods and services over time. In India, with a population exceeding 1.4 billion, consumption plays a pivotal role in driving economic growth. Retail, e-commerce, FMCG (Fast-Moving Consumer Goods), luxury goods, and digital services are some of the major sectors influenced by consumer spending patterns.
In recent years, consumption trends in India have shifted due to urbanization, rising disposable incomes, digital penetration, and changing lifestyles. Analyzing these trends provides valuable insights for traders and businesses to align their strategies with market demands.
2. Factors Driving Consumption Trends
Several macro and microeconomic factors influence consumption in India:
2.1 Rising Disposable Income
India’s growing middle class has more disposable income than ever before. With steady economic growth and higher employment rates, consumers are spending more on discretionary items like electronics, fashion, entertainment, and travel.
2.2 Urbanization
Rapid urbanization has created a surge in modern retail consumption. Tier-1 and Tier-2 cities have witnessed increased demand for branded products, premium services, and online retail platforms.
2.3 Digital Transformation
Digital technology has reshaped consumer behavior in India. E-commerce platforms such as Amazon, Flipkart, and Myntra have transformed the way people shop. Digital payments, mobile apps, and online promotions have contributed to convenience and impulse buying.
2.4 Lifestyle Changes
The younger generation, especially millennials and Gen Z, prioritize experiences over material goods. Their consumption patterns lean towards travel, wellness, fitness, and technology-driven products.
2.5 Government Policies
Government initiatives like Digital India, Make in India, and financial inclusion programs have increased accessibility to products and services across urban and rural regions, boosting overall consumption.
3. Consumption Patterns by Sector
3.1 FMCG (Fast-Moving Consumer Goods)
FMCG remains a cornerstone of Indian consumption. Staples like food, beverages, personal care products, and household goods dominate spending. Recent trends show a shift toward organic, health-oriented, and premium products.
Rising Health Awareness: Consumers prefer products with natural ingredients and low sugar/fat content.
E-commerce Impact: Online grocery shopping has surged, with platforms like BigBasket and Grofers leading the way.
3.2 E-commerce and Digital Consumption
E-commerce has revolutionized the Indian market, making products accessible beyond urban areas.
Growth of Mobile Commerce: Mobile apps drive more than 70% of e-commerce transactions.
Discount Culture: Festive sales and heavy discounts influence consumer behavior, leading to higher transaction volumes.
Niche Segments: Fashion, electronics, beauty products, and digital content subscriptions are seeing high online demand.
3.3 Luxury and Lifestyle Products
Luxury goods consumption has grown steadily among urban Indians, reflecting aspirations and status symbols.
Premium Brands: Demand for high-end automobiles, watches, and fashion brands is rising.
Experiential Consumption: People prefer experiences like fine dining, vacations, and wellness retreats over material possessions.
3.4 Technology and Electronics
Digital adoption drives significant consumption in electronics, including smartphones, laptops, and smart home devices.
Affordability: Competitive pricing of smartphones and appliances has widened consumer reach.
Integration with Lifestyle: Smart devices now complement entertainment, work, and fitness trends.
3.5 Rural Consumption
Rural India represents a massive consumption base, accounting for nearly half of total consumer spending.
Staple Goods: Food, FMCG, and agricultural products dominate.
Emerging Demand: Appliances, motorcycles, mobile phones, and digital services are becoming popular as connectivity improves.
4. Emerging Consumption Trends
4.1 Sustainability and Eco-consciousness
Consumers increasingly prefer sustainable and eco-friendly products. Brands focusing on packaging, renewable resources, and green initiatives gain trust.
4.2 Subscription-Based Models
Subscription services for streaming, meal kits, and curated products are gaining traction. Consumers appreciate convenience and customization.
4.3 Omni-channel Retail
Consumers expect a seamless experience across offline and online channels. Retailers offering click-and-collect, virtual try-ons, and personalized services are benefiting.
4.4 Experiential Spending
Experience-driven consumption, including travel, fitness, and leisure, is surpassing traditional material spending, especially among millennials.
4.5 Influence of Social Media
Social media platforms heavily influence purchasing decisions. Influencer marketing, short video apps, and online reviews have become key drivers of consumption.
5. Impact on Indian Trading Market
5.1 Growth of Retail and E-commerce
The retail sector is witnessing unprecedented growth due to changing consumption trends. Organized retail chains, supermarkets, and online platforms are expanding rapidly.
5.2 Increased Investor Interest
High consumption fuels business revenues, making sectors like FMCG, e-commerce, and technology attractive for investors. Stock performance of companies catering to changing consumer behavior is closely tied to these trends.
5.3 Supply Chain Evolution
Consumption trends are reshaping supply chain strategies. Efficient logistics, warehouse networks, and last-mile delivery are critical to meet demand.
5.4 Dynamic Pricing and Promotions
Companies adopt dynamic pricing and targeted promotions to influence buying patterns, particularly in e-commerce and FMCG sectors.
5.5 Product Innovation
Consumer expectations push companies to innovate continuously, focusing on personalization, convenience, and sustainability.
6. Challenges and Risks
Despite robust growth, consumption trends face challenges:
Economic Uncertainty: Inflation, interest rates, and global economic conditions can impact consumer spending.
Rural Penetration Barriers: Limited infrastructure and financial literacy may restrict rural consumption growth.
Regulatory Hurdles: Taxation and compliance requirements can affect pricing and margins.
Changing Preferences: Rapid shifts in consumer preferences may lead to inventory and investment risks for businesses.
7. Future Outlook
India’s consumption trends indicate a promising future for traders, investors, and companies. Key predictions include:
Rising Digital Consumption: Continued growth in e-commerce and online services.
Premiumization: Increased demand for premium, lifestyle, and health-oriented products.
Rural Market Expansion: Improved infrastructure and digital access will unlock rural consumption potential.
Sustainable Consumption: Brands focusing on eco-friendly products will capture long-term consumer loyalty.
Technology Integration: AI-driven personalization, AR/VR retail experiences, and smart devices will reshape buying patterns.
Overall, India’s consumption-driven market will remain a critical engine of economic growth, innovation, and global trading opportunities. Businesses and investors who anticipate these trends and adapt accordingly are likely to gain a significant competitive advantage.
8. Conclusion
The Indian trading market is evolving rapidly, with consumption trends at its core. From urban tech-savvy buyers to rural emerging consumers, the diversity of preferences demands that traders and companies remain agile. Understanding these trends enables businesses to innovate, investors to strategize, and policymakers to facilitate sustainable growth.
India’s consumption story is one of opportunity, fueled by demographic advantage, technological adoption, and a culture of aspiration. The next decade promises to redefine how goods and services are traded, consumed, and valued across the subcontinent.

Trends in the Equity Market1. Rise of Retail Participation
One of the most significant trends in recent years has been the surge of retail investors in the equity market. Traditionally dominated by institutional players, retail participation has grown due to:
Easy access through online trading platforms – Apps like Zerodha, Upstox, and Groww in India, and Robinhood in the US, have democratized investing.
Low brokerage fees and fractional investing – Small investors can now invest with minimal capital, diversifying their portfolios effectively.
Social media and community-driven investing – Platforms like Twitter, Reddit, and YouTube have fueled investment communities, leading to phenomena like meme stocks and coordinated retail rallies.
Impact: Retail participation increases market liquidity, adds volatility in certain stocks, and changes market sentiment faster than ever.
2. Technology-Driven Trading
Technological advancements have reshaped equity market operations, giving rise to new trading strategies:
Algorithmic trading: High-frequency trading (HFT) leverages algorithms to execute trades in milliseconds, impacting liquidity and price efficiency.
AI and machine learning: Predictive analytics and AI-driven stock recommendations help investors make data-backed decisions.
Blockchain and tokenized assets: Decentralized finance (DeFi) introduces tokenized stocks and fractional ownership, expanding access.
Impact: Technology accelerates decision-making, increases efficiency, and reduces human bias, but can also amplify sudden market moves during high volatility periods.
3. Sectoral Shifts and Investment Preferences
Equity markets evolve in response to macroeconomic cycles and technological innovation. Current sectoral trends include:
Technology and software: Cloud computing, AI, and fintech dominate investor attention.
Green energy and ESG: Renewable energy, electric vehicles, and ESG-compliant companies attract sustainable investment funds.
Consumer and healthcare: As disposable incomes rise and aging populations expand, consumer staples and healthcare continue to see robust growth.
Impact: Understanding sectoral shifts is crucial for portfolio diversification and identifying growth opportunities.
4. Global Influences on Domestic Markets
Equity markets no longer operate in isolation. Global factors significantly affect domestic equities:
Interest rate movements: Central bank policies in major economies influence capital flows and risk appetite.
Geopolitical developments: Conflicts, trade agreements, and sanctions can trigger sector-specific volatility.
Global economic cycles: Inflation, recessions, or commodity price swings can reshape equity valuations worldwide.
Impact: Investors must adopt a global perspective and hedge against systemic risks to protect portfolios.
5. Increased Focus on ESG Investing
Environmental, Social, and Governance (ESG) investing has moved from niche to mainstream:
Companies demonstrating strong ESG metrics often enjoy higher valuation premiums.
ESG-focused funds attract both retail and institutional money.
Regulatory frameworks in regions like Europe and India are increasingly mandating ESG disclosures.
Impact: ESG considerations now influence stock selection, corporate behavior, and long-term market trends.
6. Volatility and Market Sentiment
Equity markets are inherently volatile, but recent trends have amplified sentiment-driven fluctuations:
Behavioral finance influence: Fear, greed, and herd behavior can cause sudden price swings.
Events-driven volatility: Earnings surprises, policy changes, or economic shocks affect short-term trading patterns.
Use of derivatives: Options and futures increase market leverage, influencing volatility patterns.
Impact: Investors must combine technical analysis with market sentiment to navigate swings effectively.
7. Rise of Passive Investing and ETFs
Another major trend is the increasing dominance of passive investing:
Exchange-Traded Funds (ETFs) and index funds attract inflows due to low costs and broad market exposure.
Passive strategies reduce the influence of individual stock picking, shifting markets toward index-driven movements.
Institutional adoption of passive strategies has altered liquidity and valuation dynamics.
Impact: Passive investing has stabilized long-term returns but can lead to concentrated risk during market downturns.
8. Regulatory and Policy Trends
Government regulations play a critical role in shaping equity markets:
Capital market reforms: Simplified IPO processes, demat accounts, and trading technology have encouraged participation.
Tax incentives: Policies like long-term capital gains tax reforms influence investor behavior.
Global compliance: Regulations like MiFID II in Europe and SEBI guidelines in India ensure transparency and protect investors.
Impact: Regulatory trends influence market confidence, compliance costs, and investment strategies.
9. Market Integration and Cross-Border Investing
Investors increasingly diversify across geographies:
Mutual funds, global ETFs, and foreign portfolio investments enable exposure to international equities.
Correlation between global markets has increased; for instance, US Federal Reserve decisions affect Indian and Asian equities.
Currency fluctuations now directly impact returns for foreign investors.
Impact: Cross-border investing provides diversification but introduces currency and geopolitical risks.
10. Emerging Technologies and AI in Equity Analysis
The integration of AI and Big Data is transforming how equity markets operate:
Predictive analytics: Forecasting earnings, detecting anomalies, and assessing risk in real time.
Natural Language Processing (NLP): Analyzing news, earnings calls, and social media sentiment to predict market reactions.
Robo-advisors: Automated portfolio management using AI-driven insights.
Impact: AI reduces human error, enhances research efficiency, and allows more informed investment decisions.
11. Behavioral and Social Media Influences
Equity markets are increasingly influenced by social media trends:
Platforms like Reddit’s WallStreetBets can cause rapid price movements.
Viral investment stories often impact stocks without fundamental changes.
Public perception, amplified by social media, now drives trading behavior alongside traditional financial metrics.
Impact: Social-driven market movements highlight the importance of monitoring both fundamentals and sentiment indicators.
12. Future Outlook
The equity market continues to evolve:
Integration of technology and finance: AI, blockchain, and algorithmic trading will define market structure.
Sustainable investing: ESG and impact investing will guide corporate and investor decisions.
Global interconnectivity: Investors will increasingly need to monitor global macro trends, interest rates, and geopolitical developments.
Conclusion: Understanding trends in the equity market is crucial for successful investing. Retail participation, technological innovation, ESG focus, and global integration are reshaping how markets operate. Investors who adapt to these trends can position themselves for long-term growth while managing volatility and risk.

Market Swings, Inflation, and Interest Rates1. Market Swings: The Pulse of Financial Markets
Market swings, also known as market volatility, refer to the rapid and sometimes unpredictable fluctuations in asset prices. These swings can occur in stock markets, bond markets, commodities, or foreign exchange markets. They are driven by a combination of factors including economic data, geopolitical events, corporate earnings, investor sentiment, and macroeconomic policies.
Volatility is a natural part of financial markets. While minor fluctuations are expected, extreme swings often signal underlying instability or heightened uncertainty. For instance, a sudden drop in stock prices may be triggered by negative employment data, unexpected changes in central bank policies, or geopolitical tensions. Conversely, rapid upward swings can result from strong economic indicators, corporate profitability, or liquidity injections by central banks.
Understanding market swings requires recognizing that they are often a reflection of investor psychology as much as economic fundamentals. Fear and greed can amplify price movements, creating feedback loops that exacerbate market volatility.
2. Inflation: The Erosion of Purchasing Power
Inflation is the rate at which the general level of prices for goods and services rises, thereby eroding purchasing power. It is a critical macroeconomic variable because it directly impacts consumer behavior, corporate profitability, and investment decisions. Moderate inflation is considered healthy for the economy, as it encourages spending and investment. However, high inflation can destabilize markets, reduce real returns on investments, and create uncertainty about future economic conditions.
Inflation is measured using indices such as the Consumer Price Index (CPI) and the Producer Price Index (PPI). Persistent increases in these indices indicate that the cost of living is rising, which can lead to tighter monetary policy. For investors, rising inflation often leads to higher volatility in equities, bonds, and commodities. Certain sectors, like consumer staples and utilities, may perform relatively better during inflationary periods due to consistent demand, while growth-oriented sectors may suffer.
3. Interest Rates: The Cost of Money
Interest rates, determined primarily by central banks, represent the cost of borrowing money. They influence every aspect of the economy, from corporate investments to consumer spending. When central banks increase interest rates, borrowing becomes more expensive, which can slow economic activity. Conversely, lower interest rates encourage borrowing and investment but can also contribute to higher inflation.
Interest rates are closely tied to market swings and inflation. For example, when inflation rises unexpectedly, central banks may increase interest rates to cool down the economy. This can lead to sudden market adjustments, especially in interest-sensitive sectors such as real estate, banking, and technology. Conversely, during economic slowdowns, central banks often reduce interest rates to stimulate growth, which can drive equity markets higher.
4. The Interplay Between Market Swings, Inflation, and Interest Rates
The relationship between market swings, inflation, and interest rates is complex and cyclical. Inflation often drives central banks’ interest rate decisions, which in turn impact market volatility.
Inflation → Interest Rate Adjustment → Market Reaction: Rising inflation typically prompts central banks to increase interest rates to curb spending. This often results in market sell-offs, as higher rates increase borrowing costs for businesses and reduce consumer spending, impacting corporate profits.
Interest Rates → Market Liquidity → Market Swings: Lower interest rates generally increase liquidity in the market, encouraging investments in riskier assets like stocks and real estate. Conversely, higher interest rates can reduce liquidity, leading to increased volatility as investors reassess risk and reallocate assets.
Market Swings → Inflation Expectations → Policy Decisions: Significant market swings can influence inflation expectations. For instance, a sudden spike in commodity prices can heighten inflation fears, prompting central banks to intervene with policy adjustments.
5. Case Studies of Market Swings Influenced by Inflation and Interest Rates
The 1970s Stagflation: During the 1970s, the U.S. experienced high inflation combined with stagnant economic growth. Interest rates were raised to control inflation, leading to significant market volatility and prolonged economic uncertainty.
The 2008 Global Financial Crisis: Preceding the crisis, low-interest rates encouraged excessive borrowing and speculative investments. When the housing bubble burst, market swings were amplified, and inflationary pressures emerged briefly in certain sectors.
COVID-19 Pandemic Market Reactions: In 2020, global markets experienced extreme swings due to the pandemic. Central banks reduced interest rates to near-zero levels, injecting liquidity into markets. Inflation remained low initially but surged in 2021–2022, causing renewed volatility as central banks adjusted rates upward.
6. Sectoral Impact of Inflation and Interest Rate Changes
Different sectors respond uniquely to market swings driven by inflation and interest rates:
Technology and Growth Stocks: Highly sensitive to interest rate hikes because future earnings are discounted more heavily.
Consumer Staples and Utilities: Typically resilient during inflationary periods due to consistent demand.
Financials: Benefit from higher interest rates through improved net interest margins but may suffer if higher rates reduce loan demand.
Commodities: Often act as a hedge against inflation, but can experience volatility due to geopolitical risks and supply-demand imbalances.
7. Strategies for Investors Amid Market Swings
Investors can employ several strategies to navigate the intertwined effects of market swings, inflation, and interest rates:
Diversification: Spreading investments across sectors and asset classes reduces exposure to volatility.
Hedging: Using derivatives or inflation-protected securities to mitigate risks.
Monitoring Central Bank Signals: Paying close attention to monetary policy statements and inflation data to anticipate interest rate changes.
Value vs. Growth Balancing: Allocating between growth and value stocks based on interest rate and inflation trends.
Commodities and Real Assets: Incorporating gold, real estate, or commodities as a hedge against inflation.
8. Global Implications and Policy Considerations
The interplay of market swings, inflation, and interest rates is not confined to a single country. Global capital flows, trade dynamics, and foreign exchange markets amplify these effects across borders. For instance, interest rate hikes in the U.S. can lead to capital outflows from emerging markets, triggering currency depreciation and local market swings. Policymakers must balance inflation control with growth objectives, often navigating difficult trade-offs.
9. The Role of Technology and AI in Predicting Market Movements
Advances in technology, data analytics, and AI are helping investors and institutions better anticipate market swings. By analyzing inflation trends, interest rate projections, and historical market reactions, AI-driven models can provide probabilistic forecasts, aiding in more informed investment decisions. These tools, however, cannot eliminate risk entirely, especially during unprecedented shocks or black swan events.
10. Conclusion
Market swings, inflation, and interest rates are inseparable forces shaping the global financial landscape. Their interaction determines the rhythm of markets, influencing investment strategies, economic growth, and financial stability. For investors and policymakers, understanding these dynamics is crucial to navigating volatility and making strategic decisions. While the future is inherently uncertain, careful monitoring of inflationary trends, interest rate policies, and market signals can provide a roadmap for managing risk and capitalizing on opportunities in a complex economic environment.

RSI Indicators SecretsUnlocking the True Power of Relative Strength Index in Trading
1. Understanding the Core of RSI
RSI is a momentum oscillator developed by J. Welles Wilder in 1978. It measures the speed and change of price movements on a scale from 0 to 100. Traditionally, an RSI above 70 is considered overbought (potential sell signal), while below 30 is considered oversold (potential buy signal).
However, treating these thresholds as rigid rules is a common beginner mistake. RSI is most effective when analyzed in conjunction with market context, trend direction, and price structure.
Calculation:
RSI = 100 −
Where RS = Average of n-period up closes ÷ Average of n-period down closes
Default period:
The standard RSI period is 14, but traders often adjust between 7 to 21 periods depending on market volatility and trading style.
Secret #1: Shorter periods make RSI more sensitive, generating early signals but increasing noise. Longer periods smooth the indicator, providing more reliable, but delayed, signals.
2. RSI and Trend Strength
Many traders misinterpret RSI purely as an overbought/oversold tool. In reality, RSI also reflects trend strength.
RSI above 50: Suggests bullish momentum.
RSI below 50: Suggests bearish momentum.
Secret #2: During strong trends, RSI can remain overbought or oversold for extended periods. A stock can stay above 70 in an uptrend without reversing, and below 30 in a downtrend. This is known as RSI trend hugging, which can prevent premature exit from profitable trades.
Advanced Tip: Combine RSI with trend indicators (moving averages or trendlines) to confirm momentum before acting on overbought/oversold signals.
3. RSI Divergence: The Hidden Market Signal
Divergence is one of the most powerful aspects of RSI. It occurs when price moves in one direction, but RSI moves in another. Divergences often signal trend exhaustion and potential reversals.
Bullish Divergence: Price makes a lower low, RSI makes a higher low → indicates potential upward reversal.
Bearish Divergence: Price makes a higher high, RSI makes a lower high → indicates potential downward reversal.
Secret #3: Not all divergences are created equal. Pay attention to trend context:
In strong trends, minor divergences may produce small corrections only.
Strong divergences in consolidation zones often lead to significant trend reversals.
Pro Tip: Multi-timeframe divergence analysis is more reliable. For example, daily RSI divergence confirmed by weekly RSI divergence can indicate a stronger trend shift.
4. RSI Failure Swings: Confirming Trend Reversals
Beyond divergence, Wilder introduced RSI failure swings, which provide clearer reversal signals:
Bullish Failure Swing: RSI drops below 30 (oversold), rises above 30, pulls back but stays above 30, then rises → confirms bullish reversal.
Bearish Failure Swing: RSI rises above 70 (overbought), drops below 70, retraces but stays below 70, then falls → confirms bearish reversal.
Secret #4: Failure swings are often more reliable than standard overbought/oversold signals because they focus on RSI structure, not just absolute levels.
5. RSI Levels Beyond 70 and 30
Many traders stick rigidly to the 70/30 overbought/oversold levels, but markets vary:
Strong trending markets: Use 80/20 levels to avoid false signals.
Range-bound markets: Stick to 70/30 for standard setups.
Secret #5: Customize RSI levels for each asset and timeframe. Historical backtesting often reveals that some stocks consistently top out at 65 or bottom at 35 before reversing.
6. Combining RSI With Other Indicators
RSI works best when combined with complementary indicators:
Moving Averages: Confirm trend direction before acting on RSI signals.
MACD: Momentum alignment can reduce false signals.
Support/Resistance Zones: Validate RSI divergences against key price levels.
Secret #6: RSI acts as a filter rather than a standalone trigger. Using it with other indicators significantly increases trade accuracy.
7. RSI in Multiple Timeframes
Analyzing RSI across timeframes provides a more complete market perspective:
Higher timeframe RSI: Indicates the primary trend (daily or weekly).
Lower timeframe RSI: Reveals short-term momentum for entries and exits.
Secret #7: Enter trades aligned with higher timeframe RSI. For instance, if weekly RSI shows bullish momentum, intraday dips below 30 on daily RSI can offer safer buying opportunities.
8. RSI in Range-Bound vs. Trending Markets
RSI strategies differ depending on market conditions:
Range-bound markets: Look for overbought/oversold signals for reversals at horizontal support/resistance.
Trending markets: Focus on pullbacks to 40–50 in uptrends or 50–60 in downtrends rather than relying solely on 70/30 signals.
Secret #8: RSI overbought/oversold signals are most effective in sideways markets; trend-followers should rely on RSI for momentum confirmation instead.
9. RSI Scalping and Intraday Trading Secrets
RSI is also effective for short-term trading:
Use shorter RSI periods (5–9) to capture quick momentum shifts.
Combine RSI with tick or minute charts for scalping opportunities.
Focus on intraday divergences and failure swings near session highs/lows.
Secret #9: Avoid RSI over-optimization. Extremely short periods can generate false signals, so always test on historical intraday data before applying real trades.
10. Psychological Edge With RSI
RSI not only measures momentum but also captures market psychology:
Overbought conditions indicate market euphoria.
Oversold conditions indicate fear or panic.
Secret #10: Understanding market sentiment through RSI can help anticipate sudden reversals caused by herd behavior rather than just technical levels.
11. Common Mistakes Traders Make With RSI
Blindly buying at oversold or selling at overbought levels.
Ignoring trend context and using RSI in isolation.
Overcomplicating with extreme customization without backtesting.
Secret #11: RSI is a powerful tool when used thoughtfully. Discipline, confirmation with other indicators, and context-aware trading separate successful RSI traders from those who fail.
12. Final Thoughts: Mastering RSI Secrets
The Relative Strength Index is deceptively simple on the surface, but its depth allows traders to uncover hidden momentum signals, trend strength, divergences, and reversal patterns. True mastery comes from combining:
Multi-timeframe analysis
Divergence and failure swing patterns
Customized overbought/oversold levels
Trend confirmation using complementary indicators
Understanding market psychology
By decoding these RSI secrets, traders can move beyond basic textbook applications to make strategic, confident, and highly effective trading decisions.

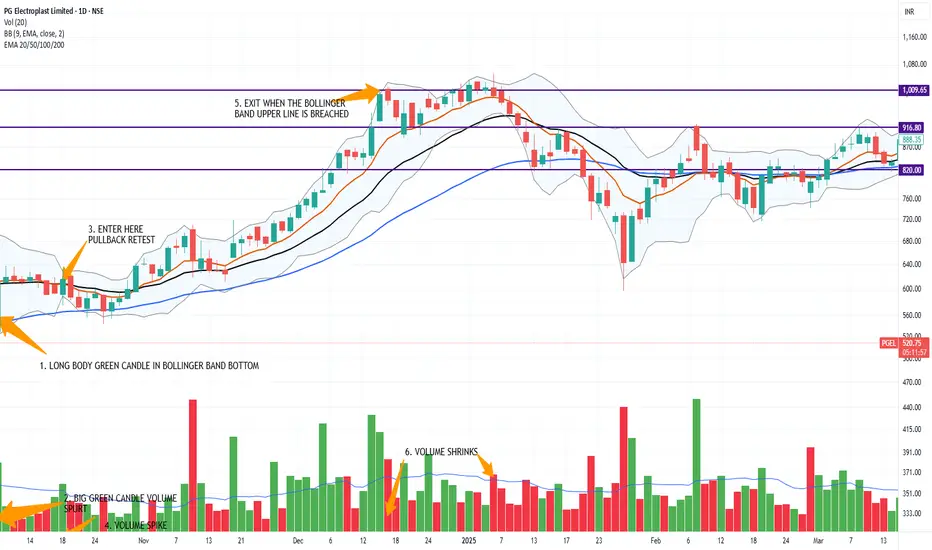
Identifying when to enter a stock?Identifying when to enter a stock?
Indicator Set Up Required: Bollinger Band, 9 EMA (Orange Line), 21 EMA (Black Line), 50 EMA line (Blue Line), Volume
Wait for the formation of Long body Green Candle.
Ensure that the candle forms near the bottom of Bollinger Band.
Confirm the Big Volume spurt.
Can enter the next day or after pullback to 21 EMA (Blackline).
You can exit when the stock touches upper bolliner band when volume shrinks.
Note: This setup works most of the time.
However, backtest the strategy before trying in the market.
You can keep stoploss below 50 EMA line or 21 EMA line.
Unlocking India’s Derivative Power1. Introduction: The Rise of Derivatives in India
Derivatives have existed in some form for centuries, initially in agriculture and commodities, enabling farmers and merchants to hedge price risk. In India, derivatives gained prominence after the economic liberalization in the 1990s. The National Stock Exchange (NSE) launched equity derivatives in 2000, followed by commodity derivatives on the Multi Commodity Exchange (MCX) and the National Commodity & Derivatives Exchange (NCDEX).
The core appeal of derivatives lies in risk management. Investors and institutions can hedge against price volatility, speculate for gains, or arbitrage price inefficiencies across markets. India’s derivatives market, although smaller than developed economies, has shown exponential growth, both in volume and diversity.
2. Understanding Derivatives: Types and Functions
Derivatives in India primarily fall into four categories:
2.1 Futures Contracts
Futures are standardized agreements to buy or sell an underlying asset at a predetermined price on a specific future date. They exist across equity, index, commodity, currency, and interest rate segments. Futures are widely used for hedging and speculative purposes. For example, a farmer can hedge against falling crop prices using commodity futures.
2.2 Options Contracts
Options give the buyer the right, but not the obligation, to buy (call option) or sell (put option) an asset at a specified price before or on the expiration date. Options are highly versatile for hedging, income generation, and portfolio protection. In India, options trading is active in equities, indices, currencies, and commodities.
2.3 Currency Derivatives
Currency derivatives help manage foreign exchange risk. With globalization and rising trade, Indian businesses increasingly rely on currency futures and options to hedge against volatility in USD/INR, EUR/INR, and other currency pairs.
2.4 Interest Rate Derivatives
Interest rate derivatives, including forwards, swaps, and futures, are used by banks, corporates, and investors to manage interest rate exposure. They have become crucial with rising corporate borrowing and government debt issuance.
3. The Current Landscape of India’s Derivative Markets
India’s derivative markets have evolved significantly, both in depth and sophistication.
3.1 Equity Derivatives
Equity derivatives, including stock and index futures and options, dominate India’s derivative ecosystem. NSE’s Nifty 50 futures and options are among the most traded globally. Retail participation has increased, driven by online platforms, algorithmic trading, and financial literacy.
3.2 Commodity Derivatives
MCX and NCDEX facilitate trading in gold, silver, crude oil, agricultural commodities, and base metals. Commodity derivatives allow businesses and investors to manage price risk efficiently while attracting speculative interest that enhances liquidity.
3.3 Currency and Forex Derivatives
With India’s integration into the global economy, currency derivatives have become indispensable. Corporates hedging imports and exports, banks managing reserves, and traders speculating on exchange rates collectively make this segment robust.
3.4 Institutional Participation
Foreign institutional investors (FIIs), mutual funds, insurance companies, and banks actively participate in India’s derivative markets. Their involvement improves liquidity, market efficiency, and price discovery.
4. Regulatory Framework: Building Confidence
A strong regulatory framework underpins India’s derivative markets. Key authorities include:
Securities and Exchange Board of India (SEBI): Regulates equity and currency derivatives to ensure investor protection, transparency, and risk mitigation.
Forward Markets Commission (FMC): Historically regulated commodity derivatives, now merged with SEBI for unified oversight.
Reserve Bank of India (RBI): Regulates currency derivatives and interest rate products.
SEBI has implemented measures such as position limits, margin requirements, and reporting obligations to curb systemic risk and promote market integrity. Such frameworks instill confidence among investors and institutions.
5. Unlocking Derivative Power: Strategies and Opportunities
To fully unlock the power of derivatives in India, market participants need to embrace innovation, strategic usage, and risk awareness.
5.1 Hedging and Risk Management
Derivatives allow businesses, investors, and traders to hedge against market volatility. For example:
A corporates hedging foreign currency exposure.
Farmers locking in commodity prices.
Investors protecting equity portfolios through index options.
Hedging creates stability in returns, making businesses and markets more resilient.
5.2 Speculation for Returns
Speculators provide liquidity and contribute to efficient price discovery. Traders using futures, options, and spreads can generate profits based on market expectations. While speculation involves risk, disciplined strategies can significantly enhance wealth.
5.3 Arbitrage Opportunities
Derivatives provide avenues for arbitrage—exploiting price differences across markets or between underlying assets and derivatives. For example, mispricing between Nifty spot and futures creates riskless profit opportunities. Efficient arbitrage strengthens market integrity and narrows spreads.
5.4 Portfolio Diversification
Derivatives facilitate exposure to diverse asset classes without directly holding them. Investors can gain exposure to commodities, currencies, and indices efficiently, enhancing portfolio diversification and risk-adjusted returns.
5.5 Leveraging Technology
Algorithmic trading, AI-driven analytics, and data modeling enhance derivative trading efficiency. Institutional and retail investors can use sophisticated models to optimize hedging, detect opportunities, and manage risks in real-time.
6. Challenges in India’s Derivative Market
While potential is vast, India’s derivative ecosystem faces several challenges:
6.1 Low Awareness and Education
Despite growth, a large segment of retail investors lacks knowledge about derivative usage and risk management. This gap often leads to misuse and losses.
6.2 Market Volatility
Derivatives amplify market volatility. Without proper risk management, leveraged positions can lead to systemic shocks or investor losses.
6.3 Regulatory Complexity
Compliance with SEBI, RBI, and tax regulations can be cumbersome. Frequent changes require active adaptation, which can be challenging for smaller participants.
6.4 Limited Access in Certain Segments
Currency, interest rate, and commodity derivatives remain underutilized by retail investors and SMEs due to lack of exposure, awareness, and platform accessibility.
7. Unlocking Derivative Power for SMEs and Retail Investors
Small and medium enterprises (SMEs) and retail investors form a large portion of India’s economy. Leveraging derivatives can empower them:
SMEs: Can hedge raw material costs, forex exposure, and interest rate risks, ensuring stable cash flows.
Retail Investors: Can use options for risk management, generate additional income via covered calls, or hedge equity portfolios.
Education programs, simplified platforms, and advisory services can accelerate adoption.
8. Technological Innovations Driving Growth
India’s derivative markets are increasingly powered by technology:
Algorithmic Trading: Automated strategies enhance efficiency, speed, and accuracy.
AI & Data Analytics: Predictive models improve risk assessment and market forecasts.
Blockchain & Smart Contracts: Can enhance transparency, settlement efficiency, and reduce counterparty risk in derivative contracts.
9. Global Comparison and India’s Potential
Compared to developed markets like the US, derivatives penetration in India remains lower. For example:
Equity derivatives turnover in India is high, but options and exotic instruments are less prevalent.
Commodity derivatives offer tremendous growth potential, especially in agri-commodities where hedging is limited.
Unlocking India’s derivative power can align the country with global financial practices, attract foreign investment, and enhance market sophistication.
10. Risk Management and Responsible Trading
While derivatives offer leverage and profit potential, they carry inherent risks:
Leverage Risk: Small price movements can lead to large gains or losses.
Liquidity Risk: Some contracts may lack adequate liquidity, leading to slippage.
Counterparty Risk: Though exchanges mitigate this via clearinghouses, OTC contracts carry higher risk.
Systemic Risk: Excessive speculative positions can destabilize markets.
Prudent risk management strategies, margin discipline, diversification, and regulatory compliance are essential to sustainably unlock derivative power.
Conclusion: A New Era of Financial Empowerment
India’s derivative market represents a formidable yet underutilized resource. By combining technology, education, regulatory oversight, and strategic usage, India can unlock the true power of derivatives. Properly harnessed, derivatives will not only stabilize risks and enhance returns but also position India as a global financial hub with sophisticated market infrastructure.
For investors, traders, and businesses alike, understanding and using derivatives responsibly is key to unlocking wealth, managing risk, and driving long-term economic growth. India stands at the threshold of a financial revolution, where derivatives can transform market efficiency, liquidity, and resilience—ushering in a new era of economic empowerment.
Indian SME IPOs: High Rewards Amidst High RisksPart 1: Introduction to SME IPOs in India
Small and Medium Enterprises (SMEs) are the backbone of India’s economy, contributing significantly to employment, GDP, and innovation. Recognizing their importance, the Indian government and capital markets have encouraged SMEs to access public funding through Initial Public Offerings (IPOs). Unlike traditional IPOs on the main board, SME IPOs are specifically designed to allow smaller companies to raise capital efficiently while offering retail and institutional investors opportunities to participate in potentially high-growth ventures.
Definition and Characteristics of SME IPOs
SME IPOs are offerings of equity by small and medium enterprises listed on the SME segment of recognized stock exchanges, primarily the BSE SME and NSE Emerge platforms. The eligibility criteria for SMEs include:
Minimum net worth and profitability standards.
A track record of at least two years of operations.
Compliance with corporate governance standards.
SME IPOs typically have a lower investment size compared to mainboard IPOs, making them accessible to retail investors. The minimum application amount is often around ₹1–2 lakh, while the maximum may vary depending on the issue size.
Why SMEs Go Public
SMEs pursue IPOs for several reasons:
Capital for Expansion: SME IPOs provide companies with funds to expand operations, invest in new technology, or enter new markets.
Brand Visibility: Listing enhances a company’s visibility and credibility among clients, suppliers, and investors.
Liquidity and Exit Opportunities: Founders, early investors, and venture capitalists gain a structured exit route.
Attract Talent: A public listing makes it easier to offer stock options and attract skilled professionals.
Potential for High Rewards
SME IPOs are high-risk, high-reward opportunities. Unlike established companies, SMEs operate in niche markets or emerging sectors, meaning a successful IPO can yield significant returns. Historically, some SME IPOs have delivered returns of 50–200% within a year of listing, attracting speculative and growth-focused investors. However, it’s important to note that the risks are also higher, including market volatility, limited liquidity, and operational challenges.
Conclusion of Part 1
The SME IPO segment offers a unique avenue for investors seeking exposure to high-growth, smaller companies in India. With regulatory support, increasing investor awareness, and improved market infrastructure, SME IPOs are becoming a mainstream avenue for wealth creation.
Part 2: Regulatory Framework and Listing Process
The growth of SME IPOs in India has been facilitated by clear regulatory frameworks established by SEBI (Securities and Exchange Board of India) and the stock exchanges. These frameworks ensure investor protection while promoting SME participation in public markets.
SEBI Guidelines for SME IPOs
SEBI has set distinct rules for SMEs to streamline the IPO process:
Companies must have a post-issue capital of at least ₹10 crore.
Mandatory appointment of a merchant banker to manage the issue.
Submission of a prospectus detailing financials, business model, risks, and future plans.
Listing on SME platforms like BSE SME or NSE Emerge, not the mainboard initially.
The IPO Process for SMEs
The process for an SME IPO typically includes:
Appointment of Merchant Banker: To ensure compliance with SEBI regulations and guide the company through the listing process.
Preparation of Draft Prospectus: Includes financial statements, growth plans, risk factors, and use of IPO proceeds.
SEBI Approval: Draft prospectus is submitted to SEBI for review and approval.
Pricing and Marketing: The IPO can be priced via fixed price or book-building route. SMEs often use book-building to determine fair value.
IPO Launch and Subscription: Investors, including retail and institutional, subscribe to the shares during the IPO period.
Listing: Once shares are allotted, they get listed on SME platforms, enabling trading and liquidity.
Investor Protection Measures
Despite being high-growth, high-risk investments, SME IPOs incorporate measures for investor protection:
Disclosure of risk factors and financials.
Requirement of a market maker to maintain liquidity.
SEBI guidelines for lock-in periods for promoters, reducing the risk of sudden sell-offs.
Conclusion of Part 2
A strong regulatory framework ensures transparency, investor confidence, and orderly growth of the SME IPO market. Understanding this framework helps investors evaluate the potential risks and rewards before committing capital.
Part 3: Factors Driving High Returns in SME IPOs
High returns in SME IPOs are driven by a combination of market dynamics, company fundamentals, and investor sentiment.
1. Growth Potential of SMEs
Many SMEs operate in emerging sectors such as technology, renewable energy, healthcare, and specialty manufacturing. These sectors have higher growth potential compared to mature industries, making them attractive for investors seeking exponential returns.
2. Market Inefficiencies and Speculation
SME stocks often have lower liquidity, creating price inefficiencies. Early investors who identify strong companies can benefit from rapid price appreciation after listing.
3. Promoter Credibility and Track Record
A promoter’s experience, credibility, and operational success significantly influence investor confidence. Companies with visionary leadership tend to perform better post-IPO, often rewarding early investors.
4. Favorable Economic Conditions
Macroeconomic factors like GDP growth, low interest rates, and government incentives for SMEs can amplify returns. For instance, policies promoting Make in India or technology adoption can increase SME valuations.
5. Undervalued Offerings
SME IPOs often carry lower valuations compared to mainboard companies. Investors with careful fundamental analysis can identify undervalued opportunities poised for growth.
6. Role of Market Makers
BSE and NSE mandate market makers for SME stocks, ensuring continuous buying and selling, which can reduce volatility and provide price support during initial trading days.
Conclusion of Part 3
High returns in SME IPOs are a result of the interplay between intrinsic company value, sector growth potential, market sentiment, and regulatory mechanisms. However, investors must exercise caution and due diligence to avoid speculative pitfalls.
Part 4: Risks and Challenges in Investing in SME IPOs
While SME IPOs promise high rewards, they are accompanied by unique risks that investors must understand.
1. Limited Operational Track Record
SMEs often have shorter business histories. Any operational misstep, market slowdown, or competitive threat can significantly impact profitability and share price.
2. Lower Liquidity
SME stocks trade on smaller platforms with fewer participants, leading to thin order books. This can result in higher price volatility and difficulty in exiting positions quickly.
3. Market Volatility
SME IPOs are more sensitive to broader market swings. Even positive company performance may not prevent stock prices from falling during bearish market conditions.
4. Regulatory and Compliance Risks
Although SEBI regulates SME IPOs, non-compliance, reporting delays, or governance lapses can affect investor confidence and share performance.
5. Sector-Specific Risks
Many SMEs operate in niche sectors that may face rapid technological changes, policy shifts, or demand fluctuations, affecting long-term sustainability.
6. Overvaluation at Listing
Due to hype, some SME IPOs may be overpriced relative to fundamentals, exposing investors to short-term losses post-listing.
Risk Mitigation Strategies
Diversification: Avoid concentrating capital in one SME IPO.
Fundamental Analysis: Study financials, business model, and growth prospects.
Monitor Market Maker Activity: Ensure liquidity support is sufficient.
Long-Term Perspective: SME IPOs often perform better over 1–3 years than in the immediate post-listing period.
Conclusion of Part 4
Understanding risks is critical for balancing potential high rewards. While SME IPOs can deliver significant returns, careful due diligence, prudent investment size, and long-term perspective are essential to mitigate inherent risks.
Part 5: Strategies for Successful Investment in SME IPOs
Investors can maximize rewards from SME IPOs by combining research, timing, and portfolio management strategies.
1. Identifying Promising SMEs
Focus on companies with:
Strong fundamentals and consistent revenue growth.
Experienced promoters with proven track records.
Products or services in emerging or high-demand sectors.
2. Timing and Market Sentiment
Investors should monitor:
IPO subscription trends: Oversubscription indicates strong demand.
Market conditions: Bullish markets often favor strong listing gains.
Listing day performance and early trading trends for post-IPO opportunities.
3. Diversification Across Sectors
Investing in multiple SME IPOs across different industries reduces sector-specific risk and increases chances of capturing high-growth opportunities.
4. Leveraging Advisory Services
Merchant bankers, financial analysts, and SEBI-registered advisors can provide insights into valuation, risk factors, and listing prospects.
5. Long-Term Investment Approach
While short-term gains are possible, many SME IPOs achieve substantial growth over 1–3 years. Investors focusing on long-term growth can benefit from compounding returns and company expansion.
6. Monitoring Post-Listing Performance
After listing, track:
Quarterly financial results.
Market share growth and competitive positioning.
Promoter activity and adherence to corporate governance.
7. Exit Strategies
Plan exits based on valuation targets or fundamental deterioration. Avoid panic selling during short-term market volatility.
Conclusion of Part 5
SME IPOs represent a compelling opportunity for investors willing to take calculated risks. By combining careful research, diversification, long-term vision, and active monitoring, investors can participate in India’s growth story and potentially achieve high rewards from the SME IPO segment.
Overall Conclusion
Indian SME IPOs are a vibrant, high-potential segment that balances risk with opportunity. Regulatory support, growth potential, and market mechanisms make it possible for investors to reap significant rewards, provided they adopt disciplined investment strategies. By understanding the nuances, risks, and strategies discussed, investors can confidently navigate the SME IPO landscape in India.

Global Market Shifts1. Introduction
Global markets are dynamic ecosystems where capital, goods, services, and information flow across borders. Shifts in these markets represent changes in patterns of trade, investment, currency valuation, risk appetite, and economic influence among countries or regions. Understanding these shifts is crucial for investors, policymakers, and traders because they directly influence portfolio strategies, national economic stability, and global financial connectivity.
Global market shifts can be sudden, triggered by geopolitical events, technological breakthroughs, or crises, or they can be gradual, influenced by demographic trends, policy reforms, and shifts in global supply-demand balances. These shifts impact equities, bonds, commodities, foreign exchange, and digital assets, creating opportunities and risks in both short-term trading and long-term investment strategies.
2. Historical Perspective of Global Market Shifts
2.1 Pre-20th Century Shifts
The concept of global markets is not new. Historical shifts can be traced to:
The Age of Exploration (15th–17th century): European expansion opened global trade routes, creating early financial centers in Amsterdam and London.
Industrial Revolution (18th–19th century): Mass production and technological innovation shifted economic power to industrialized nations. Capital markets expanded to fund infrastructure and factories.
Colonial Trade: Commodities like sugar, cotton, and spices became globally traded, influencing global capital flows and wealth distribution.
2.2 Early 20th Century
Interwar Period: Post-WWI reconstruction caused capital flows from the US to Europe. The 1929 stock market crash highlighted the interconnectedness of global financial systems.
Post-WWII Era: Establishment of Bretton Woods institutions (IMF, World Bank) stabilized currencies and encouraged multilateral trade. The US dollar emerged as the global reserve currency, shifting financial power toward the United States.
2.3 Late 20th Century Shifts
Globalization and Trade Liberalization: The 1980s and 1990s saw a surge in cross-border investments, driven by deregulation, technology, and emerging markets (China, India).
Financial Crises: Events like the 1997 Asian Financial Crisis and 2008 Global Financial Crisis reshaped market confidence, risk management practices, and regulatory frameworks worldwide.
3. Drivers of Global Market Shifts
Global market shifts are driven by a combination of economic, technological, geopolitical, and behavioral factors. Understanding these drivers is crucial for predicting trends and managing risks.
3.1 Economic Drivers
Monetary Policy: Interest rate decisions by central banks (Fed, ECB, BoJ) influence capital flows and currency valuations, causing global shifts in investment and trade patterns.
Fiscal Policy: Government spending, taxation, and public debt impact domestic growth, influencing foreign investment.
Inflation & Deflation: High inflation reduces real returns on bonds and equities, causing shifts toward commodities or alternative assets.
Global Trade Dynamics: Trade agreements, tariffs, and sanctions alter supply chains and capital allocation across regions.
3.2 Technological Drivers
Digital Transformation: Automation, AI, blockchain, and fintech innovations reshape global trading, payments, and investment platforms.
High-Frequency Trading (HFT): Algorithmic trading exploits price discrepancies across global markets, accelerating the speed of capital shifts.
Data Availability: Real-time global economic data enables investors to react instantly, increasing volatility and market interconnectedness.
3.3 Geopolitical Drivers
Wars and Conflicts: Conflicts disrupt supply chains, commodity flows, and investor confidence.
Diplomacy and Sanctions: Trade restrictions or sanctions shift market focus toward alternative trading partners.
Political Stability: Stable governments attract foreign investment, while instability triggers capital flight.
3.4 Behavioral and Psychological Drivers
Investor Sentiment: Fear and greed cycles influence global capital allocation and risk appetite.
Herd Behavior: Collective reactions to news or trends can magnify market shifts, causing bubbles or crashes.
Speculation: Short-term speculative activity, especially in currencies and commodities, can exacerbate market swings.
4. Types of Global Market Shifts
4.1 Currency Shifts
Fluctuations in exchange rates impact global trade and investment. Examples include:
Dollar Strength/Weakness: The USD’s dominance affects emerging markets’ debt sustainability.
Currency Crises: Rapid devaluations in countries like Turkey or Argentina can trigger regional financial instability.
4.2 Equity Market Shifts
Sectoral Rotation: Global investment often rotates between sectors based on macroeconomic trends (e.g., tech vs. commodities).
Emerging Market Surges: Markets like China, India, or Brazil attract capital during periods of rapid growth.
Market Corrections: Large-scale corrections ripple through global markets, especially during crises.
4.3 Commodity Market Shifts
Oil & Gas: Geopolitical conflicts in the Middle East or supply disruptions cause global energy price shocks.
Metals & Agriculture: Changing demand from industrializing nations or climate events influence commodity markets.
Precious Metals: Gold and silver act as hedges during currency depreciation or inflation.
4.4 Bond Market Shifts
Interest Rate Changes: Global bond yields react to central bank policies.
Flight-to-Safety Movements: During crises, capital shifts from equities to sovereign bonds in stable economies.
4.5 Digital Asset Shifts
Cryptocurrencies and Central Bank Digital Currencies (CBDCs) introduce new dimensions in cross-border payments and speculative flows, often moving faster than traditional assets.
5. Mechanisms of Global Market Shifts
5.1 Capital Flows
Global capital shifts through foreign direct investment (FDI), portfolio investments, and cross-border loans. Key mechanisms include:
Equity Investment: Buying stocks in foreign markets.
Bond Purchases: Sovereign or corporate bonds attract global investors seeking yields.
Venture Capital & Private Equity: Funding emerging tech and startups drives long-term shifts.
5.2 Trade Shifts
Changes in import/export patterns directly impact currency strength, commodity prices, and equity markets.
Regional trade agreements (e.g., USMCA, RCEP) can reroute capital and investment priorities.
5.3 Technological Interconnectivity
Digital trading platforms, APIs, and HFT algorithms accelerate the speed and scale of global shifts.
Real-time news and analytics platforms make global markets reactive to small events.
5.4 Speculative Movements
Hedge funds and institutional traders use leverage to amplify global market shifts.
Speculative bubbles can cause temporary but impactful disruptions in asset prices.
6. Case Studies of Major Global Market Shifts
6.1 The 2008 Global Financial Crisis
Triggered by US subprime mortgage defaults.
Resulted in a global credit crunch, massive equity declines, and sovereign debt crises.
Shifted investment toward safer assets and caused long-term regulatory reforms.
6.2 COVID-19 Pandemic
Global lockdowns disrupted supply chains, commodity flows, and labor markets.
Accelerated technology adoption and digital finance.
Triggered massive central bank interventions, leading to low interest rates globally.
6.3 US-China Trade War (2018–2020)
Tariffs and sanctions caused supply chain rerouting and increased investment in alternative markets.
Global markets reacted with sectoral shifts, affecting technology, manufacturing, and agriculture.
6.4 Russia-Ukraine Conflict (2022–2025)
Energy and commodity markets experienced historic volatility.
Shifted global energy trade toward renewables and alternative suppliers.
Increased defense spending in Europe influenced equity and bond markets.
7. Implications for Stakeholders
7.1 Investors
Must diversify across regions, sectors, and asset classes.
Require active monitoring of macroeconomic indicators and geopolitical risks.
Can capitalize on emerging market growth or sectoral rotations.
7.2 Traders
High-frequency and algorithmic traders exploit short-term market inefficiencies.
Currency and commodity traders must track global capital flows and central bank policies.
News trading strategies become more critical in volatile environments.
7.3 Policymakers
Need to anticipate capital flight and currency volatility.
Must coordinate with international institutions to stabilize markets during crises.
Regulatory reforms can shape long-term market resilience and investor confidence.
7.4 Corporates
Supply chain disruptions necessitate alternative sourcing strategies.
Foreign exchange volatility affects revenue and profit margins.
Investment planning must account for global economic cycles and market shifts.
8. Emerging Trends Shaping Future Global Market Shifts
8.1 Rise of Emerging Markets
Countries like India, Vietnam, and Nigeria attract FDI due to growth potential.
Shifts capital from traditional power centers (US, EU) to these new hubs.
8.2 Digital Assets and Fintech
Cryptocurrencies, CBDCs, and blockchain-based platforms enable faster, cross-border capital movements.
Decentralized finance may reduce reliance on traditional banking channels.
8.3 Climate Change and ESG Investing
Green finance, carbon trading, and sustainability-linked investments are influencing global capital allocation.
Traditional energy sectors may see declining investments, while renewable energy surges.
8.4 Geopolitical Realignments
Regional conflicts, trade blocs, and shifting alliances (e.g., US–EU–Asia dynamics) will continue to drive market shifts.
Energy independence, defense spending, and technological self-sufficiency influence investment flows.
8.5 AI and Automation
Artificial intelligence accelerates market analysis, predictive modeling, and trading execution.
Could increase volatility but also enhance risk management.
9. Challenges in Navigating Global Market Shifts
Volatility: Rapid shifts can erode capital and destabilize portfolios.
Information Overload: Massive real-time data streams make it difficult to separate noise from meaningful signals.
Policy Uncertainty: Sudden changes in regulations, sanctions, or trade policies create unpredictability.
Technological Disruption: Markets must adapt to fintech innovations, automated trading, and digital currencies.
Climate & ESG Risks: Environmental crises and regulations may cause unexpected sectoral disruptions.
10. Conclusion
Global market shifts are a complex interplay of economic, geopolitical, technological, and behavioral forces. They can be incremental or sudden, affecting currencies, equities, commodities, bonds, and digital assets. Historical crises demonstrate the interconnected nature of markets, while emerging trends highlight the importance of technology, sustainability, and global cooperation.
For investors, traders, corporates, and policymakers, understanding these shifts is no longer optional—it is essential. Effective strategies require real-time information, diversified portfolios, risk management, and a forward-looking approach that anticipates structural changes in the global economy.
By studying past shifts and monitoring ongoing developments, market participants can navigate volatility, capitalize on opportunities, and mitigate risks in an increasingly interconnected financial world.

Part 3 Institutional Trading 1. What Are Options?
1.1 Definition
An option is a financial derivative contract that gives the buyer the right, but not the obligation, to buy or sell an underlying asset at a predetermined price (strike price) on or before a specified date (expiry).
Call Option: Right to buy.
Put Option: Right to sell.
The buyer of an option pays a premium to the seller (writer) for acquiring this right.
1.2 Underlying Assets
Options can be written on:
Equities (stocks)
Indices (Nifty, S&P 500, etc.)
Commodities (gold, crude oil)
Currencies (USD/INR, EUR/USD)
Interest rates & bonds
This wide range makes them versatile instruments for trading and hedging.

Part 11 Trading Master Class With ExpertsI. Option Trading Strategies
Buying Calls and Puts
Buying a Call: Profitable if asset price rises above strike + premium.
Buying a Put: Profitable if asset price falls below strike - premium.
Covered Call Strategy
Involves holding the underlying stock and selling a call option.
Generates premium income but limits upside profit.
Protective Put
Buying a put while holding the underlying asset as insurance against a price drop.
Spreads
Combine buying and selling options to reduce risk and cost:
Bull Call Spread: Buy lower strike call, sell higher strike call.
Bear Put Spread: Buy higher strike put, sell lower strike put
Straddles and Strangles
Straddle: Buy ATM call and put; profitable if price moves significantly either way.
Strangle: Buy OTM call and put; cheaper than straddle, requires larger movement.
Iron Condor
Advanced strategy combining bull and bear spreads.
Generates income with limited risk in low-volatility markets.
Calendar and Diagonal Spreads
Utilize different expiration dates and strikes to profit from time decay and volatility.
II. Risk Management in Options
Leverage and Risk
Options offer high leverage: small price moves in underlying asset can lead to large gains or losses. Proper position sizing is crucial.
Maximum Loss and Gain
Buyer: Max loss = premium paid; Max gain = theoretically unlimited for calls, limited for puts.
Seller: Max gain = premium received; Max loss = potentially unlimited for naked calls.
Diversification Across Strategies
Mixing spreads, covered calls, and protective puts helps reduce single-position risk.
Stop-Loss and Exit Strategies
Plan exit points: cut losses, take partial profits, or roll positions to new strikes or expirations.
III. Market Mechanics and Trading
Exchanges and Option Contracts
Options trade on regulated exchanges (e.g., NSE, BSE, CBOE). Each contract represents a fixed quantity of the underlying (e.g., 100 shares per contract).
Liquidity and Open Interest
Liquidity: Ease of buying/selling options at fair prices.
Open Interest: Number of outstanding contracts; higher OI often means better liquidity.
Implied Volatility and Market Sentiment
IV: Market’s forecast of future volatility.
Rising IV generally increases option premiums, signaling uncertainty.
Hedging vs. Speculation
Options can hedge existing positions or speculate on market movements. Hedging reduces risk, speculation increases risk but offers leverage.

Energy Trading and Geopolitics1. Introduction to Event-Driven Trading
Event-driven trading is a subset of fundamental trading strategies that react to specific corporate or macroeconomic events. These events create temporary inefficiencies in the market, which traders attempt to exploit. Unlike long-term investing, which focuses on company fundamentals and growth, event-driven trading is short-term and opportunistic, leveraging price volatility around events.
Key Characteristics:
Trades are short-term, typically lasting hours to days around an event.
High volatility is expected around the event.
Requires pre-event analysis to predict likely outcomes.
Risk is event-specific, rather than market-specific.
2. Earnings Announcements: The Core Event
Earnings announcements are the public disclosure of a company’s financial performance over a given period, usually a quarter. They include metrics such as:
Revenue
Earnings per share (EPS)
Net income
Guidance for future performance
Importance for Traders:
Earnings reports are highly market-sensitive events, often causing large price swings.
The market reacts not just to actual numbers, but also to expectations vs reality.
Earnings Reaction Components:
Surprise Effect – The difference between reported earnings and analyst expectations.
Guidance Effect – Future outlook provided by the company.
Market Sentiment – How traders interpret the news relative to broader market conditions.
3. Types of Event-Driven Earnings Trading Strategies
Event-driven earnings trading can be divided into several approaches:
3.1. Pre-Earnings Positioning
Traders take positions before the earnings release based on expected outcomes.
Bullish Pre-Earnings Trade: Buy a stock anticipating strong earnings.
Bearish Pre-Earnings Trade: Short a stock expecting disappointing results.
Tools Used:
Historical earnings data
Analyst consensus estimates
Options implied volatility
Risks:
Surprise moves can result in rapid losses.
Unanticipated market reactions to guidance or macro news.
3.2. Post-Earnings Reaction Trading
Traders react immediately after the earnings announcement.
Buy the Rumor, Sell the Fact: Stocks often overreact to news.
Momentum Plays: Riding the initial surge after positive surprises.
Mean Reversion Plays: Betting that overreaction will correct itself.
Tools Used:
Real-time news feeds
Trading platforms with low latency
Volatility analysis
Risks:
Sudden reversal after initial move.
Liquidity issues if the stock gaps significantly.
3.3. Options-Based Earnings Strategies
Options provide ways to trade earnings with defined risk.
3.3.1. Straddle
Buy both a call and put at the same strike.
Profits from high volatility, regardless of direction.
Risk is limited to premium paid.
3.3.2. Strangle
Buy out-of-the-money call and put.
Cheaper than straddle but requires bigger moves to profit.
3.3.3. Iron Condor
Sell out-of-the-money call and put while buying farther OTM options.
Profits if stock remains within a range.
Strategy bets on low volatility post-earnings.
3.4. Pair and Relative Performance Strategies
Trading two related stocks to profit from earnings mispricing.
Example: Buy outperformer, short underperformer in same sector.
Reduces market-wide risk, isolates company-specific reactions.
4. Key Factors to Consider Before Earnings Trading
Earnings Expectations
Compare consensus estimates vs historical performance.
Understand market sentiment and analyst revisions.
Volatility
Stocks often exhibit high implied volatility before earnings.
Option premiums increase, providing trading opportunities.
Liquidity
Ensure stock or options have sufficient trading volume.
Avoid illiquid stocks to reduce slippage risk.
Historical Patterns
Some companies have predictable post-earnings moves.
Analyze seasonal patterns and sector behavior.
Macro Environment
Broader market conditions can amplify or dampen earnings reactions.
Example: Interest rate announcements, geopolitical news.
5. Risk Management in Event-Driven Earnings Trading
Event-driven earnings trading carries unique risks due to high volatility and uncertainty.
5.1. Pre-Event Risks
Unexpected Results: Missing analyst expectations can trigger sharp declines.
Volatility Crush: Post-earnings implied volatility often drops, reducing option premiums.
5.2. Post-Event Risks
Gaps and Slippage: Overnight gaps can bypass stop-loss orders.
False Momentum: Initial spikes may reverse quickly.
5.3. Hedging Techniques
Use options to limit downside.
Trade pairs or sector spreads to reduce market exposure.
Scale positions gradually to manage risk.
6. Tools and Platforms for Earnings Trading
Trading Platforms
Real-time order execution
Earnings calendars and alerts
News Feeds
Bloomberg, Reuters, or market-specific news aggregators
Twitter feeds of analysts for sentiment
Analytics Software
Implied volatility tracking
Earnings surprise calculators
Option strategy simulators
Backtesting Platforms
Historical earnings data analysis
Strategy testing under various market conditions
7. Case Studies and Examples
Example 1: Apple Inc. (AAPL)
Pre-Earnings Trade: Expecting strong iPhone sales → bought calls.
Outcome: Positive earnings beat → stock jumped 6% → profit realized.
Lesson: Pre-event positioning can be profitable if market consensus aligns.
Example 2: Tesla Inc. (TSLA)
Post-Earnings Reaction Trade: Tesla missed delivery targets → stock dropped.
Strategy: Shorted the initial momentum → profit from the decline.
Lesson: Quick post-event reactions can exploit overreactions.
Example 3: Options Straddle
Stock: Netflix
Scenario: High uncertainty before earnings
Action: Buy straddle to profit from a large move in either direction.
Outcome: Stock surged → call gained, put lost → net profit exceeded risk.
8. Behavioral Aspects and Market Psychology
Market reactions to earnings often deviate from rational expectations due to:
Herd Behavior: Traders following momentum.
Anchoring: Overemphasis on prior earnings trends.
Confirmation Bias: Ignoring contrary signals.
Understanding these psychological factors can give traders an edge.
9. Regulatory and Reporting Considerations
Insider Trading Rules: Avoid trading on non-public material information.
Earnings Manipulation Awareness: Watch for red flags in financial reports.
Disclosure Compliance: Ensure strategies do not violate SEC or local regulations.
10. Conclusion
Event-driven earnings trading is a sophisticated strategy that requires both fundamental and technical analysis skills. By focusing on corporate events like earnings announcements, traders can exploit short-term volatility and market inefficiencies. Successful execution involves:
Detailed pre-event research
Effective risk management
Rapid execution and monitoring
Understanding market psychology
Using options and hedging strategies wisely
When practiced diligently, earnings trading can become a powerful tool in a trader’s arsenal, offering consistent opportunities in an otherwise efficient market.
Part 1 Ride The Big Moves Part 1: Introduction to Option Trading
Option trading is a cornerstone of modern financial markets, offering traders and investors the flexibility to manage risk, speculate on price movements, and generate income. At its core, an option is a financial derivative—a contract that derives its value from an underlying asset, which can include stocks, indices, commodities, currencies, or ETFs. Unlike owning the underlying asset directly, an option provides the right—but not the obligation—to buy or sell that asset at a predetermined price within a specific time frame.
There are two primary types of options:
Call Options: Grant the buyer the right to purchase the underlying asset at a specific price, known as the strike price, before or on the option’s expiration date.
Put Options: Grant the buyer the right to sell the underlying asset at the strike price within a specified period.
The price paid to acquire an option is called the premium. This premium reflects the market’s perception of the likelihood that the option will end up profitable (in the money). Premiums are influenced by various factors, including the asset’s current price, strike price, time to expiration, volatility, interest rates, and dividends.
Option trading serves several purposes:
Hedging: Investors use options to protect existing positions against adverse price movements. For instance, owning put options can act as insurance against a decline in stock prices.
Speculation: Traders seeking profit from short-term price movements can leverage options to gain higher exposure with limited capital compared to buying the underlying asset outright.
Income Generation: Writing (selling) options allows investors to collect premiums, thereby generating income. Covered call strategies, for example, are widely used to earn consistent returns on long stock holdings.
Options differ from futures contracts in key ways. Futures obligate the buyer to purchase (or the seller to sell) the underlying asset at a future date, regardless of market conditions. Options, conversely, provide a choice without mandatory execution, giving traders more strategic flexibility. This asymmetry between risk and reward makes option trading unique and complex, requiring a strong grasp of market behavior, probability, and timing.
The evolution of option markets has been significant. Initially, options were traded over-the-counter (OTC), with bespoke contracts negotiated privately. With the establishment of standardized exchanges like the Chicago Board Options Exchange (CBOE) in 1973, options trading became more accessible, liquid, and regulated, paving the way for retail participation and complex strategies.
Part 2: Key Concepts and Terminologies
Understanding option trading requires familiarity with several fundamental concepts and terms:
Strike Price: The fixed price at which the underlying asset can be bought (call) or sold (put). It is central to determining whether an option is profitable at expiration.
Expiration Date: The date on which the option contract ceases to exist. Options are classified based on their lifespan:
Short-term options: Expire in days to weeks.
Long-term options: Also known as LEAPS, they can extend up to three years.
In the Money (ITM), At the Money (ATM), Out of the Money (OTM):
ITM: Option has intrinsic value (e.g., a call option’s strike price is below the current stock price).
ATM: Strike price equals the underlying asset’s current price.
OTM: Option lacks intrinsic value but may have time value.
Intrinsic and Extrinsic Value: Intrinsic value reflects the real, immediate value of an option (profit if exercised today). Extrinsic value is the premium over intrinsic value, factoring in time, volatility, and market conditions.
Volatility: A measure of price fluctuations of the underlying asset. Higher volatility increases option premiums due to greater potential for profit.
Option Greeks: These are critical tools to quantify risks and potential rewards:
Delta: Sensitivity of option price to changes in the underlying asset price.
Gamma: Rate of change of delta.
Theta: Time decay, or how an option’s value decreases as expiration nears.
Vega: Sensitivity to volatility changes.
Rho: Sensitivity to interest rate changes.
Additionally, American vs. European options is an important distinction. American options can be exercised anytime until expiration, whereas European options can only be exercised at expiration. While this sounds straightforward, it profoundly affects pricing and strategy.
Option contracts are standardized in terms of quantity, strike prices, and expiration cycles on exchanges. This standardization allows traders to combine options in sophisticated strategies such as spreads, straddles, and butterflies.

Turning a Small Account into Big Gains1. Understanding the Reality of Small Accounts
1.1. Challenges of Small Accounts
Small accounts, typically under $10,000 (or equivalent in local currency), face specific hurdles:
Limited risk buffer: A few losing trades can quickly wipe out capital.
Higher transaction cost impact: Brokerage, slippage, and fees hit smaller accounts proportionally harder.
Psychological pressure: Each trade carries a heavier emotional load.
1.2. Advantages of Small Accounts
Flexibility: Small accounts can adapt faster than large ones in volatile markets.
Learning opportunity: Mistakes are less costly if proper risk control is applied.
High growth potential: With consistent strategy, small accounts can compound quickly.
2. Setting Realistic Goals
2.1. Understand Your Expectations
Small accounts cannot double overnight without extreme risk. Unrealistic expectations lead to impulsive trading and large drawdowns.
2.2. Focus on Percentage Gains, Not Absolute Gains
A small account should focus on achieving 1–3% gains per week rather than aiming for “make a fortune tomorrow” trades. For example, turning $1,000 into $1,500 over a few months is far more sustainable than risking 50% in one trade.
2.3. Define Clear Targets and Milestones
Break down goals into:
Daily: Small, achievable targets (e.g., 0.5–1% per day)
Weekly: Slightly larger accumulation targets (e.g., 2–3% per week)
Monthly: Milestones for compounding growth (e.g., 8–12% per month)
3. Choosing the Right Market and Instruments
3.1. High-Liquidity Markets
Small accounts benefit from trading instruments with high liquidity:
Stocks with high average volume
Futures contracts like Nifty, Bank Nifty, or E-mini S&P
Forex pairs with tight spreads
3.2. Avoid Illiquid or Exotic Instruments
Low-volume stocks or rare derivatives can spike unpredictably, which can wipe out small positions.
3.3. Leverage with Caution
Margin trading can amplify gains but also losses.
Use leverage sparingly. For small accounts, 2–3x leverage is generally safer than 10x or more.
4. Risk Management is Non-Negotiable
4.1. Position Sizing
Risk no more than 1–2% of your capital per trade.
For example, if you have $1,000, risk $10–$20 per trade. This protects you from catastrophic losses.
4.2. Stop Losses and Take Profits
Always use stop-loss orders to protect capital.
Define your risk-to-reward ratio. Ideally, aim for 1:2 or 1:3 risk/reward setups.
4.3. Avoid Overtrading
Trading too frequently leads to high costs and emotional mistakes.
Focus on high-quality setups, not quantity.
5. Developing a Proven Trading Strategy
5.1. Technical Analysis Strategies
Trend following: Identify stocks or indices with clear trends and ride them.
Breakout trading: Enter when price breaks key support/resistance levels.
Swing trading: Hold positions for days or weeks to capture medium-term trends.
5.2. Fundamental Analysis
For small accounts, fundamental investing (buying undervalued assets) can complement short-term trading.
Focus on high-quality companies or ETFs for slower, steady growth.
5.3. Algorithmic or Rule-Based Trading
Small accounts can use simple rules-based strategies to minimize emotional trading.
Example: Buy when a 20-day moving average crosses above the 50-day moving average, with a strict stop-loss of 2%.
6. Compounding Gains
6.1. The Power of Compounding
Compounding is the process of reinvesting profits to generate additional returns.
Example: $1,000 with 5% weekly growth can become over $3,300 in 12 weeks if profits are reinvested.
6.2. Avoid Taking Excessive Risk While Compounding
Resist the temptation to increase trade size aggressively.
Incremental growth is safer than risking the entire account on one “big” trade.
7. Trading Psychology
7.1. Emotional Discipline
Fear and greed are your biggest enemies.
Use journaling to track emotions, trade decisions, and outcomes.
7.2. Handling Losses
Accept losses as part of trading.
Avoid revenge trading or trying to “win back” losses immediately.
7.3. Patience and Consistency
Small accounts grow slowly at first.
Patience is crucial to avoid impulsive trading.
8. Leveraging Technology and Tools
8.1. Trading Platforms
Choose platforms with low fees, good charting tools, and fast execution.
Examples: Zerodha, Upstox, Interactive Brokers.
8.2. Alerts and Automation
Set price alerts for breakout levels or trend reversals.
Automation helps small accounts act quickly without constantly monitoring charts.
8.3. Data Analysis Tools
Volume profile, moving averages, and relative strength indicators can identify high-probability trades.
Keep strategies simple; avoid overcomplicating small account trading.
9. Learning from Mistakes
9.1. Maintaining a Trade Journal
Record every trade with entry/exit, rationale, outcome, and emotions.
Analyze patterns to refine your strategy.
9.2. Continuous Education
Read books, follow market news, and study technical/fundamental analysis.
Attend webinars or courses focused on small account trading.
9.3. Adapt and Evolve
Market conditions change; your strategy should adapt.
Avoid sticking rigidly to a losing approach.
10. Case Studies of Small Account Growth
10.1. Example 1: Trend Following in Stock Markets
Initial capital: $2,000
Average weekly return: 2%
Account after 6 months: ~$2,600
Key factors: Discipline, risk management, and trend identification
10.2. Example 2: Swing Trading Futures
Initial capital: $5,000
Targeted risk per trade: 1%
Consistent wins with 1:2 risk/reward ratio
Compounded gains turned account into ~$7,500 in 4 months
11. Common Mistakes to Avoid
Chasing losses – Increases risk of blowing the account.
Over-leveraging – Small accounts cannot sustain high leverage.
Ignoring transaction costs – Commissions and fees can eat up small gains.
Overcomplicating strategies – Simplicity beats complexity in small accounts.
Neglecting psychology – Emotional decisions destroy small accounts faster than bad strategies.
12. Mindset for Success
Patience: Small accounts grow slowly but steadily.
Discipline: Stick to rules, stop-losses, and risk management.
Adaptability: Be ready to change strategies if market conditions shift.
Resilience: Accept losses without derailing your plan.
Learning-oriented: Every trade, win or lose, is a lesson.
Conclusion
Turning a small account into big gains is not about finding a “get-rich-quick” scheme. It’s about combining strategy, risk management, discipline, and psychology to consistently grow capital. Small accounts have the advantage of agility and the potential for rapid compounding if approached correctly. By understanding the market, choosing the right instruments, and adhering to a strict set of rules, even modest capital can be transformed into substantial wealth over time.
Small account trading is a marathon, not a sprint. Consistent growth, patience, and learning from mistakes will ultimately separate successful traders from those who burn out early. With the right mindset and approach, big gains are not just possible—they are a natural result of disciplined trading.
Introduction to Trading and Business Growth1. Understanding Trading: The Core Concept
Trading is the process of buying and selling financial instruments or goods to generate profit. While often associated with financial markets such as stocks, commodities, forex, and cryptocurrencies, trading can also refer to commercial activities involving goods and services. Trading operates on the principle of supply and demand: traders aim to buy low and sell high, capitalizing on price fluctuations.
1.1 Types of Trading
Financial Market Trading
Equities (Stocks): Buying shares in companies and profiting from price appreciation or dividends.
Commodities: Trading raw materials like gold, oil, or agricultural products.
Forex: Currency trading based on global exchange rate movements.
Cryptocurrency: Digital currencies traded on specialized exchanges.
Commercial Trading
Retail Trade: Buying goods in bulk and selling to consumers at a profit.
Wholesale Trade: Selling large quantities of products to retailers or businesses.
International Trade: Importing and exporting goods across borders.
Algorithmic & High-Frequency Trading (HFT)
Trading strategies executed through computers using complex algorithms, often capitalizing on millisecond-level market movements.
1.2 Principles of Successful Trading
Market Analysis: Understanding price movements using technical, fundamental, and sentiment analysis.
Risk Management: Limiting potential losses through stop-loss orders, diversification, and position sizing.
Discipline & Patience: Sticking to strategies without letting emotions dictate decisions.
Liquidity Awareness: Ensuring assets can be bought or sold without significant price disruption.
Trading is not just luck; it is a combination of strategy, research, timing, and execution.
2. Introduction to Business Growth
Business growth refers to the expansion of a company’s capacity, market presence, revenue, or profitability over time. Growth is essential for survival in competitive markets and can take various forms: increasing sales, entering new markets, launching new products, or improving operational efficiency.
2.1 Types of Business Growth
Organic Growth
Achieved through internal processes such as expanding product lines, enhancing marketing, improving customer experience, and scaling operations.
Examples: Increasing production, hiring talent, expanding into new cities.
Inorganic Growth
Occurs through mergers, acquisitions, or strategic partnerships.
Provides instant market share and access to resources but may involve higher risks and integration challenges.
Revenue Growth
Focused on increasing sales and turnover through better pricing, marketing, or diversification.
Market Growth
Expanding into new geographies or target audiences.
Product or Service Growth
Developing innovative products or enhancing existing offerings to attract new customers.
Operational Growth
Improving efficiency, reducing costs, and scaling infrastructure to support higher output.
2.2 Key Drivers of Business Growth
Customer-Centric Strategies: Understanding customer needs and delivering superior value.
Innovation & Technology Adoption: Leveraging modern tools and digital transformation to gain competitive advantage.
Financial Management: Optimizing cash flow, investments, and risk exposure.
Market Penetration & Diversification: Entering new markets or offering complementary products.
Talent Acquisition & Retention: Recruiting skilled personnel and fostering an innovative culture.
3. Trading as a Driver of Business Growth
Trading and business growth are closely intertwined. Effective trading strategies can enhance revenue, generate cash flow, and support overall business expansion.
3.1 Trading for Capital Generation
Trading financial instruments can serve as a source of capital for businesses. For example:
Profits from stock trading or forex can fund expansion projects.
Commodities trading can stabilize costs and ensure supply for manufacturing firms.
3.2 Risk Mitigation and Business Stability
Businesses engaged in trading often implement hedging strategies to reduce exposure to market volatility.
Example: Airlines hedge fuel prices to prevent unexpected costs from affecting profitability.
By reducing uncertainty, trading supports predictable cash flows essential for growth planning.
3.3 Strategic Partnerships Through Trade
Trading fosters relationships with suppliers, distributors, and financial institutions.
Strong trade networks can accelerate market expansion and operational scaling.
3.4 Learning Market Dynamics
Traders gain insights into market trends, consumer behavior, and economic cycles.
Businesses that apply these insights can better forecast demand, price products effectively, and expand strategically.
4. Strategies for Sustainable Business Growth
Sustainable growth is achieved through careful planning, resource management, and strategic execution.
4.1 Market Research and Competitive Analysis
Conducting research on competitors, customer preferences, and emerging trends helps businesses identify opportunities.
Tools: SWOT Analysis, PESTEL Analysis, Porter's Five Forces.
4.2 Diversification and Innovation
Diversifying products or services reduces dependency on a single revenue source.
Innovation creates differentiation and strengthens market positioning.
4.3 Marketing and Brand Development
Building a strong brand fosters customer loyalty and supports long-term growth.
Strategies include digital marketing, influencer collaborations, and content-driven campaigns.
4.4 Technology and Digital Transformation
Adopting modern technologies improves operational efficiency and customer experience.
Examples: ERP systems, AI-based analytics, e-commerce platforms, and CRM software.
4.5 Financial Planning and Investment
Growth requires capital investment. Businesses must balance reinvestment with profitability.
Tools: Budget forecasting, cash flow management, ROI analysis.
4.6 Talent Development and Organizational Culture
Skilled employees drive innovation, productivity, and competitive advantage.
Fostering a culture of continuous learning and adaptability is crucial for scaling.
5. Challenges in Trading and Business Growth
Both trading and business expansion come with inherent risks and challenges.
5.1 Market Volatility
Prices in financial markets fluctuate rapidly due to economic news, geopolitical tensions, and market sentiment.
Businesses trading commodities or currencies are particularly exposed.
5.2 Operational Risks
Inefficient processes, supply chain disruptions, or poor management can impede growth.
5.3 Competition
Intense competition pressures pricing, margins, and market share.
5.4 Regulatory Compliance
Adhering to regulations in trading (Securities laws, trade regulations) and business operations is critical to avoid penalties.
5.5 Financial Constraints
Insufficient funding can limit expansion opportunities.
Mismanaged trading positions may lead to liquidity problems.
5.6 Technology and Cybersecurity Threats
Digital trading platforms and business operations are vulnerable to cyberattacks.
Investment in secure infrastructure is essential.
6. Integrating Trading and Business Growth Strategies
A successful enterprise combines trading expertise with a robust growth framework.
6.1 Leveraging Market Opportunities
Businesses can use market analysis from trading to anticipate demand and make strategic decisions.
Example: A commodities trader expanding into food processing can use price trends to optimize procurement.
6.2 Capital Allocation for Growth
Profits from trading can be reinvested into business expansion projects such as new product launches, marketing campaigns, or international expansion.
6.3 Risk Hedging and Contingency Planning
Hedging in trading (e.g., options, futures contracts) protects businesses against price fluctuations.
Contingency plans ensure operations remain stable during economic turbulence.
6.4 Building Strategic Alliances
Trading networks often evolve into partnerships with suppliers, distributors, or even competitors.
Alliances facilitate shared resources, reduced costs, and faster market penetration.
7. Case Studies of Trading Driving Business Growth
7.1 Walmart and Supply Chain Optimization
Walmart’s retail success is deeply tied to its strategic trading and supply chain practices.
Real-time inventory management and bulk procurement allow it to scale rapidly and maintain competitive pricing.
7.2 Apple Inc. and Global Supply Management
Apple’s business growth relies on strategic sourcing and trading agreements with suppliers worldwide.
By controlling procurement costs and ensuring component availability, Apple can launch products at scale.
7.3 Hedge Funds and Capital Growth
Hedge funds leverage trading strategies to generate high returns, which are then reinvested into diversified portfolios.
Successful trading supports long-term growth of fund size and investor trust.
8. Future Trends in Trading and Business Growth
8.1 Digital Transformation
Blockchain, AI, and machine learning are reshaping trading and business operations.
Automated trading platforms and predictive analytics will optimize decision-making and operational efficiency.
8.2 Globalization and International Markets
Global trading expands business opportunities and enables diversification.
Emerging markets offer high growth potential but require careful risk assessment.
8.3 Sustainable and Ethical Practices
Businesses are increasingly integrating ESG (Environmental, Social, and Governance) principles.
Ethical trading and sustainable growth practices attract conscious consumers and long-term investors.
8.4 Data-Driven Decision Making
Big data and analytics empower businesses to understand market trends and consumer behavior.
Real-time trading data informs strategic expansion and risk management.
8.5 Decentralized Finance (DeFi) and Cryptocurrency Trading
DeFi and digital assets open new avenues for trading and capital growth.
Early adoption can create competitive advantages in innovative sectors.
9. Conclusion
Trading and business growth are intertwined pathways to financial success. Trading provides capital, insights, and market intelligence that fuel business expansion, while strategic business growth ensures that profits from trading are reinvested sustainably.
To achieve long-term success:
Businesses must integrate trading strategies with robust growth planning.
Risk management, financial prudence, and innovation are essential.
A forward-looking approach, leveraging technology and global trends, strengthens resilience and scalability.
Ultimately, trading is more than a mechanism for profit—it is a tool for strategic growth, enabling businesses to expand their reach, enhance operational efficiency, and secure a sustainable competitive edge in a dynamic global economy.
Patience is Profit: The Unseen Poetry of Forex Risk Management⚠️ Shocking Truth in Forex Trading ⚠️
Most traders lose not because their strategy is wrong… but because they ignore risk management.
🛡️ Mastering Risk Management in Forex Trading
Risk management is the foundation of long-term success in Forex. Many traders spend their time perfecting entries and strategies, but the real edge comes from how well you manage risk, emotions, and capital. Without these, even the best strategy will fail.
📌 Position Sizing
📉 Never risk more than 1–2% of your account on a single trade.
📏 Adjust lot size according to your stop-loss distance.
⏳ Small, controlled risks keep you in the game long enough to let your strategy work.
🎯 Risk-to-Reward Ratio
⚖️ Always aim for 1:2 or higher risk-to-reward.
📊 Even with just a 40% win rate, a positive RRR keeps you profitable.
🔑 Focus on consistency rather than chasing quick wins.
🧠 Psychology of Risk
😨 Fear makes traders exit winning trades too soon.
💰 Greed convinces them to hold onto losing trades too long.
📝 Build a personal rule: “I follow my plan, not my emotions.”
✔️ Accept losses as part of the business—risk is simply the cost of trading.
📉 Drawdown Control
🚫 Avoid over-leveraging—it magnifies both profits and losses.
🛑 Cap your risk per trade to protect account equity.
🔄 Remember: a 50% loss requires 100% gain to recover. Capital protection comes first.
🔄 Consistency Over Perfection
🎲 No strategy wins every time.
🏦 Risk management allows you to survive losing streaks.
🎰 Think like a casino: edge + probability + discipline = profit.
🧘 Trading Psychology Habits
📖 Keep a trading journal to track results and emotions.
🧩 Detach from outcomes and focus on executing your plan.
☕ Trade only when your mindset is calm and focused.
⚖️ Golden Rule
💎 Protect your capital first—profits will naturally follow.
Discipline, patience, and controlled risk are the keys to turning short-term survival into long-term success.
✅ Final Thought: In Forex, your greatest weapon is not predicting every move but mastering risk management and emotional control. The market always rewards patience, discipline, and consistency—not reckless gambling.
📢 Follow me for more Forex insights, strategies, and trading psychology content.
