Technical AnalysisTechnical analysis is a means of examining and predicting price movements in the financial markets, by using historical price charts and market statistics. It is based on the idea that if a trader can identify previous market patterns, they can form a fairly accurate prediction of future price trajectories.
X-indicator

Support And ResistanceIn trading, support and resistance refer to specific price levels on a chart where the market's price is expected to find either buying support (support) or selling pressure (resistance). Support is where buyers are expected to be plentiful, potentially preventing the price from declining further, while resistance is where sellers are abundant, potentially stopping the price from rising further.

Divergence Based Trading Divergence is typically used by technical traders when the price is moving in the opposite direction of a technical indicator. Positive divergence signals price could start moving higher soon. It occurs when the price is moving lower but a technical indicator is moving higher or showing bullish signals.

Option Trading An option is a contract that represents the right to buy or sell a financial product at an agreed-upon price for a specific period of time. You can typically buy and sell an options contract at any time before expiration. Options are available on numerous financial products, including equities, indices, and ETFs.

Meaning of Management and PsychologyManagement psychology explores how psychological principles and insights can be applied to understand and improve management practices within organizations. It helps managers understand human behavior, motivation, and decision-making processes, ultimately leading to more effective leadership and a better work environment.

Swing Trading AnalysisSwing trading involves the use of technical analysis to identify potential trading opportunities and actively working to make trades based on perceived trends in the market. Popular swing trading indicators include moving averages, RSI, Stochastic oscillator, volume, support and resistance, and ease of movement.

Candlesticks pattern part 2A daily candlestick represents a market's opening, high, low, and closing (OHLC) prices. The rectangular real body, or just body, is colored with a dark color (red or black) for a drop in price and a light color (green or white) for a price increase.

Option Trading AmalysisTop Option Trading Indicators
-Relative Strength Index (RSI) The relative strength index (RSI) is one of the most commonly used indicators. ...
-Bollinger Bands. ...
-Intraday Momentum Index (IMI) ...
-Money Flow Index (MFI) ...
-Put-Call Ratio (PCR) Indicator. ...
-Open Interest (OI)

Candle sticks patternCandlestick patterns are technical trading tools that help traders predict price direction and market sentiment. They are based on past price movements and can help analysts identify shifts in supply and demand, which can aid in predicting trend reversals, continuations, and potential price levels.

Complete Beginner’s Guide to Fibonacci, AutoFibGaugeTitle:
Complete Beginner’s Guide to Fibonacci, AutoFibGauge, and How to Plan Perfect Trades! 🎯
⸻
Many traders hear about Fibonacci but don’t really know what it is or how to use it properly.
Here’s a full beginner-friendly guide covering everything — from the math basics to real trading strategies!
What is Fibonacci?
The Fibonacci Sequence is a set of numbers where each number is the sum of the two numbers before it.
It looks like this:
0, 1, 1, 2, 3, 5, 8, 13, 21, 34, 55, 89, 144…
This simple rule creates a pattern that we see everywhere in nature:
• In the way flowers bloom
• In the spiral of seashells
• In the structure of hurricanes
• Even in galaxies
Nature follows Fibonacci.
Markets, which are built by human emotions (fear, greed, hope), also often follow Fibonacci behavior.
That’s why Fibonacci is important in trading.
⸻
The Special Golden Ratio — 61.8%
From the Fibonacci sequence, if you divide a number by the next one (e.g., 21 ÷ 34), you get approximately 0.618 — or 61.8%.
This is called the Golden Ratio.
The Golden Ratio shows up in art, architecture, music, human faces, and… yes, financial markets.
In trading, the 61.8% retracement is considered the strongest potential turning point.
If a price pulls back by around 61.8%, there’s a high chance it will bounce and continue the trend.
⸻
What is Fibonacci Retracement in Trading?
In trading, after a big move (up or down), the market rarely moves in a straight line.
It pulls back (corrects) before continuing.
Fibonacci Retracement levels help us predict where the pullback might end and the trend might continue.
Commonly Used Fibonacci Levels:
• 23.6% — Very shallow retracement
• 38.2% — Healthy pullback
• 50.0% — Halfway mark (not a Fibonacci number, but widely watched)
• 61.8% — Golden zone (high probability area)
• 78.6% — Deep retracement before a reversal
Traders look at these levels as support and resistance zones.
⸻
What is AutoFibGauge?
Normally, drawing Fibonacci manually takes time — you have to find correct swings and plot retracement.
AutoFibGauge does it automatically:
• Detects swing highs and swing lows
• Plots Fibonacci retracement levels instantly
• Keeps updating live as price moves
✅ Saves time
✅ Reduces human error
✅ Keeps your chart clean and professional
It’s built for traders who want speed, simplicity, and reliability.
⸻
My Default Settings for AutoFibGauge:
• Swing Length: 25
• Fib Levels Displayed: 23.6%, 38.2%, 50.0%, 61.8%, 78.6%, 100%
• Mode: Automatic (finds swings without needing to adjust)
• Visual: Bands instead of just thin lines (for easier viewing)
Adjustment Tip:
• 15 min chart: Swing Length 20–25
• 1 Hour chart: Swing Length 25–30
• 4 Hour chart: Swing Length 30–40
Higher timeframes = Slightly bigger swing lengths.
⸻
How to Plan Entry:
1. Wait for price to approach a major Fibonacci level (especially 38.2%, 50%, or 61.8%).
2. Watch how the candles behave:
• If you see a bullish engulfing candle, hammer, or strong bounce from the level → Good sign to buy.
• If price hesitates or gives bearish reversal → Could signal continuation of downtrend.
3. Combine with trend confirmation tools (QMA, Parabolic SAR, moving averages).
✅ Remember: Confirmation is key.
Don’t just blindly buy or sell because price touched a level.
⸻
How to Plan Exit:
• Set first target at the next major Fibonacci level.
Example:
• If you enter near 61.8%, target 38.2% or 23.6%.
• Another method: Trail your stop-loss behind swing highs/lows as price moves in your favor.
✅ This way you lock profits even if the market reverses later.
⸻
When Fibonacci Works Well:
✅ In trending markets (clear uptrend or downtrend)
✅ When combined with price action or indicators
✅ After strong impulsive moves followed by natural pullbacks
⸻
When Fibonacci Might Not Work Well:
❌ In sideways (rangebound) markets
❌ During extreme news events or unexpected volatility
❌ When used alone without confirmation
Always remember — Fibonacci levels are not magical.
They are guidelines, not exact rules.
You need to combine them with market structure and momentum for best results.
⸻
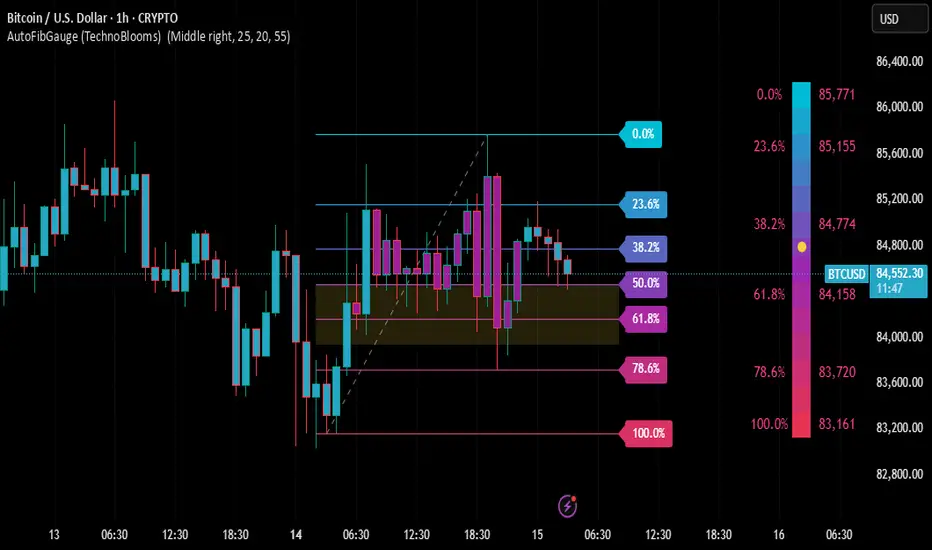
Real Example (BTC/USD 1H Chart):
• After a rally, price retraced into the 50%-61.8% zone.
• Bullish candles appeared showing price respecting the zone.
• This was an excellent opportunity to plan a long entry with Fibonacci guidance.
⸻
Final Words:
• Fibonacci is not only for “professional” traders — anyone can learn it.
• AutoFibGauge makes using Fibonacci simple and automatic, even if you’re just starting out.
• If you respect the levels, wait for confirmation, and follow a disciplined plan, Fibonacci becomes one of your best trading tools.
⸻
Found this helpful? Tap LIKE ❤ & FOLLOW ➕ for more beginner-to-advanced trading guides every week!
⸻
#Fibonacci #AutoFibGauge #FibonacciRetracement #TechnicalAnalysis #PriceAction #TradingTools #LearnTrading #CryptoTrading #ForexStrategy #SwingTrading #BeginnersGuide
Database Trading Analysis Part 3Advanced database trading analysis combines powerful database technologies with sophisticated data analysis techniques to gain deeper insights into financial markets and improve trading strategies. This involves using techniques like data mining, OLAP, predictive modeling, and machine learning to analyze large datasets and make informed predictions. The goal is to identify patterns, trends, and anomalies that can be used to make profitable trading decisions.

MACD Analysis Part-2Moving average convergence/divergence (MACD) is a technical indicator to help investors identify price trends, measure trend momentum, and identify entry points for buying or selling. Moving average convergence/divergence (MACD) is a trend-following momentum indicator that shows the relationship between two exponential moving averages (EMAs) of a security’s price. MACD was developed in the 1970s by Gerald Appel, and is one of the most popular technical tools, readily available on most trading platforms offered by online stock brokers.

MACD TradingMoving average convergence/divergence (MACD) is a technical indicator to help investors identify entry points for buying or selling. The MACD line is calculated by subtracting the 26-period exponential moving average (EMA) from the 12-period EMA. The signal line is a nine-period EMA of the MACD line.

PCR (PUT and CALL) RatioThe Put-Call Ratio (PCR) is a popular technical indicator used by investors to assess market sentiment. It is calculated by dividing the volume or open interest of put options by call options over a specific time period. A higher PCR suggests bearish sentiment, while a lower PCR indicates bullish sentiment.

Option and Database TradingOption trading involves buying or selling contracts that grant the right, but not the obligation, to buy (call option) or sell (put option) an underlying asset at a specific price within a certain time frame. It's a form of derivative trading, where the value of the option is linked to the price of the underlying asset, such as stocks, indices, or ETFs.

More About RSIRSI is a tool that aids traders in capturing market momentum by measuring the fluctuation in prices. Traders rely on RSI to spot oversold and overbought markets and determine the right time to enter a trade. RSI helps traders identify whether a stock is either overbought or oversold.

RSI and RSI Divergence Part 2RSI (Relative Strength Index) is a momentum indicator that measures recent price changes to assess if an asset is overbought or oversold. RSI divergence occurs when the price of an asset and its RSI move in opposite directions, potentially indicating a trend reversal or weakening trend. There are two main types: bullish divergence (price makes lower lows while RSI makes higher lows) and bearish divergence (price makes higher highs while RSI makes lower highs).

Advanced Divergence Trading AnalysisA positive divergence means price is making lower lows while an indicator/oscillator is making higher highs. On the other hand, a negative divergence happens when price is making higher highs while an indicator/oscillator is forming lower lows.

Bollinger Bands Analysis of INDUS TOWERS LTDBollinger Bands Components:
Middle Band: This is the simple moving average (SMA), typically set to a 20-period average. It represents the average closing price over the selected period and acts as the baseline for the bands.
Upper Band: This is the middle band plus two standard deviations. It represents a level where the price is considered to be overbought or in an overextended condition.
Lower Band: This is the middle band minus two standard deviations. It represents a level where the price is considered oversold or at a potential support level.
Price and Bollinger Bands:
When the price is near the upper band, it suggests the stock may be overbought or at risk of a pullback.
When the price is near the lower band, it suggests the stock may be oversold or could experience a bounce.
If the price is within the bands, it indicates that the price is in a normal range relative to recent price action.
Volatility Indicator:
The bands expand when the market is volatile and contract when volatility decreases.
In this chart, you can see periods where the bands widen (e.g., from October to December) and periods when they contract (e.g., February to April).
Price Action Around the Bands:
The stock has recently broken above the upper Bollinger Band, signaling a potential bullish breakout or overbought condition.
A close above the upper band (like what is happening in April 2025) might suggest that the price could continue higher or face a pullback if momentum slows down.
Interpretation of Current Action:
The price is trending upwards, crossing the upper Bollinger Band. This might indicate that momentum is strong, but traders should also be cautious of a reversal if the price becomes too extended.
In summary, Bollinger Bands help to identify overbought and oversold conditions, and the width of the bands shows volatility. The current trend suggests a breakout, but it’s important to keep an eye on price action for potential reversals or continued momentum.

Option and Database tradingOptions data providers collect specific data points that can later be used to determine price movements over time. These price changes in the stock market help investors and brokers decide which stocks might be ideal to sell or buy given current market conditions.

Option Chain TradingAn option chain is a comprehensive listing of all available option contracts for a specific underlying asset, typically organized by expiration date and strike price. It provides a detailed view of call and put options, their premiums, and other relevant information like bid/ask prices, volume, and open interest. This tool is crucial for options traders to analyze market conditions, identify potential trading opportunities, and choose the right options contracts based on their investment strategy.

Candlesticks Pattern Candlestick patterns are graphical representations of price movements used in technical analysis to identify potential future price trends and reversals, based on the open, high, low, and close (OHLC) prices of a security over a specific period.

Explain RSI (Relative Strength Index)The Relative Strength Index (RSI) is a momentum oscillator, a technical analysis tool, used to measure the speed and magnitude of price changes, helping traders identify potential overbought or oversold conditions in an asset.
