X-indicator


BALKRISHNA INDIt continues to take support on any dip near its Kijun (Ichimoku Analysis) support regularly making higher highs and higher lows. This time too its attempting a resumption of trend which might take it to 1475 / 1525 if it manages to hold above 1375 on hourly basis.
Ichimoku is a Japanese study based on Moving Averages wherein the alignment of certain specific ones give a trend based signal with momentum both in terms of price and time.


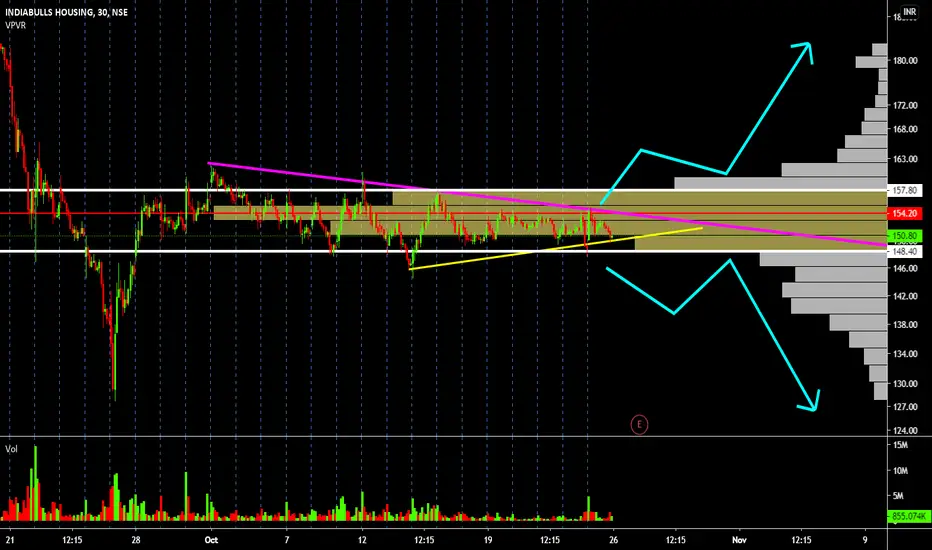
IBULHSG - SHOWING VERY STRONG SIGNS OF ACCUMLATIONIBULLHSG WILL GIVE BIG RETURNS FOR SURE
EXPECT BIG MOVE AFTER BREAKOUT AND PULLBACK

GODREJ CP - SHOWING SIGNS OF SELLING CLIMAXGODREJ CP -SHOWING SIGNS OF SELLING CLIMAX
NEW BUYING VOLUMES ARE EMERGING AGAIN
SOON CAN SHOW UPSIDE MOVE IF IT HOLDS 660


DOW Futures - UpdateDOW Futures could see 30500, depending on the election results... Will track the break out either side... Upwards will take it to 30500... downwards will be free fall..


BPCL - GAP FILLEDBPCL - GAP FILLED - NOW LOOKS GOOD TILL IT HOLDS 340 LEVELS - TGTS CAN BE AROUNT 380-400


